


Now you can supercharge your Smartlook Dashboard with new Tiles.
Below are some examples:
Now you can expand your Dashboard with:
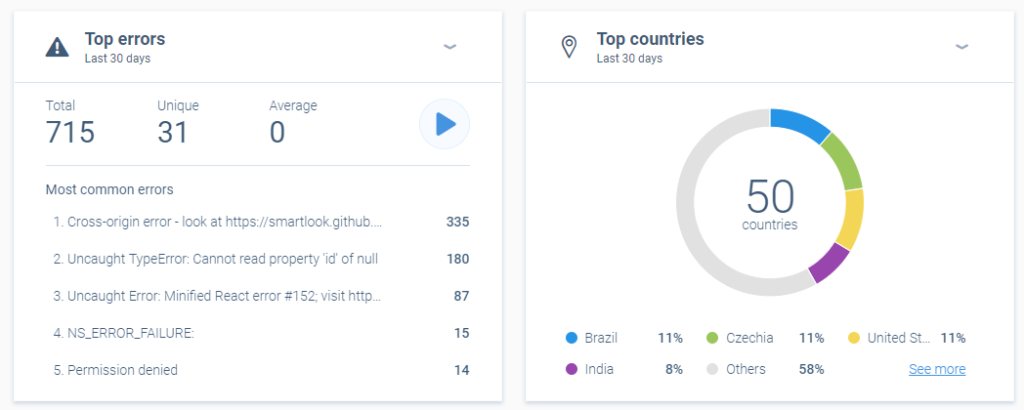
- Top Errors Tile – this tile will present you top 5 errors that occurred on your website. You can see the error, copy it for your developers and see the visitor journeys where these errors occurred.
- Top Visited Pages Tile – which lists the top-visited pages on your website.
- Top Landing Pages Tile – will show you which pages are the most frequent starting point for users on your website.
- Top Exit Pages Tile – tile will show you the most frequent pages your users are leaving your website from.
- Top Countries Tile – breakdown will provide you insight on the country source of your traffic.
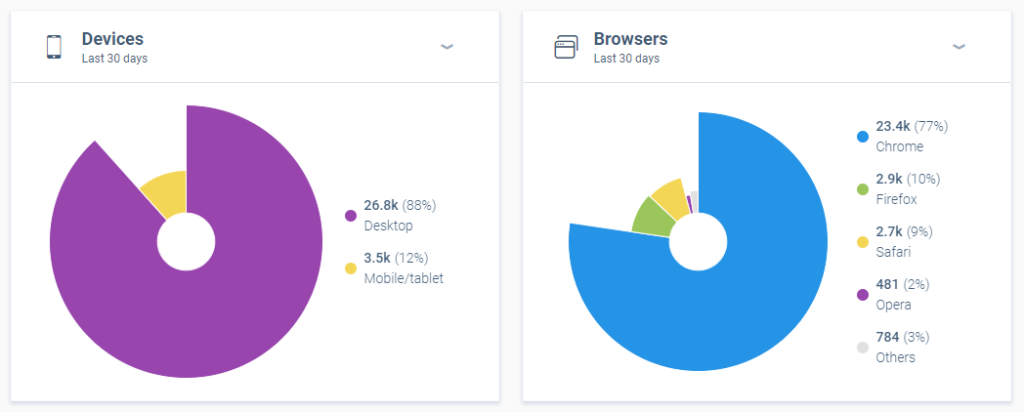
- Top Devices & Top Browsers – these two will show you the technology profile of your visitors.
All the new tiles, except top devices and browsers, are directly connected with user session recordings. That means you can use them to filter out Smartlook recordings and further visualize user journeys.
Adding the new tiles is easy, just click the Add New Tile plus sign:
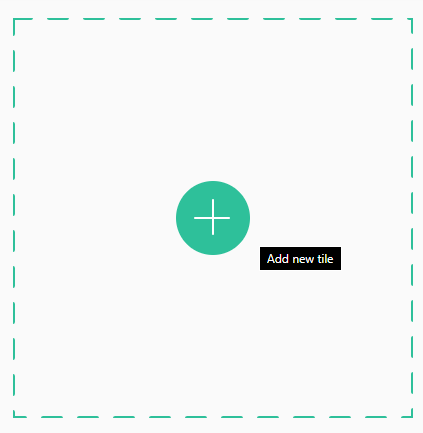
And pick the one you wish to add from the expanded menu.
Heads up though, onwards we’re going to populate these tiles in your Smartlook Dashboard automatically.
Is there a tile you’d love to see us add to the mix? Let us know from inside of the Smartlook, here in the comments or via social media.
New Heatmaps Features
We also introduced several neat features for easier heatmap management and clearer aggregate data analysis.
One of the new features is the ability to set the Intensity and Opacity of the heatmap spots.
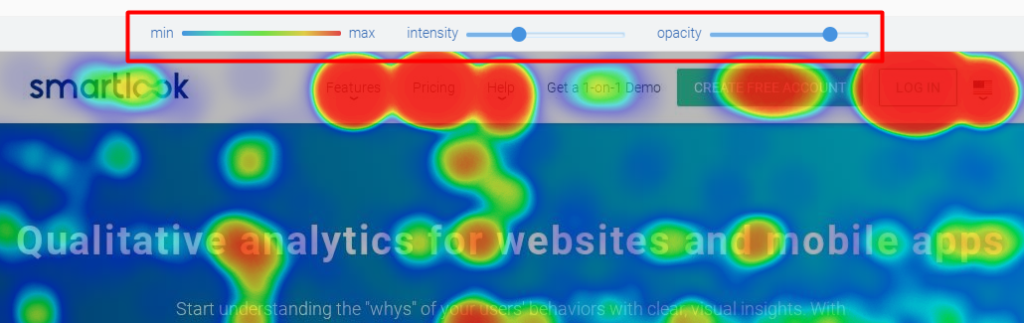
With these two, you can tweak the visualization to better understand where the interactions occurred and with what intensity.
Another addition to Smartlook Heatmaps can be found right next to the Share button.
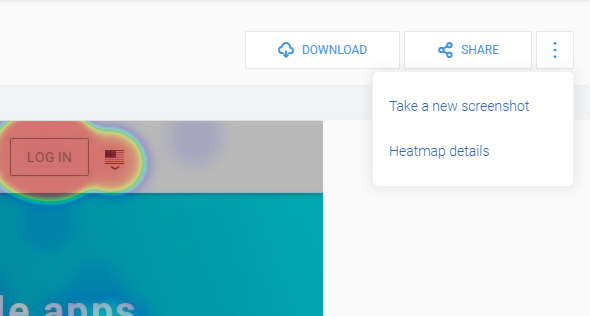
Within the 3-dots-menu you now can Take a new screenshot and review the heatmap details.
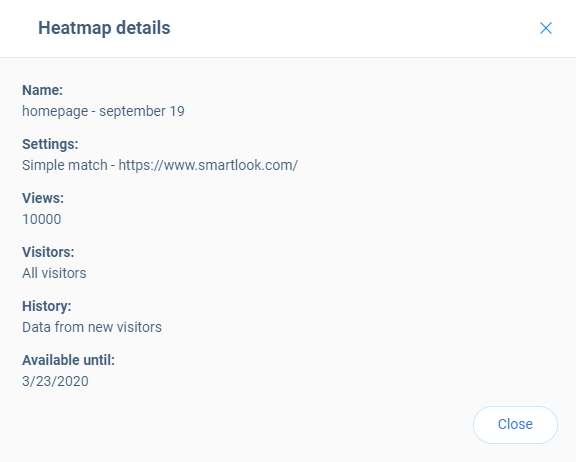
The Heatmap detail shows you the parameters you’ve defined during Heatmap creation. Also, in this info panel, you’ll be able to see the Expiry date of that specific heatmap.
On the other hand, ‘Take a new screenshot’ option will re-render the heatmap based on the previously defined heatmap parameters & the data collected.
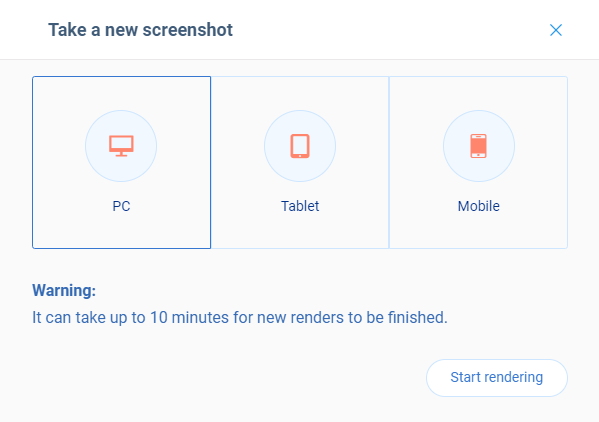
New screenshots can be taken for one or multiple devices at the same time.
This functionality will allow you to fix or re-validate the heatmap presentation whenever you need it. Please note that a re-render may take up to 10 minutes to finish.
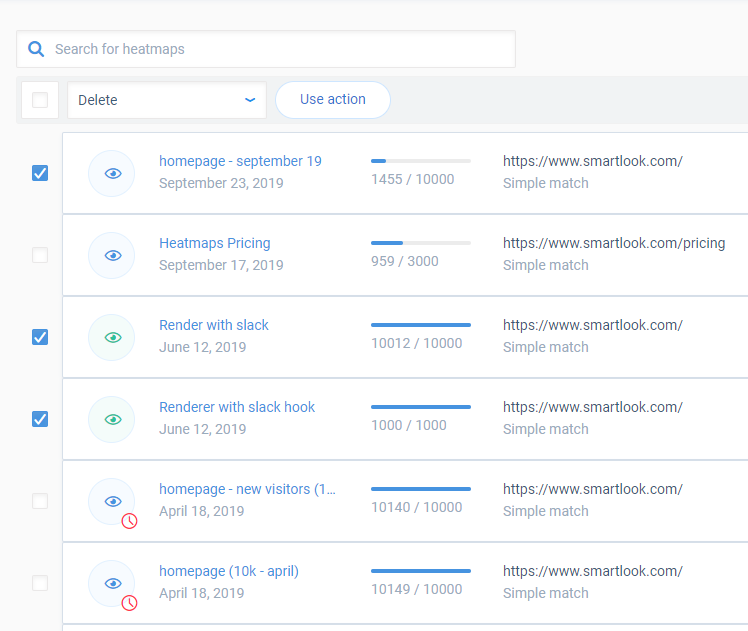
And finally for this release batch — now you can delete heatmaps in bulk.
Once you activate the Delete function:
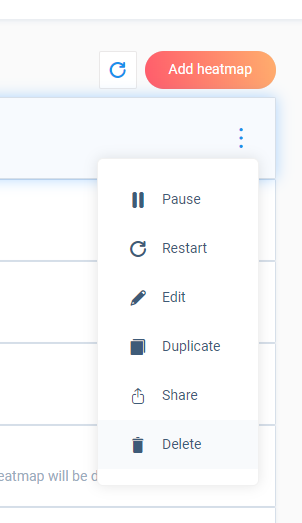
You’ll expand the bulk selection options where you can select heatmaps you want to delete:
And that’s it for this update.
The team is actively working on enhancing Smartlook and developing solutions that provide value to you and your business. And I’d like to invite you to join us in this process.
Reach out to me or the team via Intercom, in the app or social media if there’s something you think we can do to improve our Heatmaps, Dashboard Tiles or Smartlook in general.


