Mobile game analytics tools are a vital part of any game developer’s toolkit. They help you analyze what players are doing, calculate metrics and KPIs like daily active users or retention rates, and find bugs or other user experience issues.
However, merely knowing what’s happening in your game doesn’t tell you how to improve players’ experience or boost your revenue.
This is where most game analytics tools have a big blindspot — they’re typically focused on quantitative analytics, showing you how many users performed a certain action, or maybe giving you a text-based log of all the actions a single user performed in a session. However, without session recordings, you don’t get an accurate understanding of the actual user experience.
This blindspot has two big consequences:
- It’s hard to analyze game mechanics and improve revenue, user retention, or other essential metrics. For example, it’s relatively easy to track how many people bought a paid add-on for a character in your game. However, to understand why they did so, or why they didn’t buy add-ons for other characters, you need to look at the entire experience from their point of view. Without that, you can easily draw misleading conclusions about players’ behavior.
- You can’t see the exact circumstances that led to bugs, crashes, or other issues. This means mobile game developers and QA testers have to guess what went wrong when trying to debug. Reproducing issues this way takes tons of time and effort since you’re relying solely on quantitative data and — when available — users’ explanations.
In short, traditional game analytics platforms and tools tell you what happened in your game (e.g., logins, purchases, bugs, or other events), but not why.
In this guide, you’ll learn how to change that with the help of our tool, Smartlook.
We’ll first show you how to track these six essential mobile game metrics:
- Daily active users
- Monthly active users
- Stickiness rate
- Retention rate
- Average revenue per daily active user
- In-game purchases
Then, you’ll learn how to analyze players’ behavior, improve their experience, and debug your game faster by combining session recordings with events and funnels.
You’ll also see how two game companies (Vertigo Games and Madfinger Studios) use Smartlook to optimize their development process and gamers’ experience.
You can try Smartlook on your mobile game today with a free account (no credit card required). Our tool has SDKs for 10 native mobile app and game platforms, frameworks, and engines — including iOS, Android, Unity, and Unreal Engine — and can also be used for website analytics.
The impact of UX on mobile game performance
In this article, we’ll give you more than a handful of KPIs to track and a few tips to boost them. Our goal is to help you create a seamless gaming experience based on the wealth of user experience (UX) data you have at your disposal.
Understanding how UX design factors into mobile game performance is the first step toward reaching this objective. So let’s begin by exploring the impact your mobile game UX has on three crucial aspects that form mobile game success, namely player engagement, retention, and monetization:
1. Player engagement
It’s no secret that engaged players are more likely to invest time and money into your game. Here’s how UX design shapes player engagement:
- Intuitive onboarding. A well-designed onboarding process ensures new players quickly understand game mechanics and feel competent from the start. Players who effortlessly grasp the basics are more likely to continue playing
- Visual and auditory appeal. Engaging graphics, animations, and sound design contribute to a game’s overall allure
- Responsive user interface (UI). Frustration caused by clunky menus or confusing layouts can drive players away
2. Player retention
Once you’ve attracted new gamers, you need to retain them. A game’s UX design plays a pivotal role in keeping players coming back for more:
- Smooth performance. Technical glitches, lag, and long loading times all deter players from returning
- Intriguing content. Regular updates and fresh content keep players engaged over the long term. UX design includes how new content is introduced and integrated into a game
- Personalization. Personalized experiences, like personalized recommendations or rewards, enhances retention
3. Monetization strategy
Monetization is a critical aspect of mobile game development. Here are three ways UX design influences how players interact with monetization elements:
- In-game purchases. A great UX design seamlessly integrates in-game purchases into the gaming experience, making them easily accessible rather than disruptive
- Ad Integration. If your game relies on ads for revenue, your UX design determines how ads are integrated into the gameplay. Poorly placed or disruptive ads can frustrate players and lead to churn
Subscription models. For games with subscription-based monetization, UX design ensures that subscription options are clear and enticing, encouraging players to opt for premium experiences
How to track 6 essential mobile game metrics
There are two fundamental categories of metrics that nearly all companies in the gaming industry need to track — user engagement and monetization. The first four metrics on our list measure aspects of user engagement, while the last two can help you determine if your monetization strategy is working.
Before we begin, keep in mind that both metric types are inherently connected. The more fun and engaging your game, the more chances you have to increase revenue and vice versa. That’s true whether your game makes money through ad revenue, monthly subscriptions, or microtransactions (i.e., in-game purchases).
#1 Daily active users and #2 monthly active users
These first two metrics are pretty straightforward to understand and calculate:
- Daily active users (DAU) is the number of users who open your game in a day. Mobile games typically require high daily usage to be successful, as opposed to, say, a banking app, for which high monthly usage might be the goal. That’s why increasing DAU as much as possible is usually an important goal for mobile game companies.
- Monthly active users (MAU) is the number of users who opened your game at least once during the month.
Smartlook automatically calculates both DAU and MAU for you. You can see how in our free public demo (no registration or credit card required).
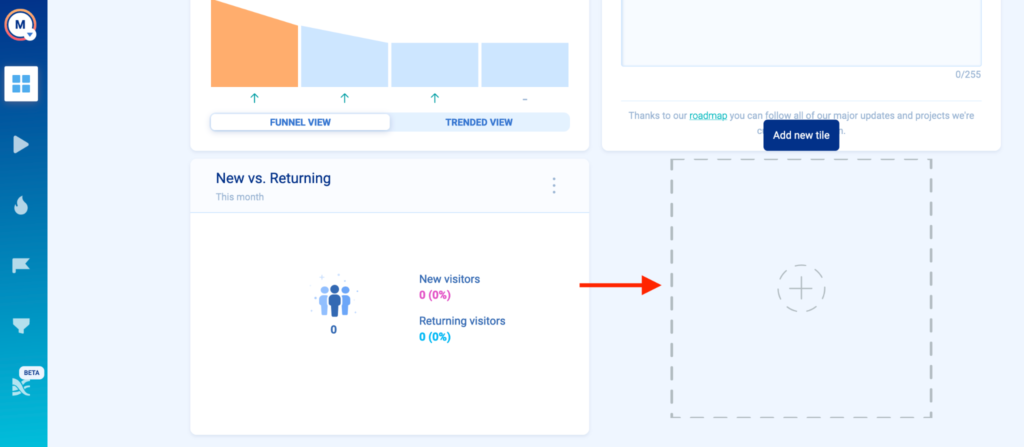
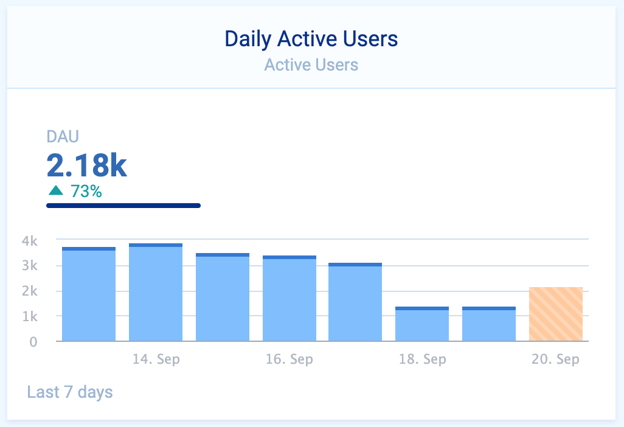
Inside the Smartlook dashboard, click on “Add new tile”:
Go to “Active Users”, where you can choose between daily, weekly, or monthly mobile game active users, plus the data range you want to analyze (seven, 30, or 60 days).
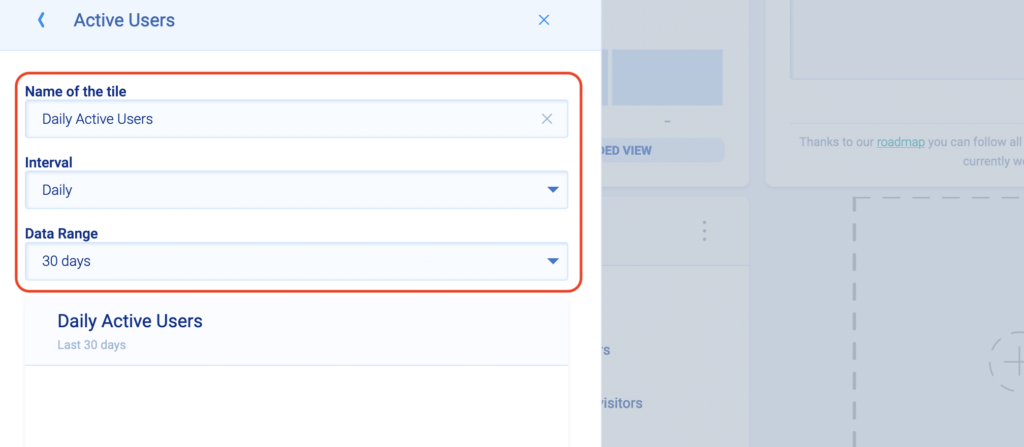
Finally, click “Save” and the newly created tile will appear in your dashboard. That way, you can easily keep track of your daily, weekly, or monthly active users every time you open Smartlook.
Now, while these metrics are important, they can’t tell you a lot about your game’s user experience. They only track how many users opened your game, but don’t show anything about their experience afterward. That’s where session recordings come in, which we’ll talk about later (but click here if you want to jump to that section).
DAU and MAU are also the basis for calculating the next essential user engagementmetric — stickiness rate.
#3 Stickiness rate
Your game’s stickiness rate is the ratio between DAU and MAU. That’s why it’s sometimes referred to as the stickiness ratio or the DAU/MAU ratio.
- Stickiness rate = DAU/MAU*100
Calculating stickiness is one way to judge your game’s ability to keep players coming back daily (the other being retention). For example, if your game has 400 DAU and 5000 MAU, you get a stickiness rate of 8% (DAU/MAU*100). This means that in a 30-day month, the average player opens your game on 8% of the days, or on 2.4 days out of 30.
This ratio is a good approximation for your users’ engagement. Higher stickiness means more daily engagement, which leads to higher retention, which in turn means more opportunities to generate revenue.
#4 Retention rate
There are a few different methods and formulas for tracking retention, depending on your user engagement goals.
Again, for mobile games, keeping daily usage high is typically the goal, so it’s crucial to track how many people come back to your game each day after first logging in. Or in other words, you want to track retention on a daily basis.
Similar to stickiness, the better your mobile game retention, the more chances you have to increase users’ lifetime value (LTV). Also, retaining existing customers is much cheaper than bringing in new ones.
To calculate retention, you first need a user action (i.e., event) to follow over a period of time. For example, you may want to follow the log in event, so you can track how many of the users that log into your game for the first time on a specific date continue to do so each following day. The group of people you track (in this case users logging in for the first time) is called a cohort.
For example, say 1,200 users logged into your game for the first time on a specific day — Day 0. If 280 of them logged into your game again on the next day — Day 1 — you’d have a Day 1 retention rate of 23.33% (280/1200*100). Once you have that baseline, you can judge how changes to your onboarding or game tutorials affect Day 1 retention for the next user cohorts.
Smartlook has a special feature called Retention Tables, which lets you track user cohorts over time and calculates retention for you.
Here’s how you can create a retention table in Smartlook:
First, you need to select the event (user action) for which you’d like to analyze retention. Smartlook lets you create custom events to track pretty much anything your users do, including logging in to their account. You can read more about Smartlook’s events here.
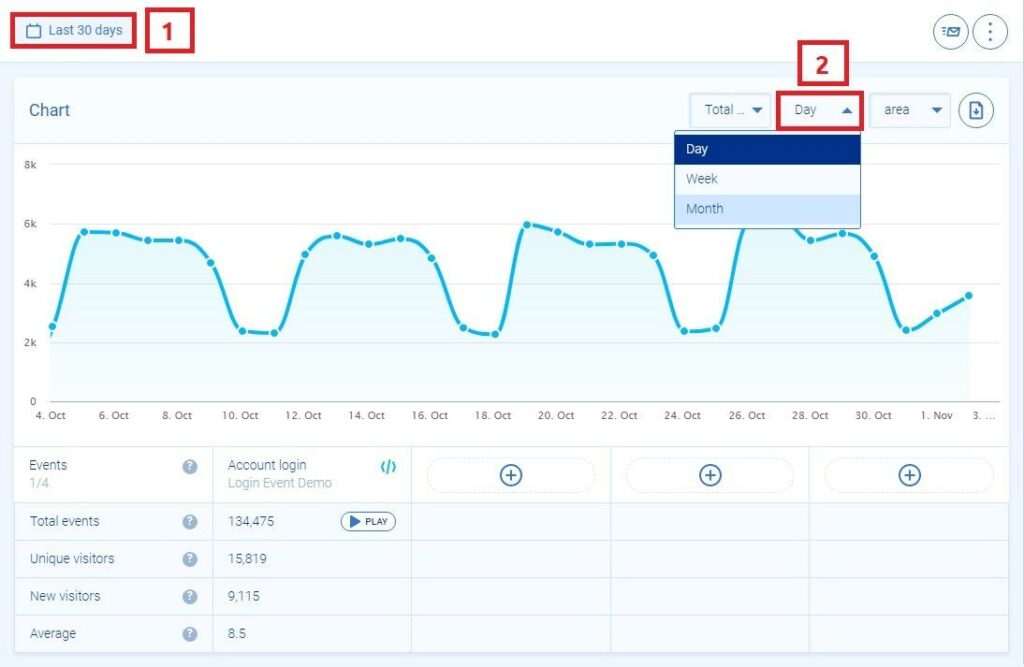
Once you have your event, you can select (1) the data range and (2) whether Smartlook should display the data by day, week, or month.
After that, scroll down to the “Retention table” section, click on “Generate”, and you’ll see a retention table similar to this one below.
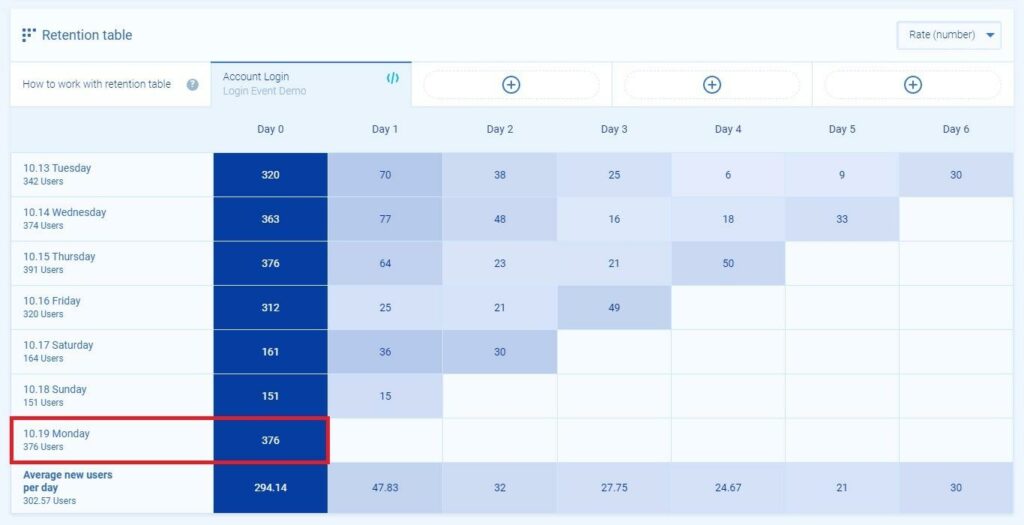
As you can see in the screenshot above, 376 users completed the “Account Login” action on Monday, 10.19, which is our Day 0. This group of users is our cohort, which we’ll track over the next few days.
Here’s the retention data for the next 5 days:
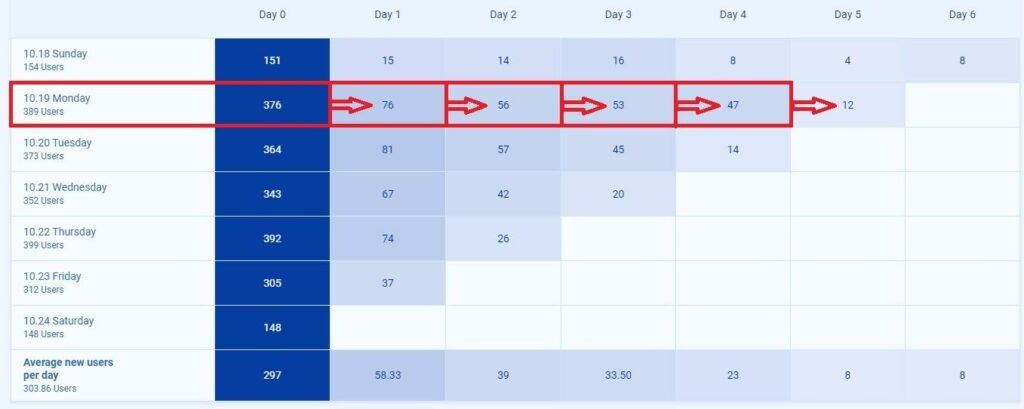
As you can see, on Day 1, 76 (20%) of the 376 users performed the action again. That number gets progressively lower, with a big drop between Days 4 and 5.
#5 Average revenue per daily active user
Average revenue per daily active user (ARPDAU) is a fundamental metric for your monetization strategy.
- Average revenue per daily active user (ARPDAU) = Daily revenue/DAU.
For example, if your game generates $5000/day in revenue and you have 370 DAU, your ARPDAU would be $13.51.
It’s important to track ARPDAU after big marketing campaigns, changes to your pricing, feature releases, or other upgrades to your game. And, if you know your daily revenue, it’s really easy to calculate ARPDAU with Smartlook, since our tool already tracks DAU by default.
Again, this metric won’t tell you how to improve your game design or revenue, but it’s still a good indicator of your monetization strategy’s success.
Also, keep in mind that there are different variations of this metric you could also track, like average revenue per user (ARPU) or average revenue per paying user (ARPPU). While these are also useful, they don’t take into account the relationship between daily usage and revenue, which is vital for mobile games.
For example, someone can download your game from the app store and install it, without ever playing it, even if they’re paying a monthly subscription. The ARPU and ARPPUmetrics usually include this uninterested user base, unless you have a way to exclude it from calculations.
Lastly, it’s important to note that ARPDAU doesn’t differentiate the revenue based on where it’s coming from. If your game has different sources of revenue, like monthly subscriptions and in-game transactions, it’s best to track those separately, alongside ARPDAU.
#6 In-game purchases
If your business model relies on in-app purchases (IAPs, also called microtransactions), it’s vital to create events for tracking each one. Even if players can only make transactions with your in-game currency (without using real money), it’s important to track them, so you can validate if your game mechanics are working correctly.
Again, you can create custom events in Smartlook to track each completed transaction, whether it involves real or fictional currency.
And, since our tool also lets you build and analyze funnels, you can track the users’ journey leading up to a transaction and find where most of them drop off.
For example, funnels are the most prominent Smartlook feature for Vertigo Games — the company behind multiple first-person shooting games like Critical Strike. They’ve built many 30- and 60-step funnels, based on events like in-game offers, purchases, and upgrades. Their QA and product teams both use these funnels to verify their games’ functionality and player experience.
Once you start tracking these six metrics, you’ll have a sense of how well your game is performing.
Is that all? Not exactly…
You’ll need to add more mobile game KPIs to your list based on your specific goals at a given moment.
For instance, to assess your marketing efforts, you’ll need to monitor:
- Cost per install — measures how much it costs to acquire a new user through advertising campaigns
- Ad click-through rate — the percentage of users who click on ads
- Organic conversion rate — measures the percentage of users who install your game after discovering it through organic (non-paid) channels like app store searches or recommendations
- Paid conversion rate — measures the percentage of users who install your game after clicking on paid advertisements
- Return on investment — assesses the profitability of your marketing campaigns by comparing the revenue generated from acquired users to the cost of acquiring them
The following KPIs will help you evaluate your app’s technical performance:
- Server response time — how quickly your game’s server responds to user requests
- Bug and crash reports — the number and types of bugs and crashes encountered by users
- Support requests — the number of inquiries or support tickets submitted by users
The most important mobile game KPIs for product teams are the ones that show how users respond to your design and UX:
- Average session length — the average duration of user sessions within your game
- Session depth — how deeply users navigate within your game during a single session
- Exit rate — the percentage of users who exit your game during a specific interaction or screen
- User feedback — comments, ratings, and reviews provided by players. This offers qualitative insights into user opinions and suggestions for improvement
Best mobile game analytics tools
You don’t need an extensive tech stack to keep track of all these metrics (furthermore, you don’t need to keep track of all those metrics at once). These three tools are more than enough to fulfill your mobile game analytics needs.
Firebase

Firebase Analytics is a comprehensive mobile and web analytics platform from Google. It’s well-suited for both Android and iOS games.
We recommend using this platform for monitoring application stability and addressing technical issues quickly. Use it to monitor key metrics such as app startup time, network requests, and screen rendering to stay updated on your app’s performance.
Survicate
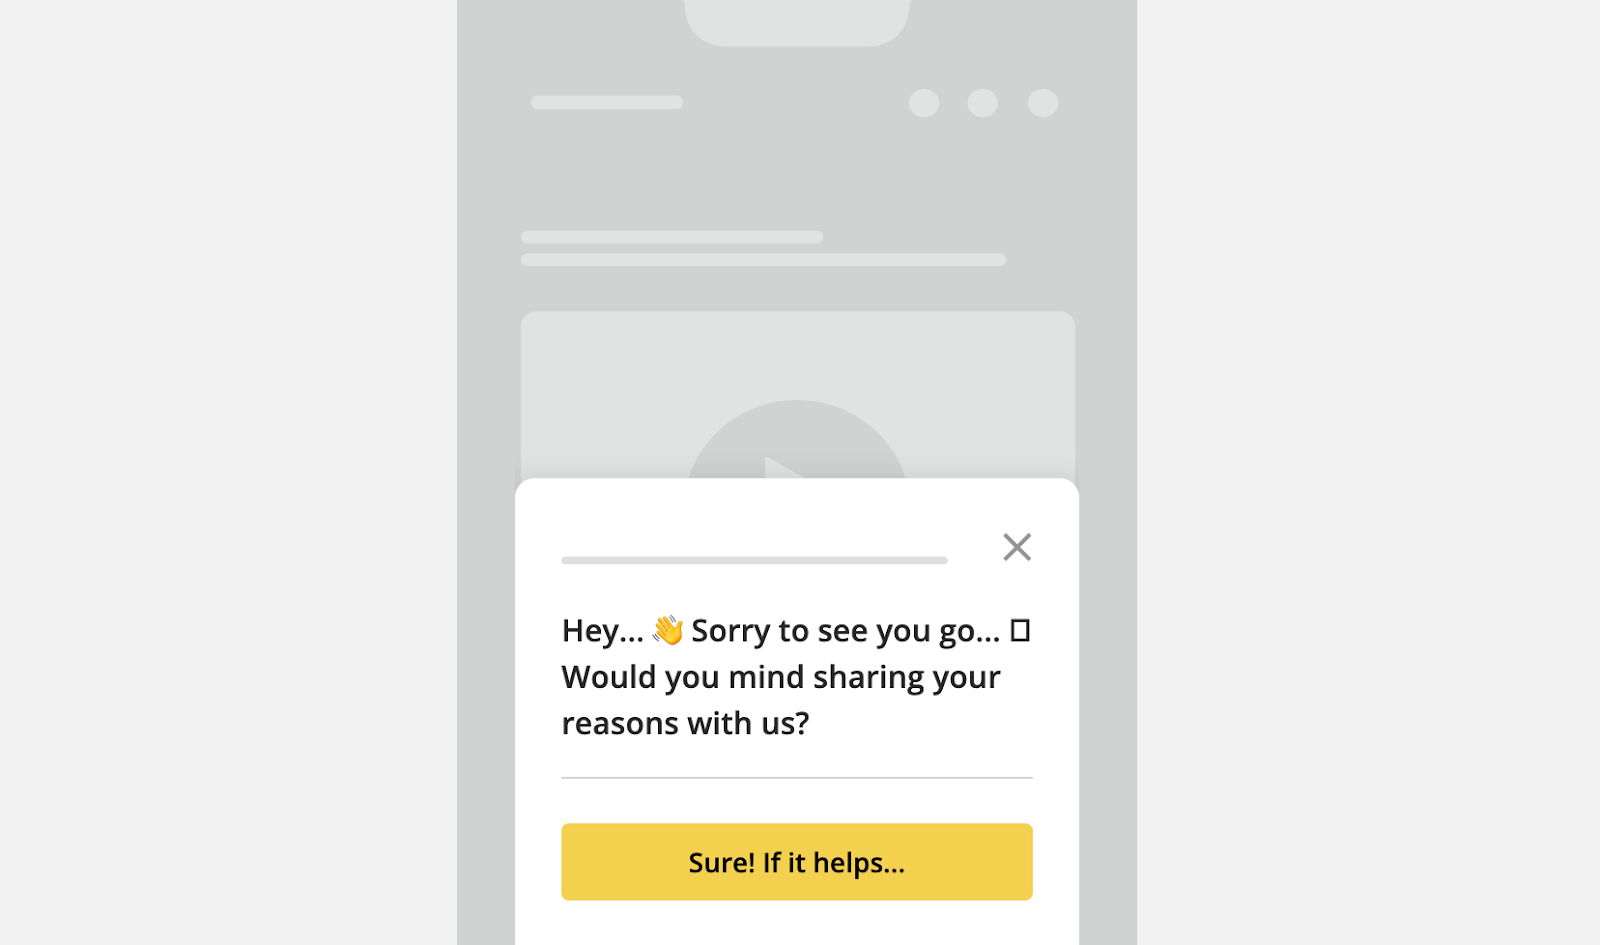
Survicate is a survey tool that allows you to create targeted in-app surveys that don’t disrupt the gaming experience. Collect first-hand feedback with the help of:
- CSAT surveys
- NPS surveys
- Feedback forms
- Use experience surveys
Best of all, automation fires surveys based on user characteristics, in-app events, or other pre-defined rules.
Smartlook

Smartlook is the ultimate mobile app UX platform. It combines mobile and web analytics, allowing you to track user behavior across various platforms — which is particularly useful for cross-platform games.
To create a seamless gaming experience, you must first uncover the friction points in your current UX. Smartlook allows you to track user paths (i.e. funnels), spot what they do and don’t do (i.e. events), and watch individual users interact with your screens (i.e. screen recordings).
In the next section, we’ll show you how to access these insights with Smartlook to analyze and improve your player’s experience, as well as debug your game faster.
See why players do what they do and debug your game faster with session recordings
As we said earlier, merely knowing what’s happening in your game isn’t enough to improve players’ experience. In other words, metrics alone won’t give you the “why” behind users’ behavior.
This is where session recordings come in.
Session recordings (sometimes called session replays) show you users’ experience in your game through their entire session. As a result, you can see where they struggled or what happened when they experienced a bug or game crash. You don’t have to guess about what went wrong — you can see it.
With Smartlook, every user session in your game is recorded automatically. Once the SDK is set up, our tool starts recording all user sessions, which then appear in the “Recordings” tab, where you can watch them.
Session recordings were a game-changer for award-winning game studio Madfinger Games. Before trying Smartlook, one of their biggest problems was having to decipher gaming insights by guessing what went wrong or why users behaved as they did.
As their CTO, Miroslav Ondrus, says:
“Sometimes the team could only guess why something was happening. They would brainstorm possible reasons and perhaps use the customer care team to get in touch with users who behaved in unexpected ways. But not every player would be willing to talk about it…When we can’t see the problem right away, we have to spend a lot more time on it.”
Session recordings solve this exact issue because they let you see exactly what took place, instead of just showing you a log of user actions, like user logged in, user started Level 2, user logged out. If you want to know why that user didn’t continue on to Level 3, a session replay will give you a much better idea than just reading through what the user did.
On that note, here’s how you can use session recordings to debug faster and analyze different user segments.
#1 Find and debug issues fast
Debugging mobile games is hard and time-consuming since there’s no guarantee you can reproduce the exact environment in which a bug occurred.
With session recordings, you can quickly see how the bug occurred from a users’ point of view. Additionally, if you set up Smartlook’s API, you can identify users, so their recordings contain additional information like username and email (alongside info like game version, OS, and device) as you can see in the lower-left corner.
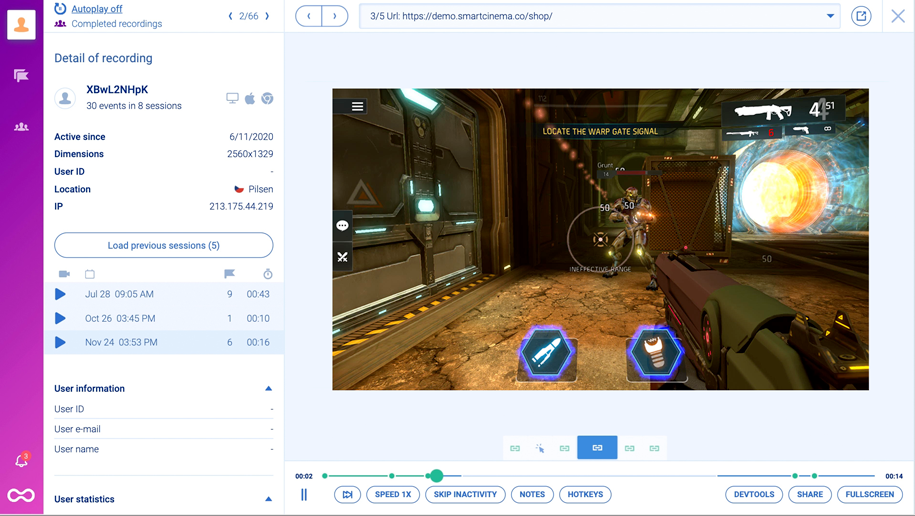
That way, if you’re watching a session replay, and you see a user encountering a bug, you can reach out to them while your team is working on a fix.
And, if users report a bug to your support team, you can watch their recordings, so you don’t have to rely solely on their explanations (if they even provide any).
In both cases, the time between finding a bug and fixing it is massively reduced. Plus, the whole process is much easier for your QA and development teams. This is the exact strategy Vertigo Games uses to detect and quickly reproduce issues step-by-step.
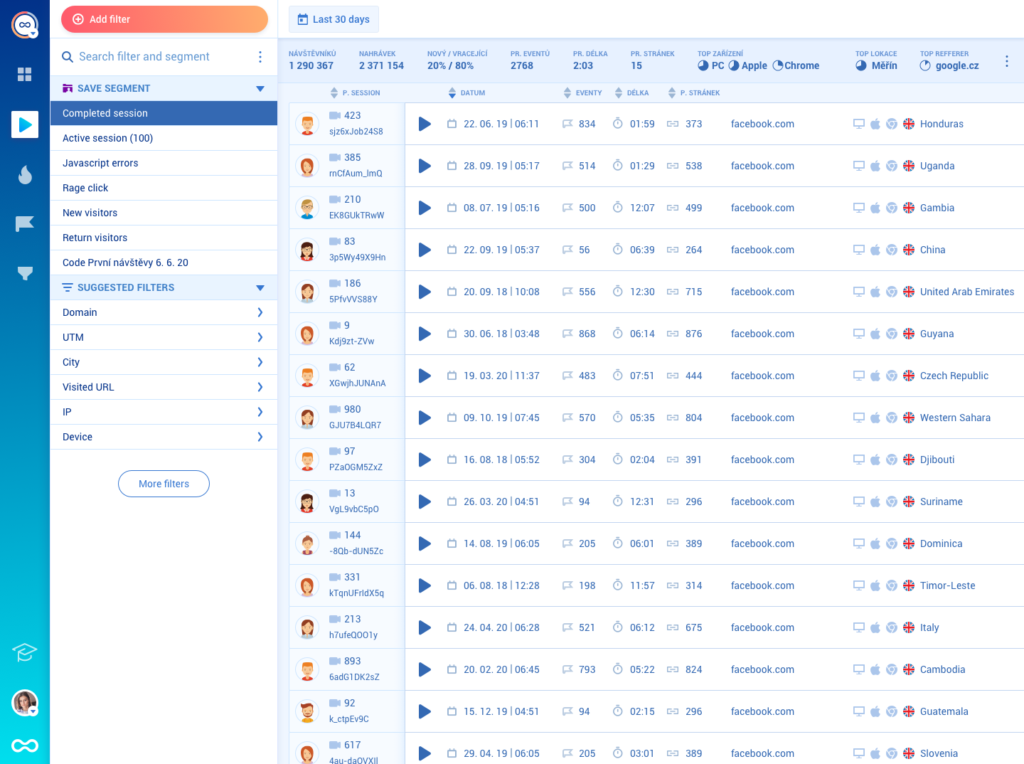
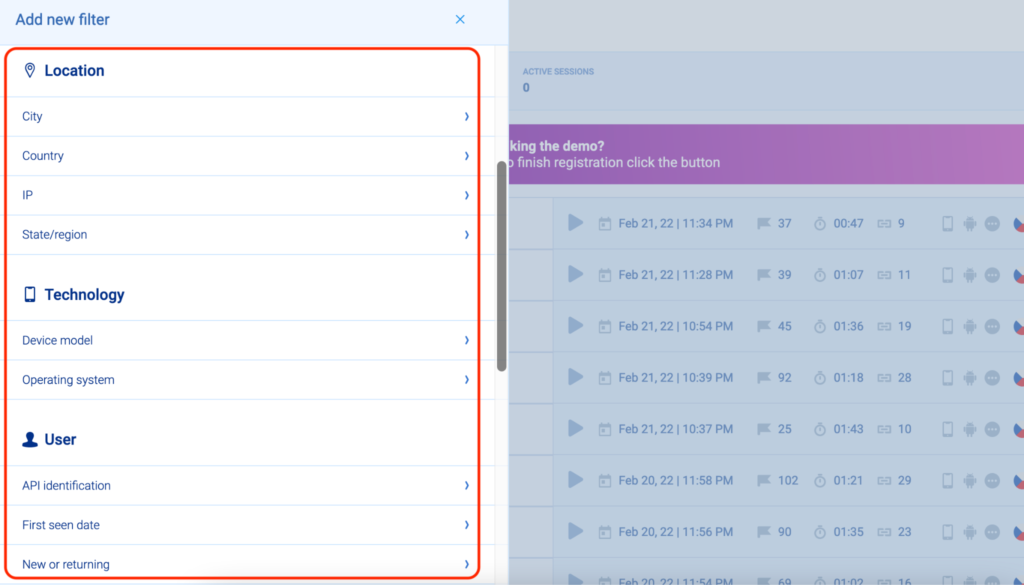
#2 Filter session recordings to analyze different user segments
You can watch each recording when you wish and filter them based on 30+ filters like session duration, country, device, new or returning visitor, and more, to quickly find what you’re looking for.
For example, you can watch session recordings of users on older devices to see how your game performs on them. You can save such user segments (e.g., users with an Android device, new users, or users from a specific country) and track them over time.
Going back to Vertigo Games, their product team consistently watches sessions of new players. Filtering recordings of new users allows the product team to check if players complete the onboarding and whether they get a great first impression of the game.
In short, session recordings are a powerful tool for analyzing your users’ behavior. However, Smartlook also lets you combine session recordings with traditional app analytics tools — events and funnels — for even more powerful insights.
Define events to track user interactions (like in-game purchases) and filter session recordings
In analytics, an “event” is any type of user interaction that can be tracked.
Smartlook automatically captures user interaction events like finger touches, gestures, and focus on UI elements. However, you can also create custom events via JavaScript to track all other user interactions.
We already talked about in-game purchases or account logins, but other important events might be level completions, character selections, or anything else that helps you verify if your game mechanics are working as intended.
Here’s how Smartlook’s “Events” tab looks:
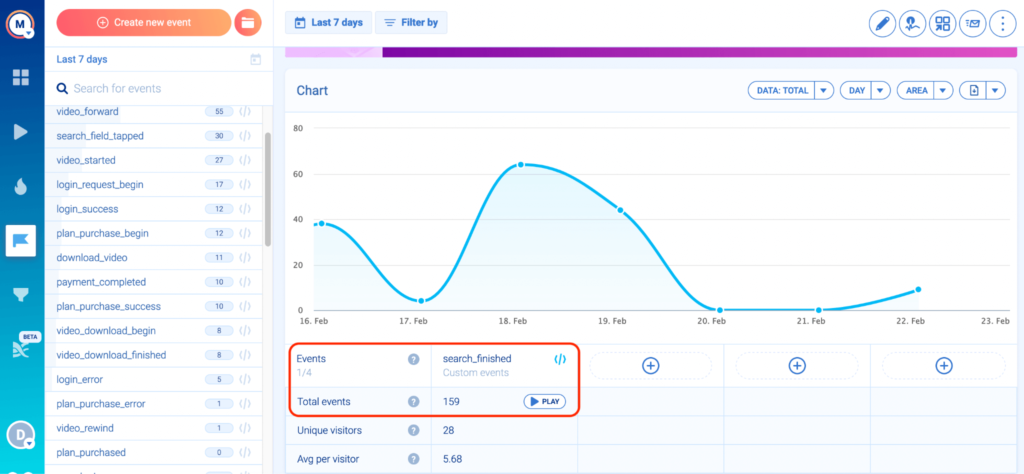
As you can see, there’s a “Play” button next to the total number of events. This button takes you directly to all session recordings where this event took place. As a result, you can find valuable insights much faster, since you don’t have to go through hours of session recordings to find what you’re looking for.
Combining events with session recordings also lets you go beyond the raw data and find why users do what they do. Here are three examples of how you can use this capability:
- Compare the journey of users who made an in-game purchase and those who didn’t, so you can see how their experiences were different.
- Watch only users who completed a certain level in your game. This is a great way to validate assumptions about your gameplay, especially after releasing a new level or redesigning an old one.
- Watch only users who picked a specific character. Maybe you recently introduced a new character, but players aren’t picking it as often as you’d expect. Or one character is much more popular than the others. There are dozens of potential explanations for these types of anomalies. Maybe the favorite character is overpowered. Maybe the UI is designed in a way that players don’t even realize there’s another choice. Maybe there’s a bug that reverts to the favorite character, even after they made a different choice. In any case, watching user sessions will help you understand what’s actually happening, instead of leaving you to make a guess.
Build funnels to analyze the user journey through your game and calculate conversion rates
Funnels let you analyze the user journey through your game and calculate conversion rates. In Smartlook, you can create funnels by putting two or more events in the order you believe your users follow, like in the GIF below.
With funnels, you can calculate conversion rates for your entire game, i.e., how many of the users who tried your game made an in-game purchase. With Smartlook, you can create a funnel with as few as two custom events. For example:
- Event 1: User logs into your game.
- Event 2: User completes an in-game purchase.
If this funnel’s conversion rate goes up, then you’re probably doing something right, since a higher percentage of all the players who try your game are buying something.
However, it’s also a good idea to create much more granular funnels and dig into the conversion rates between different events, since players go through a number of steps before purchasing. Each one can push them further towards a conversion, or result in them dropping off.
That’s why Smartlook also lets you track conversions between various steps inside a funnel. Going back to Vertigo Games, some of their funnels consisted of 30 or 60 steps, allowing them to analyze the user journey in detail and see where most funnel drop-offs occur.
You can also create a funnel to track your game’s tutorial. By mapping each step of your tutorial to a custom event in Smartlook, you can quickly calculate conversion rates for the entire funnel or between some specific tutorial steps and find where most users quit. Again, looking at each step of the funnel, as opposed to its overall conversion rate, will help you pinpoint the places where users are getting confused or losing interest in the tutorial.
You can see how easy it is to analyze events and build funnels with Smartlook’s live public demo (no registration or credit card required).
Combine session recordings with funnels to find why users drop off and improve conversion rates
In Smartlook, you can combine funnel analysis with session recordings to analyze the behavior of users who dropped off.
Let’s go back to our game tutorial example. Below, you can see a screenshot of a funnel that tracks tutorial completions, with an overall conversion rate of 71.43%.
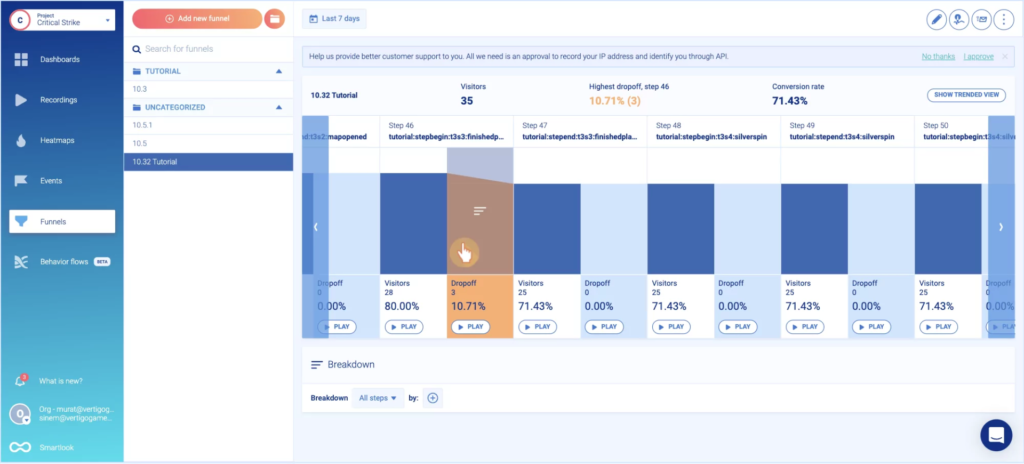
As you can see, there’s a “Play” button under each drop-off step of the funnel.
When you click the button, you go directly to the session recordings of all users who dropped off at that stage. This saves you both time and effort, as you watch only users who didn’t complete that step in the funnel, instead of going through all other recordings.
In the case of this tutorial, you can easily see where the largest drop-off is (step 46, as shown in the screenshot above) and jump straight into the relevant user recordings. Again, this is how you uncover the “why” behind your users’ behavior, which then lets you improve their experience.
Analyze the player experience in-depth and debug your mobile game faster with Smartlook
You can try Smartlook on your mobile game today by creating a free account (no credit card required). Once you set up our SDK, Smartlook will automatically start recording every user session in your mobile game. You can use mobile gaming reports, along with session recordings, events, funnels, and heatmaps, to learn what your users do and why they do it, so you can improve their experience.
You can also request a free 1-on-1 demo that will be tailored to your business’s needs to understand how you can get the most out of Smartlook.