


Page analytics generate heatmaps in just a few seconds so you can see how every one of your CTAs performs, giving you a deeper understanding of the issues and problems your users may be experiencing.

Say you are reviewing a session recording of a client and notice that the bottom of your page is not loading properly. In this case, click on the page analytics and check if you can see clicks on the bottom page. No clicks? That’s a sign that the problem may be with your webpage and you need to further analyze the situation with developers.
Let’s examine how this tool will help you with product analysis:
Quick solution for evaluating product changes
Page analytics are more than suitable for evaluating product changes. Define the period you’re interested in, and heatmaps will be generated strictly from the data collected during this time.
Changed your UI recently? Select a time range that covers the before and after and immediately compare heatmaps.

Different heatmaps for different pages
Adjust the clustering level of a heatmap by clicking on the top right button.
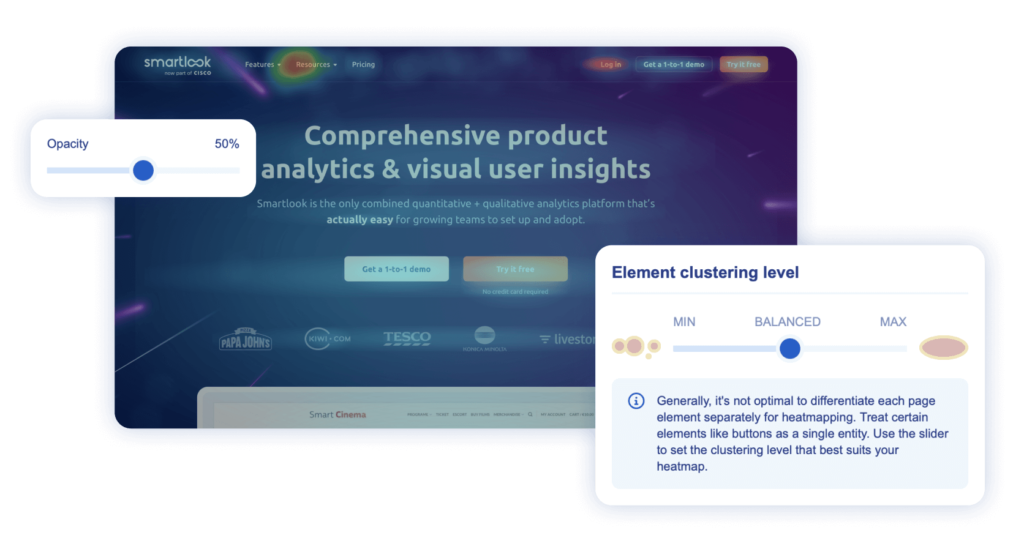
By sliding to MIN, your heatmaps will show points where users clicked directly, including how many times. These heatmaps are an ideal solution for static pages where elements remain in the same place.

On the other side, when sliding to MAX, your heatmaps will show you an approximation of all clicks on each element. This comes in handy for dynamic pages or elements that may appear in slightly different positions. A typical example is a floating window or a play button on a video.

Choose a BALANCED clustering level if your page combines static and dynamic elements.
Distinctive visually, exact in numbers
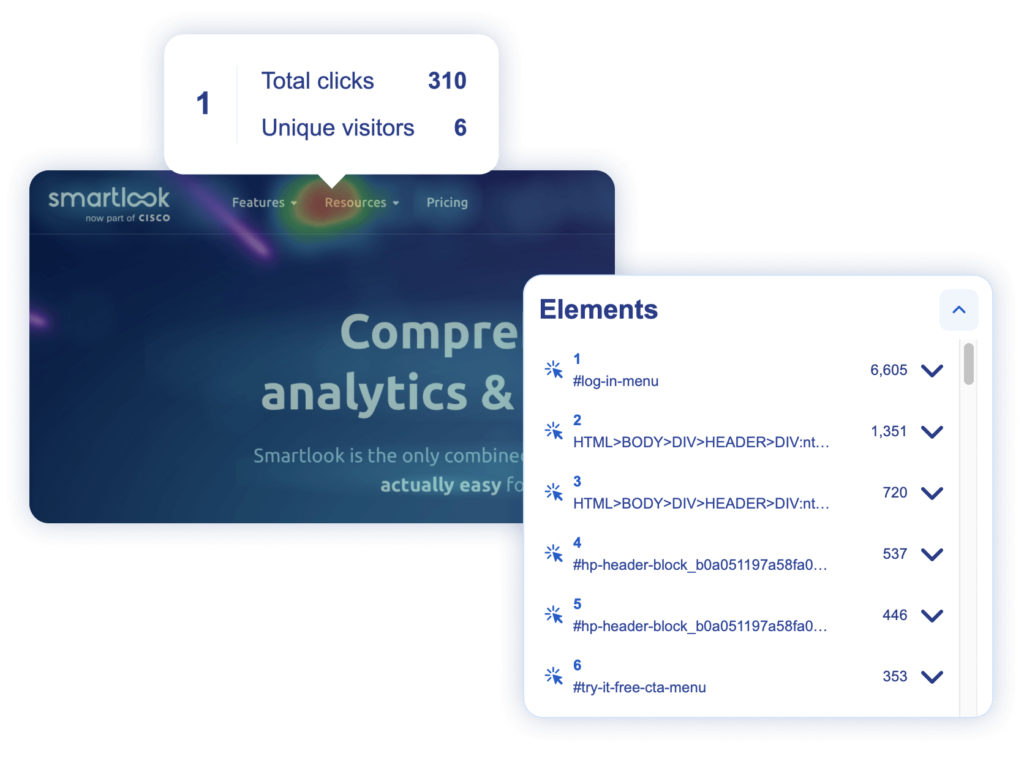
At first glance, the colors show you which element is most clicked on. If you’re looking for the exact number of clicks, move your mouse to the specific element, and the number will appear automatically.
Easy to navigate
Locate the most clicked on element immediately using the Elements section on the right side of the recording. Click on the element and use it as a filter to find other recordings with the same element or use it to create a new event.

Page analytics is suitable for anyone working on product performance and analysis. It helps product managers determine weak points, and allows UX designers to access heatmaps of any pages in record time.
Like our page analytics, or see room for improvement? Keep in mind, this is the beta version – we’re still working on it. Leave us feedback so we can improve and make it everything you wished for.


