Marketers and product managers use funnel analysis to create a visual map of the flow of users along a particular customer journey through a website or mobile app and measure how many visitors drop off between each step.
Typically, marketers are most interested in finding out the percentage of visitors who continue on to the next step. They use this funnel report to calculate the conversion rate from one step to another and across the entire funnel. The hope is that by knowing this, you can focus on the steps of the conversion funnel with the largest drop offs and try to optimize the user experience to prevent those drop offs.
But this kind of simple funnel visualization, which many website analytics products offer, has two important limitations:
- The raw metrics don’t tell you how to increase conversion rates. You can guess why people aren’t converting, and based on those hypotheses, make changes and run A/B tests to see if the rate improves. But if you guess wrong, it can take a long time to figure out what’s really going on.
- It takes a long time to collect enough data to draw statistically relevant conclusions. After you define the events and add them to the funnel, you have to wait for visitors to roll in. Whether it takes a week, two weeks, or a month — if sales are plunging, any delay in accessing those insights can be costly.
Our tool, Smartlook, was designed to address these limitations by pairing funnel analysis with screen recordings to help you analyze the behavior of visitors who dropped at each stage.
Specifically, Smartlook lets you:
- Zoom in on each segment of users who dropped off at each step and watch replays of their sessions to find patterns that may tell you what separates those who converted from those who didn’t.
- Define funnels retroactively so you can get historical data the moment you set up a funnel and instantly begin analysis without waiting for data collection.
In this guide, we’ll show you how to set up funnel tracking, combine funnel analytics with screen recordings to optimize conversion rates, improve your user experience, and boost customer retention. We’ll demonstrate how to do this with our tool, Smartlook, and we’ll discuss how it compares to other top funnel analysis tools to help you make the smartest purchase decision.
Understanding types of funnels
You can build a funnel for any stage in the customer journey. As a result, a strict funnel classification doesn’t exist.
From the point of UX, we can distinguish between the following types of funnels:
Marketing funnels
Marketing funnels guide users through the stages of awareness, including interest, and consideration before they become customers.
Here’s how they typically look:
- Awareness: users become aware of a product or service through marketing channels like advertisements, social media, or content marketing
. - Interest: users express interest and seek more information
. - Consideration: users evaluate the product and compare it with alternatives
. - Conversion: users take a desired action, such as making a purchase or signing up.
Each stage of the funnel employs different marketing tactics allowing you to monitor how users interact and move from one stage to another. For examples, users that click on an ad move right to the awareness stage. Once the same users have been spotted interacting with your blog content, they indicate interest in your company. Booking a demo usually aligns with the consideration stage. And the bottom of the funnel (a.k.a. conversion) is either a free trial sign-up or paid subscription (depending on what you define as a conversion).
Of course, no real funnel is that straightforward. But hopefully, you get the idea.
Checkout funnels
This type of a funnel aims to monitor the effectiveness of your current checkout flow. It represents a series of steps a user should take to complete a purchase:
- Cart addition: users express interest in specific products and move them to their cart
. - Initiating checkout: users transition from browsing to the formal checkout process
. - Sign-in/registration: users sign into an existing account or create a new account
. - Billing information: users enter or confirm billing details, including payment information and shipping address
- Order confirmation: users complete the order and make a payment
.
Checkout funnel monitoring gives you insight into the weak points of your flow, namely the steps where users drop-off most often. To better understand what prevents users from completing particular steps, you’ll need qualitative data in the form of session recordings (more on that later).
Feature adoption funnels
Product teams designs adoption funnels to monitor how users interact with product functionalities to ensure smooth navigation. With feature adoption funnels, product or feature usage can be represented through the following stages:
- Exposed: users learn about features through onboarding resources or announcements (if it’s a new feature)
. - Activated: users take the necessary steps to enable or access new features. This may involve setting preferences, turning on features, or completing required onboarding steps. Some features don’t require activation — in this case, you can skip this stage
- Used: users go beyond activation and use the feature as intended
. - Used again: users consistently integrate the feature into their workflows
.
The feature adoption funnel perfectly illustrates that interacting with a specific feature once doesn’t count as proper adoption. Only by monitoring repeat interactions can you find out whether users realize the value of your product functionality or not.
Retention funnel
Like adoption funnels, retention funnels help you analyze and optimize user engagement over time. You can create retention funnels for ecommerce brands, service subscriptions, or mobile apps.
Retention funnels typically include the following steps:
- Purchase: users enter the funnel as soon as they make a purchase
- Adoption (a.k.a. the “aha!” moment): customers realize the value of the offering. While there’s no such thing as adoption or the “aha!” moment in ecommerce, positive customer feedback may indicate customers have moved beyond the transactional phase and are experiencing the desired value from their purchase
- Retention: customers stay engaged over an extended period. They renew subscriptions or make repeat purchases with your brand
- Advocacy: satisfied customers become promoters, actively recommending the product or service to others
Whatever type of funnel analysis you want to start with, Smartlook can help. Connect it to your website or product to build and monitor user paths, from the conversion stage to becoming brand advocates. Later, we’ll teach you how to set up your first funnels in Smartlook.
Funnel analysis in product management
While funnel analysis typically comes down to conversion optimization, regarding ecommerce, product teams still use it to create a better UX in the first place.
Funnel analysis is helpful through each step of product experience (PX) optimization:
- Usability testing. Funnels perfectly illustrate how users navigate your product. You can identify specific steps where users face difficulties and drop off
. - User activation. Funnels uncover the user journey from initial engagement to reaching the “aha!” moment. Based on the data, you can make informed decisions regarding optimizing the activation process
- User onboarding. You can use funnels to visualize the entire onboarding flow and spot drop-off points and areas where users abandon the process
- Feature adoption and engagement. By using funnels to monitor product and feature adoption, you can identify areas that users don’t fully understand and take measures to help them make the most of your product
- Upselling. You can discover how many users upgrade to a more expensive plan, and how the actual progression toward upselling looks. And if you apply filters, you’ll get a chance to see which audience segments are most likely to upgrade so you can optimize your strategy accordingly
- New feature launch. Funnels let you monitor how users discover and engage with new features, identifying any hurdles or areas for improvement
- Churn analysis. You can turn to funnel analysis to spot stages where users commonly drop off before disengaging entirely. To better understand the reasons behind churn, product teams usually set up churn surveys that fire once a user takes a step toward canceling their subscription
From validating product design to analyzing the reasons behind user attrition, funnel analysis is always the starting point in product analytics for PMs.
How to do funnel analysis with Smartlook
Smartlook’s funnel analysis feature combines quantitative analysis with qualitative analysis. You can see what percentage of visitors reached a particular step in a funnel, and by watching the recordings of visitors who dropped off, you can understand their behavior and get specific ideas about how to improve the conversion rate or the user experience.
And you can do it retroactively — as soon as you define the funnel, it will populate with data from as far back as your data retention plan goes. There’s no need to wait for a month to get enough results to draw conclusions, like you would with any other funnel analysis tool.
How to set up funnel analysis: Step-by-step guide
It only takes a few minutes to set up a funnel in Smartlook. As long as you’ve had an account for at least a month, you can calculate the conversion rate of a particular funnel as soon as you define it, and begin watching relevant recordings to understand user behavior immediately.
Step 0: Install the snippet
As with other screen recording tools, before you can get any insights, you need to install the Smartlook snippet on your website. With all of our plans (including the free version), you get always-on recordings that start the minute you add the snippet — unlike many of our competitors, who only record sessions for a sample of your traffic.
Step 1: Create events
There are four ways to define events in Smartlook. The first three require no programming skills to set up, meaning you won’t need to bother a developer whenever you want to add new events to your account.
- 1. Choose from a list of standard events, including:
- Clicked on url
- Clicked on text
- Typed text
- Clicked on a CSS selector (allowing you to select any element in the page)
2. Use the no-code event picker. Click on the button that says “Pick event on page” (see screenshot below) and you’ll be taken to your web page, where you can define an event by clicking on elements in the user interface of your website or web app.
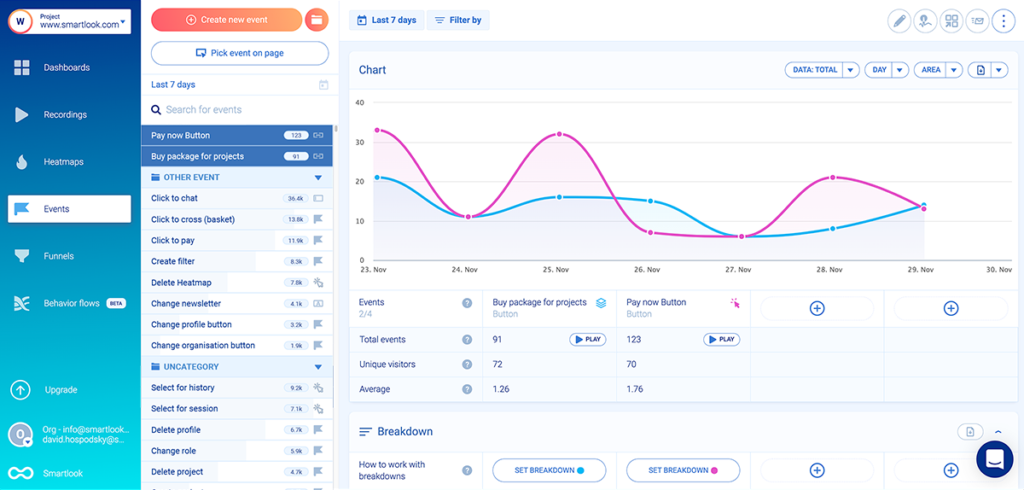
3. Define an event from a recording. Recordings capture every action the customer does (clicking on a url, clicking on text, typing text, etc.). While you’re watching a recording, if you see a user perform an action that you think would be useful to add to a funnel, you can pause the recording and make that action into an event without leaving the recording.
4. You can also create custom events tied to any element that can be located and defined uniquely in the DOM (but a programmer will be required). For mobile apps, all but a few of the most basic events must be defined with custom events.
Events can also be paired with custom properties (e.g. only people who were signed in or who are paid users when they clicked on this button), which allows you to further narrow down the audience in the funnel to only the most relevant visitors.
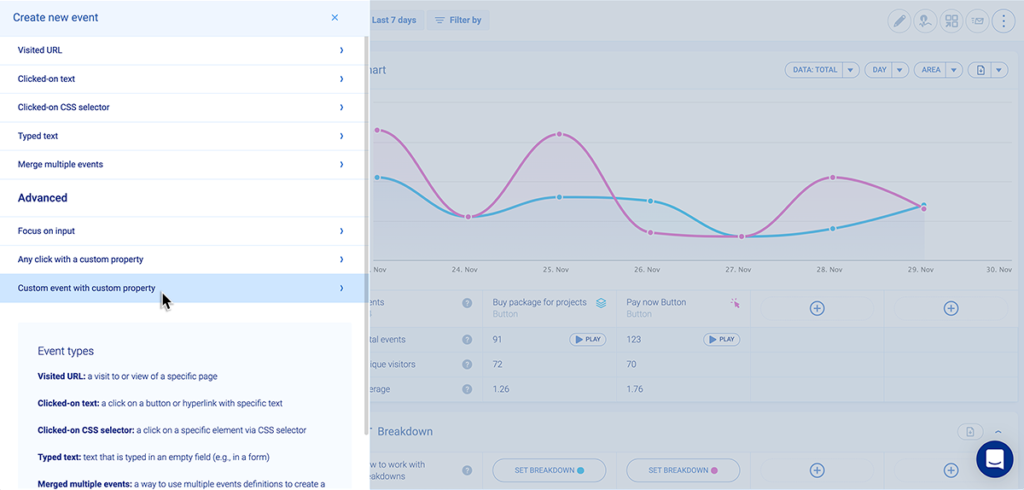
(This screenshot shows you how to create an event with a custom property, as well as the list of standard events you can choose from.)
Step 2: Add events to a funnel and segment your traffic
Once the funnel is defined, you can view a lot of additional data in addition to the conversion rate for each drop-off point.
You can segment the traffic by location (city, state, or country) as well as by device or operating system.
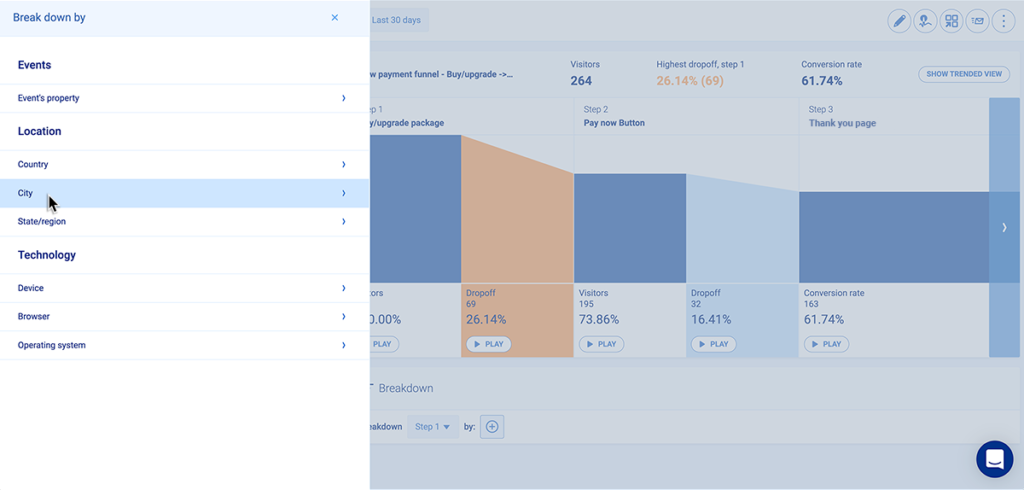
You can watch screen recordings of only the segment that interests you.
For example: Users in Mexico who dropped between the “Pay Now” button and the Confirmation page (see screenshot below). This filtering option could save you from wasting hours of time watching irrelevant recordings to find one where a user dropped.
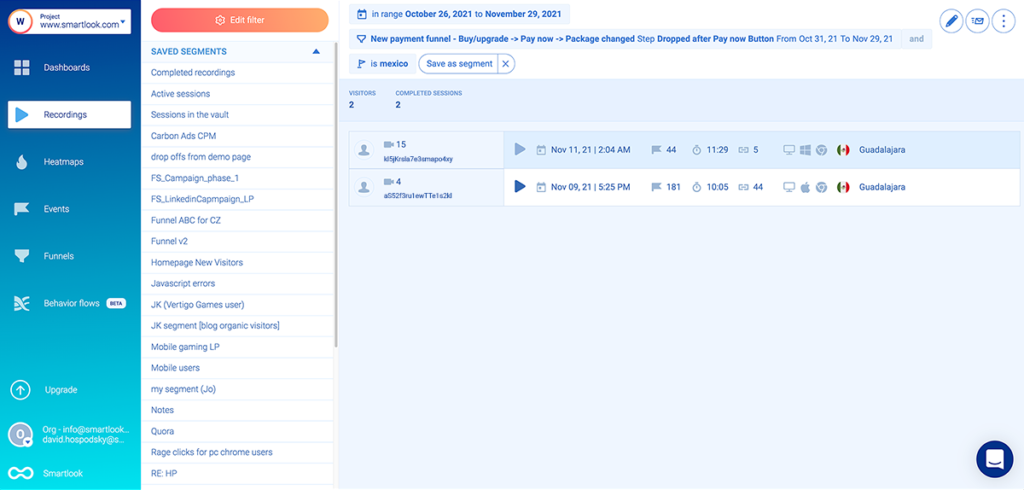
Additionally, with Smartlook’s API, you can identify users and look up customer’s replays by their name or email. If you observe a customer experiencing a technical error while checking out or using your product, your team could reach out to them directly to provide support while your developers look into the issue.
Step 3 (Optional): Set up alerts for anomalies
An optional final step when setting up a funnel in Smartlook is to add an alert to notify you when the conversion rate for a particular step in a funnel changes. The alert can be triggered by the conversion rate dropping outside of a defined range (e.g. below 2 percent or above 4 percent), or it can be triggered by a percentage change from your baseline (e.g. 50% higher than normal or 50% lower than normal). The first option is too sensitive for most users, while the second option allows more room for the normal variation your site likely sees in conversion rates from day to day.
These alerts can help you quickly respond to urgent problems or opportunities on your website.
Next steps: deeper analysis and funnel optimization
The ultimate objective of funnel analysis and optimization is increasing the percentage of people that make it through all of the stages in a given funnel. But while quantitative data derived from funnels points out the weak points in the product experience, it’s not enough to make informed decisions regarding funnel optimization.
Luckily, Smartlook not only excels in quantitative data analysis, but it also captures qualitative data to help you get a complete picture of your UX. Here’s how you can optimize your funnels by combining quantitative and qualitative data with Smartlook. Pair funnel analysis with qualitative data
Funnel analysis is a powerful quantitative data analysis method to start with. However, when paired with screen recordings, it has to offer many more powerful use cases:
However, when paired with screen recordings, it has many other powerful use cases:
Funnel optimization example #1: Find technical errors in your checkout funnel
You want to optimize your conversion funnel. Where do you start?
We recommend that you look into your checkout funnel first.
By creating separate events for clicking on “Pay Now” and your confirmation page, you can see the number of users who tried to pay but were unable to do so.
In most funnel analysis tools, that is all the information you get (e.g. 60% of visitors who clicked “Pay Now” completed their transaction). You’re on your own to figure out why the remaining 40% didn’t check out. But with Smartlook, you can watch the exact recordings of visitors who weren’t able to pay and find out what (if any) error message they received — information that could help your developers quickly fix the problem.
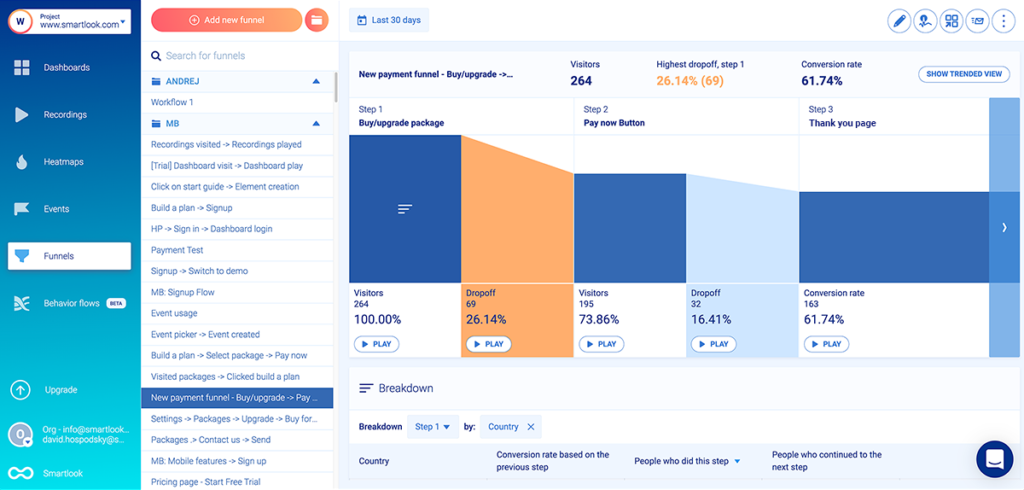
For example, the screenshot above from Smartlook shows a checkout funnel for an ecommerce site which has a 16.4% drop-off rate between users who clicked the “Pay Now” button and users who reached the confirmation page. While this is useful, without more information, we don’t know why they didn’t successfully complete their purchase. It’s likely that the 32 potential customers who dropped out at this stage in the conversion path wanted to buy, but were prevented from doing so by a technical error.
By watching the recordings, you can see any error messages the user saw — like the credit card error in the below example — and pass those along to your developers to investigate further.
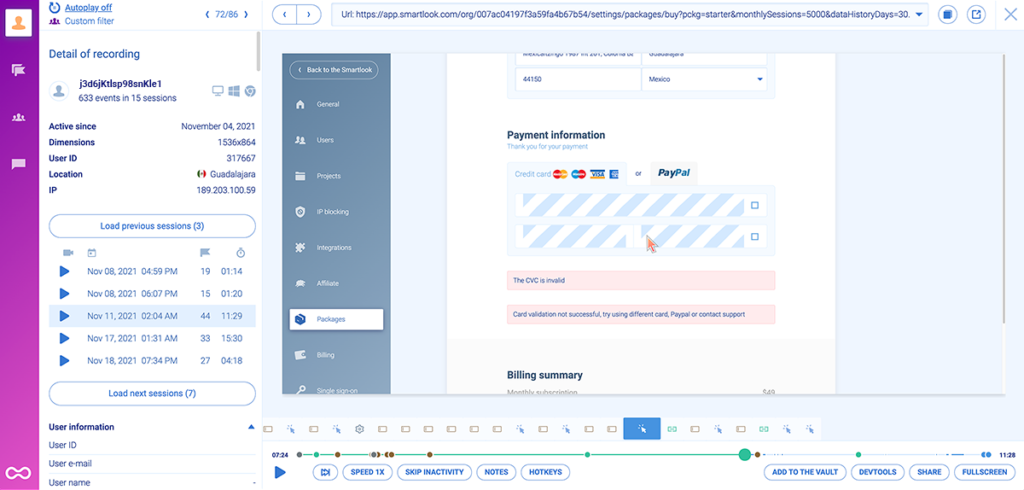
Technical errors like these are extremely low-hanging fruit for improving your conversion rate.
With standard funnel analysis, you simply have the conversion rate numbers and nothing else. But with Smartlook, there is a “Play” button underneath each step of the funnel that will take you directly to the screen recordings of all the visitors who dropped off at that stage.
You can watch their entire session to see where they clicked before they got to that stage, but the video will automatically jump to a few seconds before the visitor dropped, saving you and your team a lot of time hunting through session recordings.
Funnel optimization example #2: Improve your onboarding process
Most mobile apps and SaaS products include a product tutorial for new users, but many users don’t complete the tutorial during their free trial, which can make converting users from free to paid difficult.
By mapping the entire tutorial to events in Smartlook, you can see trends and watch replays of users who quit the tutorial early and gain insight about why.
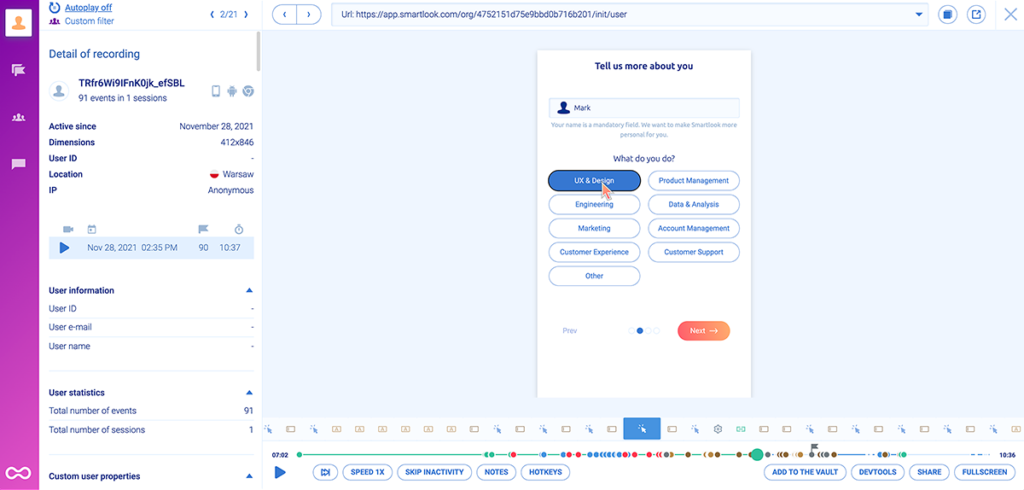
The image above shows a moment during a Smartlook screen recording of a mobile user navigating an onboarding sequence. During the roughly 10-minute session, the user completed 91 events.
And while some users are patient enough to go through such a thorough onboarding process, many will drop off after a few minutes.
In this case, you can optimize your onboarding funnel by reducing the number of steps in the sequence and creating on-demand tooltips instead of a tiresome product walkthrough.
Funnel optimization example #3: Discover “aha!” moments” that lead to higher retention rates
Your most satisfied customers are often your power users, the ones who have explored your product enough to discover the most advanced features. By mapping the typical user journey of power users to a funnel, you can watch session recordings of those users and compare them to users who churn before reaching an aha moment. These recordings could help you discover areas for product improvements.
Funnel optimization example #4: Increase feature adoption
We’ve already explained how adoption funnels help to monitor how users engage with your product functionalities. Now, let’s figure out how you can use the data to boost adoption.
Here’s a real-life example of the adoption funnel optimization by the Smartlook customer. CricHeroes, the world’s largest cricket network, noticed that something was preventing their users from successfully completing the flow of challenging other teams to matches. After analyzing session recordings, they realized it was the requirement to share their contact information with opposing teams that prevented users from completing the task.
It’s worth emphasizing that without the integration of funnel analysis with session recordings, it’s extremely time consuming or downright impossible to achieve the benefits described in these examples. You’d have to spend hours watching recording after recording and manually tag or label each session by how far in the funnel the user got. Smartlook’s pairing of session recordings with funnel events makes this a breeze.
How Smartlook compares to other top funnel analytics tools
By now you should have a good idea of the benefits of a funnel analysis tool that also provides filterable screen recordings.
If you’re shopping for a funnel analysis tool or looking to change to a new provider, it can be hard to spot the differences between each solution.
To help you make an informed choice, here’s a breakdown of how we compare to four other tools. We’ll compare on four factors:
- Does it support mobile, web, or both?
- How do you create events? (Does it have a no-code event picker? Or do you need a programmer to create every custom event?)
- Can you analyze data retroactively? (Define an event now, and instantly see how it applies to past recordings.)
- Price
Smartlook: Combine session recordings with event-based analytics for powerful insights
Smartlook is an analytics solution for both websites and iOS/Android apps. Understand precisely how customers interact with your website and app from the user’s perspective: watch recordings, use automatic tracked events and heatmaps, and build conversion funnels.
Smartlook cuts out all the guesswork and enables brands to see — and share — their data more clearly, all in one central place. This means clear decision-making for product managers, marketers, UX designers, and developers.
- Web or mobile app: Both
- Event creation: Three options –
- No-code event picker (web only)
- Define an event from a recording (web only)
- Custom events (web and mobile)
- Retroactive analysis: With always-on recordings, you can create events and they’re immediately applied to all recordings in your data retention plan.
- Pricing: Smartlook’s pricing tiers are divided by the number of sessions you can record each month. To understand your visitor behavior and make sure you’re seeing everything, you need a plan that covers slightly more than your average monthly website traffic. The free forever plan is suitable for personal use for small websites that get less than 3,000 visitors per month. You can define 10 events, so you can create 2 basic funnels, but to see the real power of Smartlook, you’ll want to start with at least the Pro Plan, which starts with 5,000 users a month and 20 events for $55/month. Try any plan risk-free for 30 days — without a credit card.
UXCam: Screen recordings and behavioral analytics for mobile apps
UXCam is a comprehensive user experience analytics platform for mobile apps that offers session replays, heatmaps, and event analytics.
- Web or mobile app: Mobile only
- Event creation: Custom events only
- Retroactive analysis: None
- Pricing: UXCam offers three tiers: free, Premium, and Enterprise. There’s no pricing info on its website. The free plan offers up to 5,000 session recordings per month, and all tiers can be tried for free for 14 days without a credit card.
FullStory: Enterprise-grade digital experience platform with focus on user segmentation
FullStory caters to large enterprises and offers a comprehensive suite of website analytics tools, including filterable screen recordings.
- Web or mobile app: Both
- Event creation: Two options –
- Custom events
- Define events while watching screen replays
- Retroactive analysis: After you define an event, you can use it to search through historical user data.
- Pricing: FullStory offers a Free Forever plan that allows for basic funnel analysis and includes three user seats, 1,000 sessions/month, and up to one month of data storage. The Business plan provides everything businesses need to understand and improve digital customer experiences, but you have to get a demo to get any info about pricing. Reviews suggest there is room to negotiate with sales reps on pricing (and many customers say they are grandfathered in at early pricing rates that are far lower than the current rates), but the average price mentioned on review sites is about $700/month.
Google Analytics: Free funnel analysis tool ideal for analyzing marketing campaigns
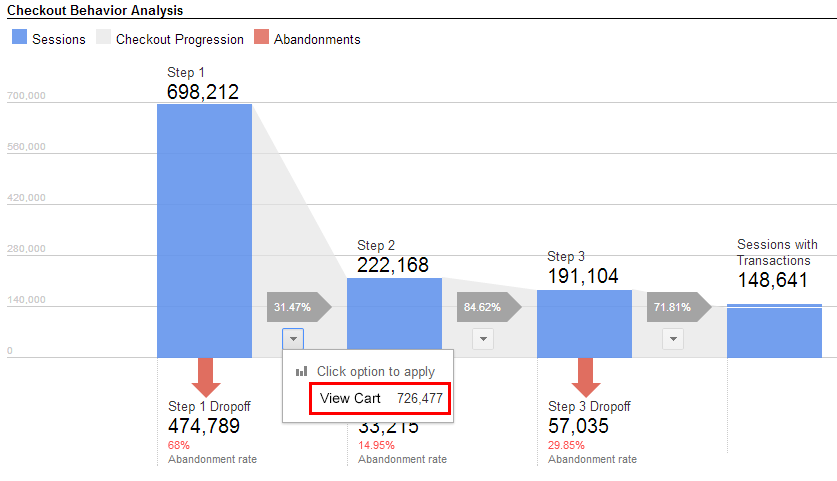
Google Analytics (GA) isn’t a screen recording tool, but as the household name in website analytics, we thought it would be helpful to share how it stacks up. GA is great for analyzing the performance of a marketing funnel and figuring out what steps led someone to your site, but once a visitor lands on your site, GA is limited in how much behavioral data it can provide because it doesn’t do heatmaps or screen recordings.
- Web or mobile app: Both
- Event creation: Custom events only
- Retroactive analysis: None
- Pricing: Free
Hotjar: Heatmapping tool with limited filters
Hotjar is a UX optimization tool that retired its funnel analysis tool in December 2020 in order to focus on heatmaps. They now recommend using Google Analytics to set up funnels, and offer a few filtering options for their heatmaps and screen recordings. When paired with insights from Google Analytics, you can look at screen recordings or heatmaps for the funnel steps with the highest dropoff rate, but you won’t be taken directly to the recordings of the visitors who dropped.
Funnel analysis and optimization FAQs
What is funnel optimization?
Funnel optimization is the process of making changes to your website or product to increase the number of people who complete a desired action. The target action, as well as the nature of changes, depends on the type of funnel you’re working on (e.g., sales funnel, marketing funnel, retention funnel, etc.).
How to optimize user funnels?
You need to start with funnel analysis. First, set up a funnel with the help of your product analytics tool (you can use Smartlook). For this, you’ll need to install a snippet of tracking code on your site or app, set up events (a.k.a. user actions) that will represent steps within your funnel, and add them to the funnel. From now on, the funnel will accumulate data on how many users proceed from one step to another. Once you have enough data, you can make conclusions on the effectiveness of the funnel and see where the majority of your users drop off.
From here, you can dive deeper into qualitative data (session recordings) to spot what caused visitors to abandon the flow. Armed with this information, you can take steps toward addressing friction points and optimizing your funnel.
What is funnel analysis in product management?
In product management, funnel analysis is the process of examining and optimizing the various stages that users go through when interacting with a product. Its primary objective is identifying opportunities to increase the number of people that make it to the final step of the funnel by optimizing the product experience.
Start building your funnel today
Smartlook’s behavioral analytics tools pair quantitative analysis with qualitative analysis to give you actionable insights into the user experience of your product.
Schedule a demo or start your no-risk 30-day free trial today.