In fact, customer acquisition is 7–13% more expensive than customer retention, according to Freshworks.
So, how can you make sure you do your best to retain customers? Well, you start with measuring how you’re doing. Most commonly, companies measure and track their customer churn, although some companies prefer to track their retention rate.
Retention and churn are really two sides of the same coin. While customer retention rate refers to the proportion of customers you have retained, customer churn stands for the percentage of customers who have stopped using your product or service during a specific time period.
Let’s take a closer look.
What is customer churn, and how is it tied to revenue?
So, your customer churn rate is defined by the number of customers lost during a period (month, quarter, or year) compared to the number of customers you had at the beginning of that period.
Alright, but how is the churn rate connected to revenue? Let’s look at a quick calculation that shows the power of churn.
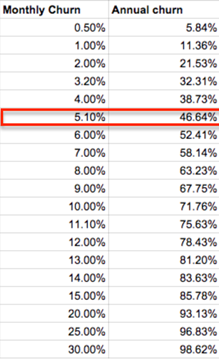
If you lose 5% of your customers each month, it would mean you have a 50% annual churn rate. And in terms of revenue, you are looking at a 25–30% divergence in revenue.
So, if your customer churn is through the roof, no amount of marketing spend or top-notch salespeople will save you. Which takes us to the million-dollar question…
What is a healthy churn rate?
According to Profitwell, average customer retention rates vary by quite a bit across industries. For example, retail only has a 63% retention rate, making their churn rate a whopping 37% on average.
Tech and professional services fare better, though. The average churn rate in telecom businesses is 22%, compared to 19% in IT, and 16% in professional services.
Whatever the churn rate is for your company today, you can take action to reduce it.
Reducing customer churn and improving retention
A quick Google search will give you plenty of tactics for reducing customer churn. But these tactics will not be very helpful unless you understand the “why” of your customer churn.
In truth, the only recipe for successfully reducing churn is this:
Identify the main reasons customers churn and address these reasons in your customers’ journey.
Easier said than done, right? But don’t fret, dealing with customer churn is not rocket science, and you’re not the first one to tackle issues with churn. Matt Lerner (ex-PayPal) recently shared how they focused their thinking to “crack” a $100M churn problem.
Here are his main takeaways, with explanatory comments that are not his:
- Focus on behavioral churn, cancellation is too late
If at all possible, track early indicators of churn, such as a decline in activity or the customers not using your tool/service (while still paying you). You have much higher chances of re-engaging them and building a long-term relationship with them while they’re still your customers, and not
when they’ve already canceled. - Separate activation from retention – use different fixes
Sign-ups who have a bad experience during activation are not churners. Such issues are onboarding and activation problems. Like Matt says, “If you go on a first date with somebody, and they ghost you, that is not a “divorce” it’s an “activation” problem.” As such, these issues need different fixes. - Focus only on addressable and regretted
Often, churn is concentrated among small or occasional users who don’t really need your product or service daily. In such cases, you cannot do very much to make them need you (i.e., it’s not addressable). And the amount of revenue you’re missing out on is not remarkable (i.e., it’s not regretted). Do not focus your energy on such churn. - Account churn vs. revenue churn – is your revenue concentrated?
In their efforts of cracking the $100M churn problem, PayPal found their B2B revenue to be very concentrated. ~90% of revenue came from ~10% of their merchants. So, they focused on revenue churn rather than account churn. That narrowed down the problem to a couple hundred merchants. - Then, dig into the details! (intern optional).
What this means will be different for each company. In PayPal’s example, their intern spent months reconstructing the churn scenarios for each case, from risk, compliance, customer service, and so on, to see what went wrong. Then, the intern bucketed them into about 20 scenarios, based on which they built a predictive model that would alert them of cases where churn was likely to happen, and for what failures.
Let us now dig deeper into a few other practical examples for identifying causes of churn and how to address them, with real-life examples.
How to increase customer retention in the onboarding and activation phase of the customer’s journey
In the early phase of the customer’s journey, your retention relies on onboarding and activation. Many businesses struggle with this in the early days of the company.
In such cases, the best approach is to get as much customer feedback as possible. Ask as many of the early churners as possible: “Where did you get stuck?” You can even take it one step further and ask all sign-ups: “What are you finding useful and is there anything you would like to see that our product/service does not do yet?”
Example: How Outfunnel figured out key obstacles to activation and addressed them with onboarding automation
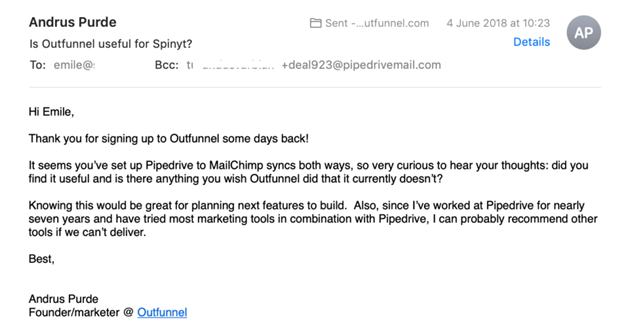
Andrus Purde, the co-founder and CEO of Outfunnel did exactly this in the early days of their company’s journey. As the SaaS company was getting just around 5 sign-ups per day, Andrus took the time to:
- review each sign-up’s app usage,
- research the company the sign-up was coming from, and
- send a personal email to get as much feedback and input as possible.
Pro tip: Response rates are not always super high for such emails, even if they come from the founder and are actually personalized. One thing you can do to increase response rates is to offer 25–50USD gift cards as a thanks, especially if the contact seems to be a very good fit with your ideal customer persona. Considering the potential upside, 25–50USD is cheap!
After a while, certain patterns emerged in the responses to Andrus’ emails. It became clear that customers get stuck for similar reasons.
In short, what needed to be done then was to address these reasons in the onboarding journey, to make sure the new users signing up are set up for success. Outfunnel mainly did this with onboarding emails—you can read more in the full case study on how Outfunnel automated their onboarding.
Now, you may say: “Sure, this is doable if you are getting a handful of new sign-ups every day. But it is not scalable for dealing with churn!” Which takes us to tackling customer churn with feedback in the later stages of the customer’s journey.
How to increase customer retention among those who have already started using your product or service
When your customers use your product or service for a while, and then “go dark,” it’s true customer churn. In such cases, a similar qualitative approach is helpful for determining the causes of such churn.
Example: How SparkToro tackled churn and changed the company’s trajectory with one customer feedback email
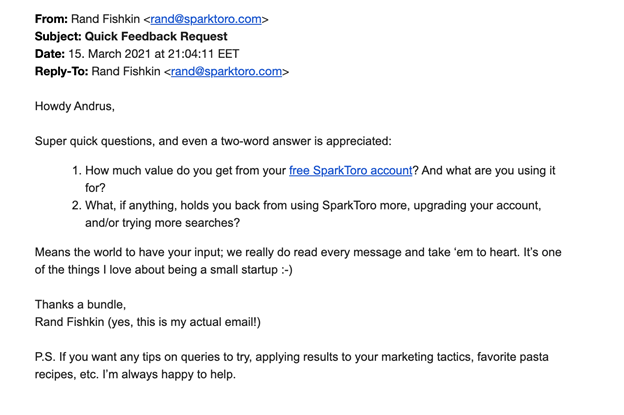
Example: How SparkToro tackled churn and changed the company’s trajectory with one customer feedback emails.
So, the question about doing this at scale has already been answered. If Rand Fishkin can find time to prioritize customers’ feedback, you can, too.
“/../ we learned a ton about what’s holding folks back from using SparkToro and/or getting more value from the free account.” — Rand Fishkin
Do you want to guess what he did with the learnings? That’s right, he looked for patterns in where customers got stuck and then addressed them.
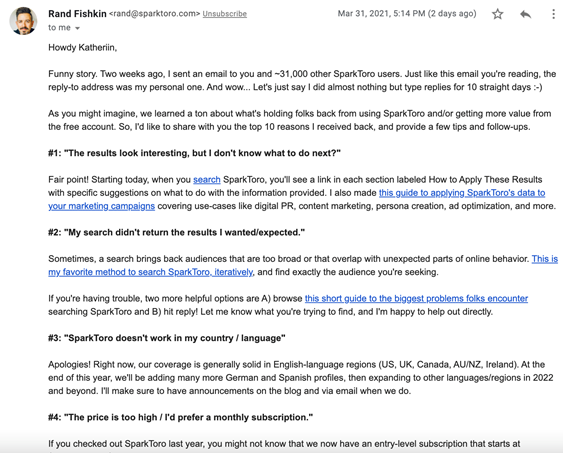
Below is an insightful snippet of the follow-up email Rand sent to the same user base, two weeks after the initial outreach asking for feedback.
It directly addresses the top 10 reasons that SparkToro’s users fail to get value from the tool, causing issues with retention. Further, it outlines a few other ways that SparkToro took on their feedback and improved their product to help their customers adopt their tool.
See Rand’s own overview of the experiment and results on the Sparktoro blog: One Customer Feedback Email Changed Our Startup’s Trajectory.
How to reduce customer churn that’s fluctuating unexpectedly
Not all churn is created equally. Every now and then, you will go through phases of higher churn, even if you have identified and addressed the main obstacles to adoption as described above.
This is where user behavior analytics come in handy. There are a few places in users’ behavior you can look for causes of higher-than-usual churn.
First off, it is worth looking at the source of leads in your primary traffic analytics tool, e.g., Google Analytics. If you use a web visitor tracking tool, then its reporting will likely be even more telling. It could be that your incoming leads are lower quality than usual. Perhaps a media mention or a marketing campaign has brought you a bunch of sign-ups for whom your product is not a great fit.
Secondly, you may want to look at product or service usage. Perhaps you’ve made some changes to your product that have had a negative impact on adoption and retention.
Tools like Smartlook’s Retention tables are perfect for such analyses. They make it easy to tease out retention issues in marketing and in-product.
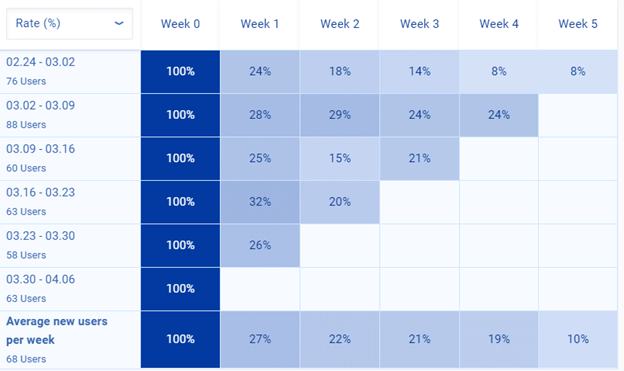
In short, Retention tables show how people who visit your website or use your app engage and disengage. They start with a certain group of users or visitors (100% of a cohort) and show a progressive drop-off—the decline in user engagement over time for that particular group over the same time frame.
Such analytics are great for providing insights into retention issues, and can help you identify the causes for customer churn. Once analytics surface these, you can look into addressing them—for example, by ending that marketing campaign that is bringing in low quality leads or reviewing your product developments accordingly.
Summing up
Churn and customer retention efforts are as important (if not more important) to revenue growth as customer acquisition. And though there is no one-size-fits-all approach to improving retention, both quantitative and qualitative research methods can be helpful, depending on your specific situation.
What other approaches have you found helpful for reducing customer churn? Let us know in the comments section.