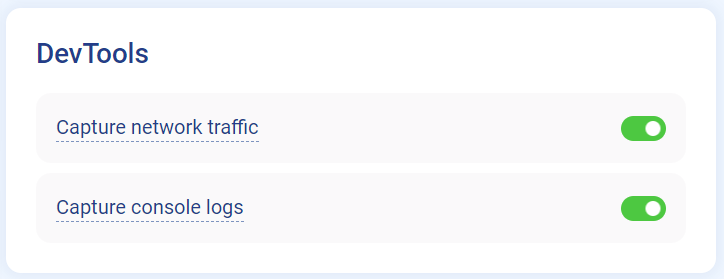
Let’s take a closer look at the 3 key components that make up our DevTools.
Console (websites only)
We kept it similar to the console found in website browsers to minimize the learning curve. Spot the events that have already occurred (blue rows), including those that are about to take place in the session recording (lighter rows). To make things easier, you can choose color-coded levels: verbose, info (blue), warnings (yellow), errors (red). Additionally, you can use the filter option.
The console helps with the debugging process by allowing you to see what took place if the session recordings show something unexpected.

Network (website + mobile)
Website
When implementing Network tracking on your website project, choose from either simple or advanced network capturing.
- Simple
- Set it up using Project settings → Recording tab → DevTools → Capture network traffic
- Network traffic is tracked using the browser’s API
- Basic information only – URL, duration
- No request/response bodies and headers

- Advanced
- Set it up by activating Simple first
- Inspect request/response bodies and headers
- Further filter data by type into Fetch/XHR, Assets/media, JavaScript, or other assets
- Set it up through web SDK tracking code

Mobile
The Advanced Network available for mobile projects
- Advanced
- Set it up through mobile SDK
- Information about both response/request bodies and headers
- Ideal solution for debugging problems involving the login process
- Possibility to filter request and response data through robust API

Performance (websites only)
Discover core website vitals measured by Google Benchmark and get an idea of how your site performs in the user’s browser. Metrics include – First Paint, First Contentful Paint, Cumulative Layout Shift, Largest Contentful Paint and First Input Delay. To learn more about what each metric represents, click on the information button next to it.

DevTools are ideal for developers and customer support specialists who need to identify problems ASAP. Use the DevTools to determine what took place and send user sessions to your development team for review. With DevTools, you don’t have to be a developer to track and spot errors. Ensure a spotless customer experience with minimum error.


