So much so that a whopping 88% of customers won’t return to a website if they had a bad experience. Measuring website performance, therefore, is imperative for every enterprise, big or small.
Know that the factors affecting your website’s performance continue to evolve with time. Also, the dynamic nature of websites gives way to performance issues that can occur at any time.
In order to have an accurate, quantitative understanding of a website’s performance and reliability, certain metrics or indicators must be kept in mind and continuously monitored.
What are they? Keep reading to find out.
10 essential metrics you need to monitor for web performance
Whether you have a simple website – one that principally serves an informational purpose or is a complex web application. Both require you to carefully track how prospects interact with them. Only then can you ensure a smooth user experience and boost conversions. To identify the areas where your website requires improvement, here are the 10 metrics that can help.
1. Page traffic
This metric measures the number of prospects visiting your website and tells you how the site performs under the stress of maximum traffic load. Depending on the page traffic, you can include a load balancing solution in your website’s infrastructure.
To improve page traffic, certain organizations delve into the common practice of delaying the loading of specific elements on a web page. These mainly include advertisements and third-party scripts. By delaying their appearance on the screen, you allow for the primary elements to load first. After all, these are critical assets responsible for bringing home conversions.
Not sure how to measure your page traffic? The easiest way to do so is by leveraging analytics and tools to track metrics related to your website’s traffic and, consequently, its performance.
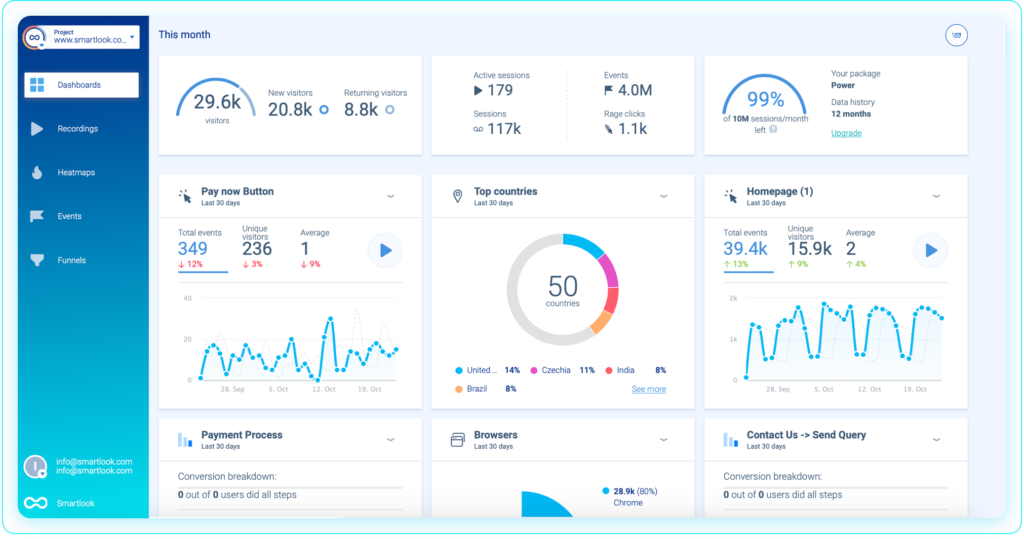
For example, Smartlook’s API helps you identify customers who visited your website with their names and email addresses. In addition, this tool helps track every visitor’s journey, so you know when users come back and for what. Also, by using Smartlook’s 30+ advanced filters, you can record the entire browsing session of visitors, which helps figure out the city they come from, the device they use, and the web page sections they spend the most time on.
Such valuable insights can help you identify newer lead segments and also improve upon the content of your web page.
2. Uptime and downtime
The uptime and downtime metric measures the availability of your website globally. Ideally, your website must always be up and running with 0% downtime. However, this is often impossible as even the best servers hosting your site crash or require ad-hoc maintenance.
Therefore, expert studies suggest that the uptime for your website should be 99.999%. Know that if your website experiences downtime often, you stand to lose credibility, but that’s not it! Substantial downtime hurts your search engine ranking as well. And better rankings equals more web traffic and higher conversions.
You can use several tools available online to measure your website’s downtime. If you find it to be lower than the percentage given above, here are a few things you can do to improve it:
- Always host your website on a reliable hosting platform.
- Optimize your web page, so it doesn’t carry heavy images or videos.
- Ensure ample server capacity.
- Invest in an experienced developer who can write elegant code.
- Backup your website so you can host the backed-up site on another hosting platform instantly if your primary website goes down.
3. Complete-page load time
Users do not prefer to interact with a website in which one complete page with all its integrated components has a very high load time. Ideally, you should optimize your web page in such a way that it doesn’t take more than 2 seconds to load.
Anything more prolonged, and you run a serious risk of losing your visitor. Moreover, the longer your complete-page load time, the lower your search engine rankings. Remember, for engines like Google, site speed is a parameter in ranking websites.
If your complete-page load time is high, here are a few quick fixes to aid the situation:
- Shorten the distance your website’s information needs to travel between the end-user and your server. How? By investing in a CDN or Content Delivery Network.
- Use a fast and reliable website hosting service.
- Compress images for a faster load time.
- Avoid redirecting your URLs.
4. Organic searches
Organic searches include results coughed up by search engines that cannot be bought through paid advertising. If your website has a high organic search score, congratulations because more and more prospects are visiting your website on their own. What improves your organic search score? Keywords!
Keywords are the linchpin between the solutions your prospects are searching for and the content you’re offering to fill that gap. Simply put, your website must contain specific keywords or phrases that your audiences are typing into search engines to address their needs and challenges.
If you infuse your web content using the same keywords your leads search with, you land upon the very first page of Google without sponsoring ads. So, it can be said without a shred of doubt that analyzing your organic searches or your website’s SEO effectiveness as a whole is critical for improved web performance.
How can you measure your website’s SEO effectiveness? Applications like Boostability offer a free SEO Analyzer that figures out how you are faring against competition, your keyword rankings, the state of your backlinks, and much more. These insights can help you identify the problem areas of your website with respect to search engine optimization.
5. Database response time
Since most of your website’s dynamic content is pulled from its database, the site must have a quick database response time. Now a new website often does, but its performance falters as a few years pass, leaving users with low database response time. Here’s how you can improve it.
- Again, nothing works if you don’t have the right hosting server. So, invest in one that works fast.
- Clean and append your database. Further, optimize it by looking for bugs in your HTML or JavaScript, or CSS files.
- Minifying your database files, meaning identifying and deleting unnecessary code, will also improve your database response time.
6. Broken links
There’s nothing more discouraging for the user, and more devastating for a business website, than a 404 error! Even search engines find broken links repulsive, and they can destroy your conversion rates. So, can you fix them? Yes, you can! Here’s how.
Before rectifying broken links, you need to find them. For that, you can either spend weeks or months going through every single web page on your site or by leveraging “Crawl Errors” on Google Webmaster Tools. This application will show you the broken links on your website.
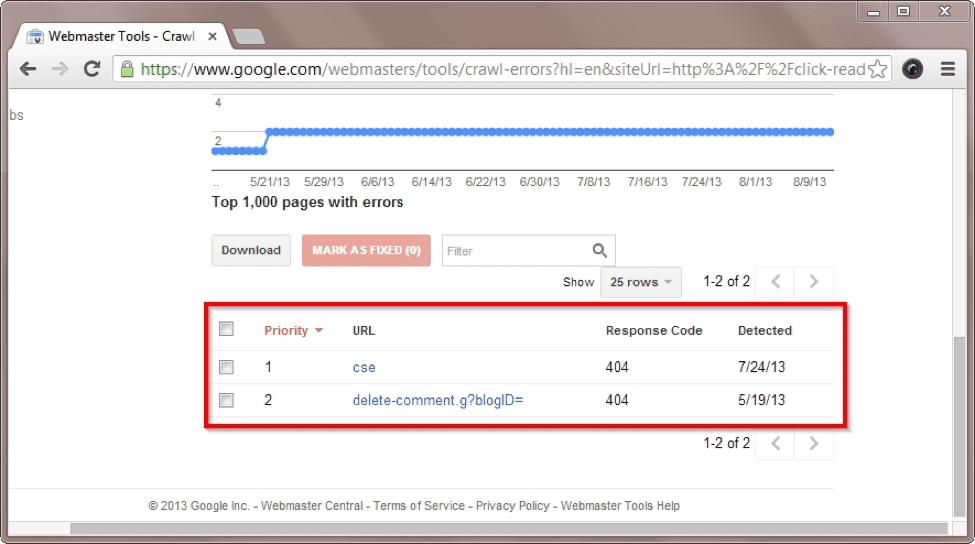
Once you’ve figured out the broken links on your website, delete them. Retain the page and provide it with a freshly-coded URL.
7. User experience (UX)
A great user experience signifies that your website has a good workflow. There are certain key UX metrics like Net Promoter Score (NPS), Customer Effort Score, and Customer Satisfaction Score that you must leverage for the continuous improvement of your website. Doing this is ultimately conducive to the long-term success of your business.
Anyway, to better the user experience on your website, you need to know what your users feel about it. And, for that, you need to know what they do on your website.
Smartlook’s Heat Map feature is an effective way to analyze user experience by tracking their behavior on any given page of your website. By studying these Heat Maps, you can answer burning questions like, are all essential elements such as taglines, CTAs, and images above the fold line? You can also figure out the scrolling patterns of users – how far down are they scrolling, and for how much time.
With these sharp insights in your kitty, you know exactly where your web page requires UX upgrades.

8. Requests per second
Also called “Throughput,” this metric measures the total number of requests – purchases or otherwise that your server receives every second. Evaluating this metric can become a primary marker to know whether your website is performing as it should.
You can use this metric in combination with other parameters. For example, if your “page traffic” is significantly high, but “requests per second” are scanty, it means something is making interested leads drop off before completing an action. Perhaps, your purchase page is taking too long to load, or it doesn’t contain enough information for users to move on.
9. CPU load time and memory usage of web server
It is vital to keep an eye on high CPU utilization and memory. Certain features put your hardware components under unbearable loads, due to which the performance of your website suffers. When this happens, you need to get your IT team together.
They can help you identify troublesome features, fine-tune them, and, if necessary, upgrade the hardware components of your web server.
10. Conversion rate
With all technical and aesthetic indicators sorted, it’s time to count the number of unique web visitors who converted into customers. The mathematical formula for calculating the conversion rate is to simply divide the number of conversions by the total number of site visitors.
There are many ways to improve your conversion rates. For starters, you must keep an eye on the overall quality of your website simply to determine whether it is readable, appealing, and valuable to your target audience and the general audience.
Parting thoughts
Measuring your web performance can seem overwhelming given the number of metrics that offer measurability. But, not all parameters are as useful as the ten listed in this article.
So, rather than accomplishing the daunting task of measuring all web performance metrics, begin your journey by assessing the right ones that help measure your web traffic, up and downtimes, and user experience.
Monitoring these parameters is especially easy now that you can request a free demo of Smartlook’s web performance analytics toolkit.