Collecting and analyzing data allows businesses to improve their strategies and hit their KPIs using the information and data they collect.
Data-driven decisions should be made in every aspect of business operations, including marketing. That’s why your marketing tech stack should consist of 2 powerful tools – Google Analytics and Smartlook – to help you fine-tune your website and make it more attractive to visitors, than ever before.
In this article, we’ll take a closer look at both tools. We’ll show you the ins and outs of both of them and explain how they work together seamlessly.
Google Analytics 101
What is Google Analytics?
The tool allows you to track metrics related to the performance of websites, blogs, web apps, and more. It provides you with default and customizable reports in the form of aggregated information about the traffic coming to websites, based on the audience, acquisition, behavior, and conversions that take place on a specific website.
In fact, it provides data on metrics as varied and essential as the following:
- number of visits
- duration of visits
- traffic sources
- visited pages
It also collects data on aspects such as:
- sections preferred by visitors
- keywords used
- demographical data of users
- technical details of visitors’ devices, including the browsers used on mobile operating systems
What is it for?
When you use a web analytics tool, you know perfectly well what is happening on your website. That way, you’re able to maintain control over your marketing activities and make informed decisions.
The best way to understand how much information Google Analytics can provide you with, is to check simple examples of the type of data it collects.
Examples of user behavior metrics:
- number of users visiting your website – Google Analytics measures the number of different users that have visited your website in a given period, which can be found in the sessions section
- average number of pages visited by each user
- how much time users spend on each page
- bounce rate – a measure of the percentage of visitors who leave the website immediately (within a few seconds), with a high value indicating the serious potential problems of either not reaching the right audience or providing content that is not attractive enough
- most visited pages – based on this data, you can choose priority pages that drive the most traffic
- time distribution of visits and visits in real time
What is very interesting is how you can use these metrics. They are not simply global data for the whole website, but they can be checked for each of the site’s pages to give you insights into the performance of particular ones that interest you.
Examples of traffic sources
Sources of traffic are closely related to the metrics mentioned above. It is vital to know where visitors come from to your website, as this allows you to know which communication channels work well and which ones are still untapped or performing poorly.
These are rather obvious metrics, so we will just list them without further comment:
- social media traffic
- Google searches
- online advertising
- visits directly from an email
- direct traffic
Examples of demographic and geographic information
The next group of metrics is also quite obvious:
- gender distribution of visitors
- visitors’ ages
- visitors’ interests
- distribution of countries and cities that traffic comes from
- country and city of origin of each user
These are just a few examples of the data types that Google Analytics can collect, but they’re kinds of raw data that are not put into context. They show you, in numbers, what happens on your website and what type of visitors it attracts, but it doesn’t necessarily help you understand how certain user behaviors connect and why people interact with your website in the way that they do. To gain a deeper understanding of how your pages are perceived by visitors and what causes certain behavior, you need an additional tool – namely, Smartlook.
Smartlook 101
What is Smartlook?
Smartlook is an advanced analytics tool that can be used for analyzing the performance of websites, mobile apps, and mobile games. It’s a comprehensive solution that enables you to analyze visitor behavior in various ways and literally see how they interact with your website or app.
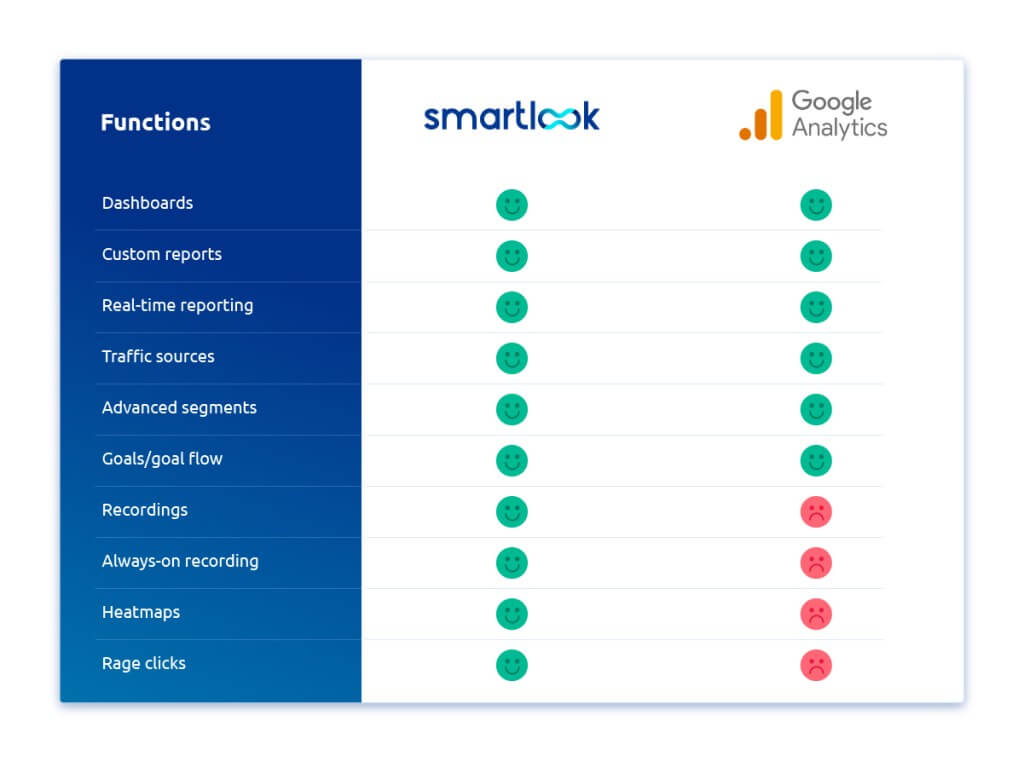
Smartlook is easy to set up and use, doesn’t slow your device after installation, and provides masking tools that you can use to minimize personal or sensitive information captured through the Smartlook platform. It offers various advanced features that will be discussed later in this article. What’s important about Smartlook is that it provides you with some information and features that are similar to the data collected by Google Analytics, such as the number of users who visited specific landing pages, analyzing the time they spent on a certain page, filtering users based on location or device (there are more than 30 filters you can use), finding out how many sessions took place on your website in a particular time, and much more.
However, as already mentioned, Smartlook is a solution that provides supplementary information about your website’s performance, which Google Analytics does not provide. Continue reading this article to learn what data Smartlook can collect for you about your website.
What is it for?
Smartlook provides 5 major features for website analytics – heatmaps, recordings, events, funnels, analytics and reporting, and retention tables – which, when combined with data from Google Analytics, give you an in-depth overview of the overall performance of your website.
Heatmaps
This is a major feature that Google Analytics does not provide. Heatmaps visually present how users interact with your website and which elements of the analyzed pages attract their attention the most. Areas on heatmaps marked in a red color correspond to parts of the website that users focus on. You can assume that the content in that particular area is more interesting than elements represented by a blue color. There’s more “heat” being generated in the red-colored areas.
Recordings
This feature provides insights into how users interact with your website. By reviewing session recordings, you can see your website through the users’ eyes – check where they click, what elements of each page they browse through, as well as when and where they get confused or lost. Recordings should be used to pinpoint bottlenecks and parts of your website that are problematic for users.
Events
The events feature enables you to monitor specific elements of your website or interactions through recordings. An event can be a click on a chosen CTA or button, text typed into a field, or a click that plays a video. This feature is used to start recordings following a certain action performed by a user or to filter recordings to obtain more specific data about how users interact with your website. Events are priceless if you want to track the efficiency of new features or compare them with previous versions, etc.
Funnels
A funnel is a path that you’ve designed for website visitors to follow, i.e., a list of certain actions that lead to an outcome which is desired by your business. The funnels feature enables you to monitor particular funnels on your website and measure their efficiency, or spot parts that make users drop out of a funnel. Because you can build funnels out of events, you can use Smartlook to monitor various funnels within your website and at the same time, to see whether its design supports your business objectives and leads visitors to conversion points.
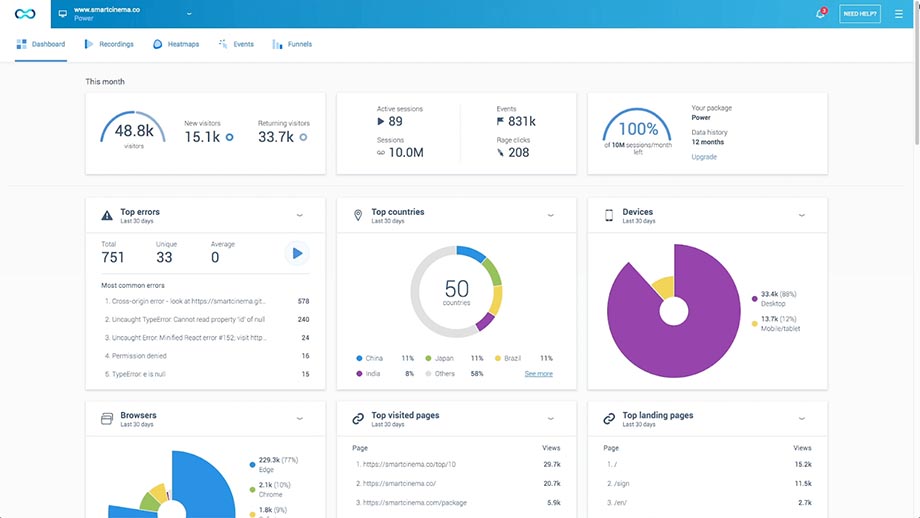
Analytics and reporting
All of the data you collect with Smartlook by using heatmaps, recordings, events, and funnels are organized into user-friendly dashboards. They help you to access all of the necessary information and display it in an easy-to-analyze form, including recordings and heatmaps.
Retention tables
Retention tables are another feature that makes Smartlook stand out and plays a role in the tool being a supplementary element of every web analytics tech stack. This easy-to-navigate feature presents user retention in a visual form, showing how different parts of your website influence the number of visitors and users. You can create a retention table out of any event and see how this metric changes over time, for a particular element of a page.
There’s one more thing that you should know about Smartlook. It enables you to collect data retrospectively, which means that you can create heatmaps or funnel analyses using historical data. This is possible because Smartlook starts collecting data immediately after you install it on your website, not from the moment when you create a particular heatmap or funnel.
Now let’s see how these 2 powerful tools – Google Analytics and Smartlook – can help you better understand the way your website works.
Smartlook and Google Analytics
Zoom in and out
Google Analytics is a great solution to get a bird’s-eye view over your website’s performance. It shows you the best and worst performing pages, provides traffic sources, as well as showing you demographic and geographic data about your website’s users. However, it does not enable you to see exactly what happens when a user lands on a particular page. You can use Smartlook’s recordings to see what happens on high-performing pages and compare them to those that don’t attract enough visits or get a high bounce rate, which will help you to ensure that more pages achieve good results.
Understand your users’ needs and behavior
With data collected by Google Analytics, you can follow the path taken by each user, see how much time they spent on each landing page, how many times they returned to your website, and where they came from in the first place. But you don’t get any information about what actually brought them there – what they’re looking for, which elements of the website attracted their attention, and if they even noticed a new section that you added recently.
See the factors behind your conversion rates
Measuring the conversion rate is easy, and understanding whether a particular landing page works is also pretty straightforward. Plus, data from Google Analytics can help you do those things by measuring the performance of each conversion point and comparing it to the overall traffic.
However, if a certain page does not perform well, you can only guess what might be the reason for that, and why visitors don’t behave the way you want them to. You can check the scroll depth, but you won’t know what caught a user’s attention and stopped them from filling out a form at the bottom of your page, or at what point they dropped out of a funnel. This information can, however, be provided by Smartlook.
Find ways to improve your design and validate your content
Google Analytics data will help you understand which landing pages perform best. Based on that, you can assume that the design used for these pages and the content you present there are appealing to your visitors. If you change something on a particular landing page, you can also rely on Google Analytics data, such as traffic or bounce rate, to assess whether new designs or copy improve performance or not. Then, with the visual representation of visitor behavior provided by Smartlook, you can see exactly which elements attract the most attention and which ones do not serve their purpose so well.
For example, you can see that:
- A call to action is not working at all
- A button is placed in a location where the average user cannot easily find it
- A certain design element is ruining the user experience and causing the visitor to bounce
- A page is inducing rage clicks with your visitors
- And more
Spot dead ends
Smartlook enables you to follow your users, step-by-step. You not only see each of their journeys through your website in the form of a list of actions taken, but you can see every step they take and understand why they stopped at a certain time. Without a visual representation of a user journey and relying solely on Google Analytics data, you won’t be able to spot problematic elements like bugs or complicated forms. You’ll be able to spot elements that are the likely cause of problems, frustrate users, or make them leave your website, but you’ll not be 100% sure.
How to make the most out of the 2 tools?
To use the highest potential of both Google Analytics and Smartlook, you should first match the tool to the data and know what data they can both provide you with. In general, Google Analytics gives you an overview of your website’s performance and enables you to spot which larger elements require improvement. That’s why you can rely on it in terms of simple behavior metrics, traffic sources, or demographic data. Then, Smartlook should be consulted to better understand what happens when users visit a certain landing page, precisely what path they follow, and what conclusions can be drawn from their behavior and actions taken.
Smartlook offers full integration with Google Analytics that’ll enable you to play user recordings made by the former straight from the latter. You just need to take 6 easy steps to be able to open a list of segmented recordings in Smartlook.
Recap
As you may now see, having 1 powerful tool is not enough to get all of the analytical data about your website that you may need. That’s why it’s best to combine the possibilities provided by Google Analytics with in-depth insights offered by Smartlook to make sure you’ll know not only how your website performs, but you can also learn exactly how it’s perceived and used by visitors, and which elements require immediate improvement.