LogRocket is best known as an error tracking and frontend monitoring tool. In recent years, they’ve also expanded their reach into product analytics territory with features like session replay, heatmaps, and path analysis.
However, LogRocket is still primarily built for technical roles (developers, quality assurance experts, etc.), so it has some drawbacks for teams looking to use it for web or mobile analytics. Specifically:
- Key analytics features like funnels, path analysis, and heatmaps are only included in the “Professional” plan which starts at $550/month. Most product analytics tools include these features in much cheaper plans, and sometimes, in their free tiers. Overall, LogRocket’s “Free” and “Team” plans don’t include any analytics features outside of session replay.
- You need coding skills to track individual user actions (events). Because LogRocket is built for technical roles, it relies on users being able to write JavaScript code and use their SDK to track events.
- There’s no mobile app crash detection feature. While LogRocket detects front-end errors, it can’t track mobile app crashes, which are among the biggest catalysts for poor user experiences and churn.
In this article, we’ve compiled the seven best LogRocket competitors that can help you overcome these limitations, starting with Smartlook — our comprehensive product analytics and visual user insights platform.
Here are all the LogRocket alternatives we cover below:
We’ll explore each tool’s key features and pricing, so you can make an informed decision.
Smartlook is the only combined product analytics and visual user insights platform that won’t take your team forever to set up. Book a free demo with our team to learn how Smartlook can benefit your business or try it yourself with a full-featured, 30-day trial — no credit card required.
1. Smartlook
- Pricing: Starts at $55/month for sites and apps with up to 5,000 monthly user sessions. All Smartlook accounts start with a full-featured, 30-day free trial.
Smartlook is our product analytics and visual user insights platform that combines session recordings, heatmaps, events, funnels, DevTools, and other powerful analytics features.
Organizations like Tesco, Papa John’s, and Kiwi.com use Smartlook to:
- Automatically record everything their users do with a single code snippet.
- Quantify user behavior with features like event tracking and funnel analysis.
- Uncover why users do what they do and find ways to boost customer engagement, conversions, and retention.
Smartlook’s versatile features, plus its support for websites, web apps, and native mobile apps, make it a powerful tool for:
- Marketers looking to analyze user behavior and boost conversion rates.
- Product managers who want to uncover exactly how customers use their product and where they get stuck.
- Developers and quality assurance (QA) teams struggling to understand how bugs, app crashes, and other usability issues occur.
- And many other team members.
In the next section, we’ll discuss five benefits of using Smartlook over LogRocket for various analytics and debugging use cases.
#1. Get a complete analytics suite in one cost-effective package
Smartlook was built to help organizations analyze users’ behaviors, get qualitative insights into their experiences, and make educated product decisions.
Because these are complex, multi-team tasks, our platform brings together versatile features that can help many teams in their day-to-day work. For example:
- Session recordings (available on all Smartlook plans, including the free one) show you exactly how users navigate your site or app, from the moment they open it, to the moment they close it. Session recordings are a great way to understand user behavior and see exactly how issues occur. Learn more: How to record website visitors: Practical tips, tools & examples.

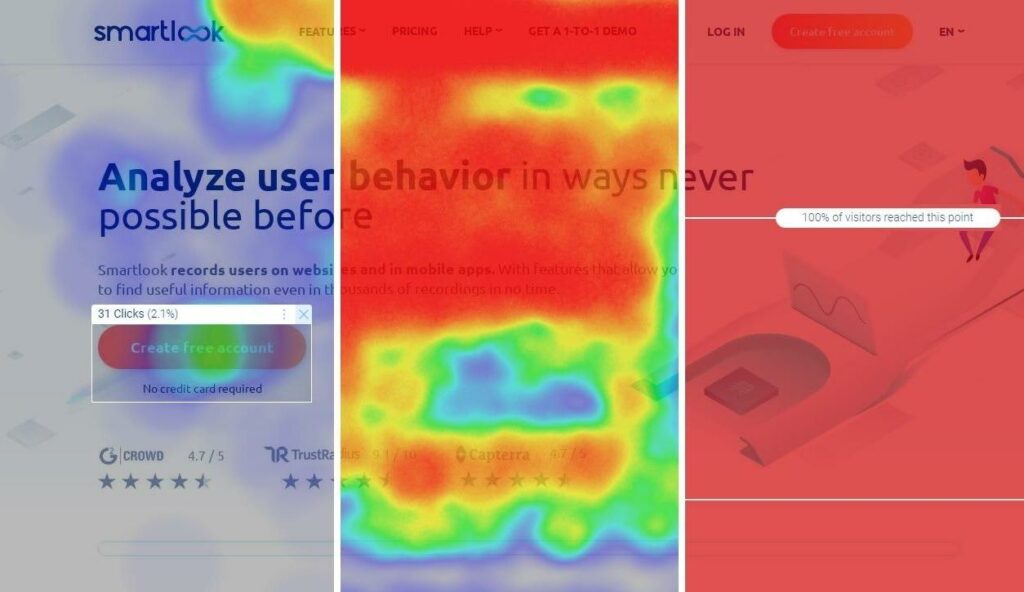
- Heatmaps (available on all Smartlook plans, including the free one) give you an overview of the typical user experience on a page or app screen. They’re super easy to create and analyze, making them a great starting point for user behavior analysis. Smartlook supports three types of heatmaps — click maps (left in the image below), move maps (in the middle), and scroll maps (to the right). Learn more: 9 best heatmap software tools for websites and mobile apps.
- Events (available on all Smartlook plans, including the free one) are user actions you can track over time, like button clicks, page visits, purchases, and more. Smartlook automatically collects user interaction data and lets you track lots of events without coding, as we’ll discuss later.
- Funnels (available on all Smartlook plans, including the free one) let you analyze how users navigate multi-step flows like checkouts or onboarding tutorials and calculate their conversion rates. Learn more: How to improve conversions, retention & UX with funnel analysis
- Key metrics (available on all Smartlook plans, including the free one) let you track the top visited pages, users’ locations and devices, daily, weekly, and monthly active users, retention, and more.

- DevTools (an add-on for our “Pro” and “Enterprise” plans) gives developers and QAs the technical data to understand what’s happening in users’ browsers, including network activity, console logs, JavaScript errors, and more. You can learn more about Smartlook’s DevTools in our documentation.

These essential analytics features are available in all Smartlook plans (with the exception of DevTools). As a result, you can get a complete suite of web and mobile analytics capabilities at a much more cost-effective price compared to LogRocket’s $550/month starting price tag.
#2. Track business-critical user interactions and build event-based funnels without coding
Smartlook makes it easy to quantify user behavior by:
- Tracking individual user actions (events).
- Building event-based funnels that show how users navigate key flows and where they drop off.
Here’s how.
First, Smartlook automatically records all user interactions with a single code snippet. This means you don’t have to specifically tell it which user actions to capture (unless you want to track custom events).
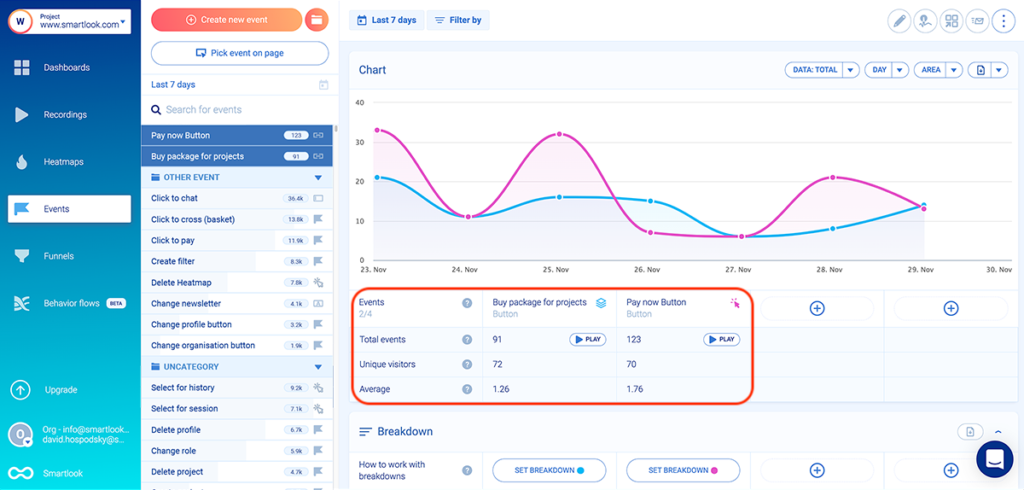
With the user interaction data automatically collected, all you have to do is select which actions you want to track as events. This is as simple as selecting from a list of standard events or clicking on your site’s UI, as shown in the screenshot below.

And since Smartlook also has session recordings, you can quickly find all sessions where a certain event was triggered.
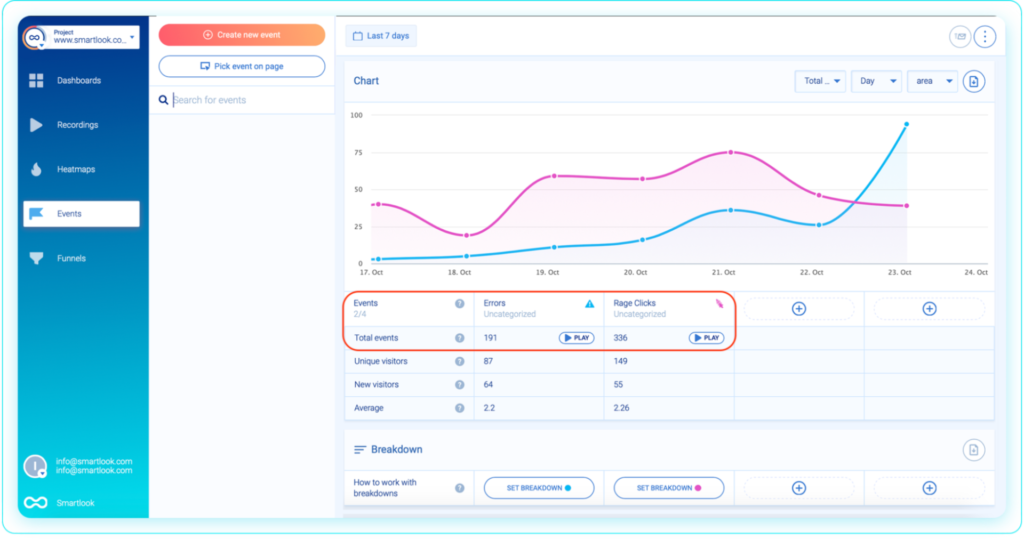
Additionally, Smartlook also tracks JavaScript errors and rage clicks as events, so you can watch the sessions of users who experienced an error or were frustrated.
You can also use your events to build funnels — sequences of steps users go through to complete a goal, like:
- Buying a product.
- Subscribing to your newsletter.
- Completing an onboarding tutorial.
This is as simple as placing the events in the order you believe your users follow, as shown in the GIF below.
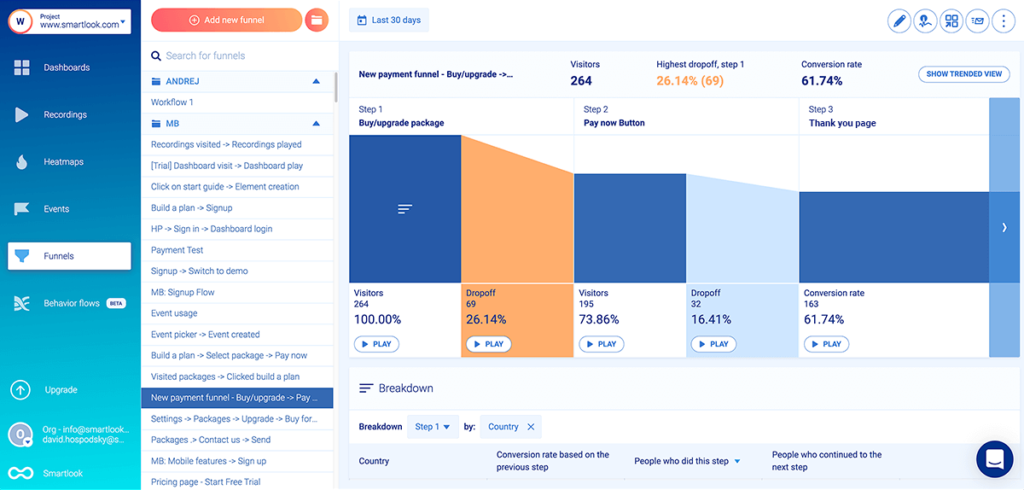
For example, the screenshot below shows a three-step checkout funnel.
As you can see, there’s a play button under each step, including the drop-offs, allowing you to jump into the sessions of users who dropped off between specific steps. This means you can find points of friction in your flows much faster compared to watching the sessions of all users who entered this funnel.
#3. Record sessions compliantly and efficiently by default
A common concern about session recorders is that they have the potential to capture personal and sensitive data. While all reputable session recording tools have features for avoiding this problem, they require different levels of setup.
For example, LogRocket lets you mask and exclude elements that contain passwords, credit card info, or personal data, but this has to be done manually via code changes.
On the other hand, Smartook can do most of the heavy lifting for you.
First, our SDK was created with privacy in mind, so any potentially sensitive data — like passwords, credit card info, and IP addresses — is not recorded by default.
Second, Smartlook also offers Wireframe Rendering Modes for mobile apps. When enabled, these modes draw a representation of the content on a screen, instead of capturing your app’s UI as users see it, as shown below.

You can still watch all user interactions but without any possibility of revealing any personal data. This means your session recordings are compliant by default — no need to mask or exclude anything by hand. Plus, this recording method is much less taxing on users’ devices, as we’ve explained in our article on the top mobile app analytics tools.
Lastly, you can also manually mask or exclude any additional elements from appearing in session recordings, just like you can in LogRocket.
#4. Automatically detect app crashes
App crashes can ruin your users’ experience and lead to higher churn. That’s why it’s crucial to have a way to quickly detect and debug crashes when they occur.
This is where Smartlook’s Crash Reports come in.
When you open this feature, which is included for free in every plan, you get a list of all app crashes, alongside information about the version of your app where a crash occurred and the number of users that experienced it.

From here, you can click on a crash fragment to see the entire stack trace and get details about the user who experienced it (their platform, device location, etc.).
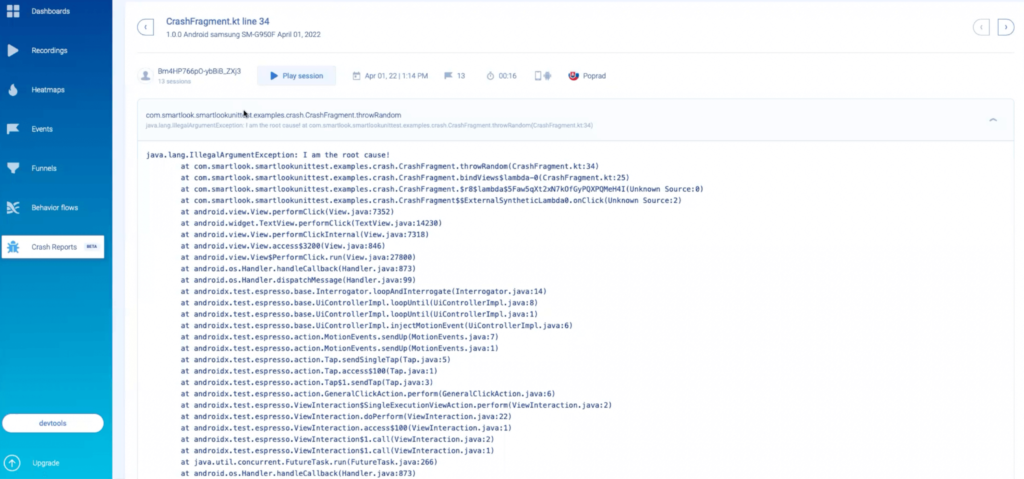
Lastly, you can click on the “Play session” button above the stack trace and watch all session recordings where a crash happened. This means you can watch every interaction inside every user session leading up to a crash, making it much easier for your developers and QAs to debug.
#5. Monitor user behavior across platforms
While LogRocket can help you monitor user behavior on websites and mobile apps, it can’t track the same users as they move between platforms.
As a result, teams who have both a website and a native mobile app can get a misleading view of the customer journey.
For example, say you have an e-commerce brand and users can start their journey on your site, add items to their cart, and finish their purchase on your mobile app. Without the ability to track users as they move between platforms, you’d only be able to see two different journeys — one that ends after users add items to their carts and another one that begins after they log into your mobile app.
To overcome this blindspot, Smartlook offers cross-platform analytics — a feature that lets you track and combine user behavior data from different platforms onto a single, unified dashboard.

You can also build funnels with events from different platforms, as shown below.

Going back to our e-commerce example, you can build a funnel that starts with users visiting your website (Event 1), adding an item to their carts (Event 2), and completing their purchase on your mobile app (Event 3).
In short, cross-platform analytics lets you track complex user journeys, understand how customers navigate your properties, and find points of friction you otherwise couldn’t. For more details, check out our cross-platform analytics guide.
If you want to learn more about Smartlook, book a free demo with our team or try the platform yourself with a full-featured, 30-day trial — no credit card required.
2. FullStory

- Pricing: Available upon request.
FullStory is a digital experience intelligence platform that combines session replay, heatmaps, events, conversion funnels, and segmentation functionalities. It takes a similar approach to Smartlook by automatically capturing every user interaction and letting you track events without coding.
One downside to FullStory is that it can get expensive, with many users reporting they couldn’t afford a plan that records 100% of their user session. For more details, check out our article on the top FullStory competitors.
3. Hotjar

- Pricing: Different for each of Hotjar’s products. The session replay and heatmap tool starts at $39/month, while the user survey and feedback tool starts at $59/month.
Hotjar is a behavioral analytics and user feedback platform. It combines a few different products:
- Observe, which includes heatmaps, session recordings, and event tracking
- Ask, which includes user interviews and real-time feedback widgets
- Engage, which lets brands perform user interviews
While useful for getting qualitative insights, the platform is very limited in the quantitative analytics department, which prompts many teams to look for an alternative to Hotjar.
4. Datadog

- Pricing: Varies depending on the capabilities you need. The real user monitoring and session replay suite starts at $2.60 per 1,000 sessions/month.
Datadog is a cloud monitoring service. It offers various tools for technical use cases — including infrastructure and network monitoring, log management, database monitoring, and more. It also has a digital experience analytics suite with features like session replay and error tracking.
5. Dynatrace

- Pricing: Varies depending on the capabilities you need. For example, the real user monitoring suite starts at $2.25 per 1,000 user sessions.
Similar to Datadog, Dynatrace is an observability, security, and digital experience platform built mainly for technical teams. It brings together solutions for six main use cases:
- Applications and microservices
- Infrastructure monitoring
- Application security
- Business analytics
- Digital experience
- Automation
6. Sentry

- Pricing: Starts at $29/month for basic code and error monitoring features
Sentry is an application performance monitoring and error tracking software. It’s compatible with a wide range of frameworks, languages, and platforms. They recently introduced a session replay feature, although you can also integrate it with Smartlook to get the best out of both worlds.
7. Glassbox

- Pricing: Available upon request
Glassbox is a digital customer experience analytics platform. It’s available for both websites and mobile apps and it comes with features like session replay, funnel analysis, heatmaps, error and struggle analysis, and feedback widgets. Like FullStory, Glassbox is also a more enterprise-oriented platform, so it doesn’t have transparent pricing.
Capture, analyze, and improve your user’s experience with Smartlook
You can see how Smartlook can benefit your business by booking a free live demo with our team.
Our tool can be used on all kinds of websites, including those built with popular CMSs like WordPress, Joomla, and Shopify. Implementing Smartlook on a site is as easy as pasting a code snippet (directly or via Google Tag Manager).
Smartlook also has SDKs for many mobile app platforms, frameworks, and engines — including iOS, Android, React Native, and Flutter. We have detailed documentation to guide you through the implementation — but if you get stuck or have any questions, our Support team is ready and waiting.
Lastly, Smartlook has integrations with tons of different solutions, including conversion rate optimization and A/B testing platforms (like Optimizely), web analytics software (like Google Analytics), and other popular SaaS tools (like Jira and Slack).
Try Smartlook’s heatmaps, session recordings, events, and funnels today with a full-featured, 30-day trial (no credit card required).