When you’re tirelessly on a quest to get higher conversion rates, drawing insights from your data is a must. That’s where analytics comes in! We’ll talk in this article about what should grab your attention and how to get the data you need.
What will you learn here?
- How do people shop online?
- What’s responsible for the conversion rate?
- How to spot your issues using Smartlook?
Ready? Let’s hop in!
How do people shop online?
To understand what makes people convert – or, in other words, how your audience buys products – you need to identify the basic characteristics of their behavior. We have all read about sales funnels and various stages of conversion, but those are just theoretical models made to simplify the concepts. For now, let’s focus on real-life behaviors.
They don’t follow one path
If only e-commerce purchases were as predictable as the sales funnels claim…
In real life, each customer journey is different and individual. Some of your customers will see an ad on Facebook and purchase your product immediately. Others will first read about it, compare different offers, look out for opinions, and then, after giving it a second or third thought, finally make an order. There’s no one-size-fits-all solution.
It doesn’t mean, though, that there’s no place for optimization or creating models that suit your business. You just have to keep in mind that your assumptions have to be tested and verified.
They compare different offers
A survey led by Wiser indicated that 96% of customers plan to compare prices to find the cheapest when shopping online. That’s a huge challenge e-commerce companies have to face: your customers have lots of tools to find the best deal.
Does it mean, though, that only the lowest price counts? Not necessarily. Although research by Statista in 2019 found that 70% of US buyers said competitive pricing is important when choosing an online retailer, they also mentioned other factors:
- free shipping (62%)
- a wide selection of products (50%)
- friendly user experience (32%)
- user reviews (25%)
Those factors change over time – in 2017, the most important factor for 63% of respondents was free shipping.
And where’s conversion in all this?
To align your conversion rate measurements and improvements, you need to understand how your customers make their buying decisions. This will help you spot key points in their journey when they have to choose whether to continue with or leave your business. They are moments of pain – when their experience is damaged because of errors or unexpected obstacles, like shipping fees – and moments of truth – when your users create their own brand perception.
Learning when they happen and how you can align your actions to push your users in the desired direction will result in an increased conversion rate.
What’s responsible for conversion in e-commerce?
Your conversion rate doesn’t come from nowhere. Don’t expect simple formulas, though – it’s a highly complex topic with numerous factors having an effect at the same time.
When looking for specific reasons for why your customers don’t convert, UX and cart abandonment statistics can give you some insights. Let’s talk about some possibilities!
Technical issues
If your page doesn’t load fast enough, your visitors are very unlikely to convert. As data shows, when a page loads in less than one second, the average transaction conversion rate is as high as 8.11%. Add one more second of waiting, and it drops to 6.32%! Another second brings it down to 4.64%, and when a visitor has to wait for over three seconds, the conversion rate is somewhere between 3% and 1.7%.
Five words can be read in just one second on average, so aim to boost your website loading time before you set off to improve other areas. Similarly, when you have an app on which your users can shop, make sure to regularly check its performance. Apart from preparing your infrastructure for high-usage peaks and taking care of scalability, remember about monitoring and analytics – just as with your website version.
Apart from how fast your page loads, there are multiple technical issues your users could face, and you might not be aware of them. Here, watching session recordings can help you get an idea about what your users have to deal with.
Payment and delivery options
Did you know that 53% of online shoppers leave their carts if they see unexpected extra costs? These could be associated with delivery or payment methods. The key point here is unexpected – if you can’t offer free delivery, make sure to show delivery costs before your visitor adds an item to their cart.
Similarly, make sure you provide different payment and delivery options. Check the most popular ones in your region and provide at least those options.
There is one more crucial point when talking about payments: safety. Make sure you include badges and certificates from trusted service providers: 17% of customers abandon their carts because they don’t trust the site with their credit card details.
Shop design
Is your online shop easy to navigate? Do your users find it easy to browse different categories or locate the exact items they are looking for? Does the site display well on different screen resolutions? UX design can make or break your ecommerce business, so check not only the aesthetics but also intuitiveness and usability when evaluating your online shop.
Here, tiny details matter. Having a noticeable call to action and the most important elements placed above your average fold line can really make a difference!
Customer support
Customer support can heavily influence your conversion rate. As Invesp claims, 83% of customers need support to complete their purchases. At the same time, 89% stop doing business with a store after a poor customer experience. Don’t leave clients unattended, and make sure your customer support is easy to reach.
Communication
Do your visitors know why it is worth their time to shop at your store? Do you tell them about free shipping, fast delivery, or a friendly returns policy? Those points may be obvious from your point of view, but your visitors probably won’t spend time checking the details of your offer if they can just head to a store where they know it upfront.
Make sure your value proposition and communication covers the pain points and needs of your customers. Also check if it’s written in an accessible language that is aligned with your communication strategy.
Social proof
Social proof and reviews are a powerful way to convince customers that your business is worth their time and attention. You can increase your conversion rate by as much as 34% just by showing your customers that people talk about your company and are happy with the service.
Where’s your issue?
This list doesn’t aim to be exhaustive – it’s a starting point for you to look for issues that affect your conversion rate, and ultimately, your business.
The next section will help you define your bottlenecks.
How can Smartlook help you boost your ecommerce conversion?
How do you know what stops your ecommerce business from achieving higher conversion rates? Analyze your user behavior! Smartlook provides you with different tools and options to get the answers you are looking for.
Let’s talk about how you can find relevant information that will help with boosting your ecommerce conversion.
Where are the pain points and bottlenecks?
The first question helps you find the areas that need the most effort, but can probably produce you the most impressive results. It doesn’t mean, though, that you should stop there – conversion rate optimization is a broad topic.
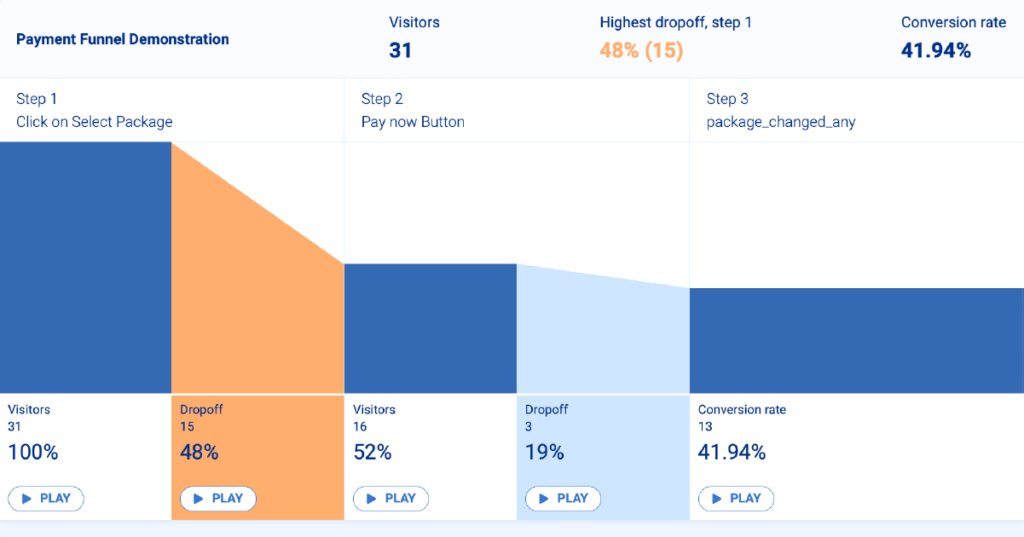
Smartlook solution: funnels, session recordings, and events.
Smartlook’s funnels feature lets you create your own funnels based on various types of events, and measure the conversion rate between each step. Unlike Google Analytics, you can create new funnels and obtain interesting data immediately. Smartlook will start by analyzing data retrospectively, so you can go as far back in time as your data package lets you.
When you notice where in your funnel the conversion rate drops significantly, head to the appropriate session recordings. That’s how you will be able to spot all the possible problems and obstacles to understand what’s wrong. Smartlook shows you exactly how your user sees your page, so you will have precise information about their experience.
What’s more, you can share a specific recording including timestamps and notes with anyone you need to. That’s how you can show the other teams in your company where the bottlenecks are in order to make their work easier.
Is my site accessible?
Accessibility may be a slightly different topic than pain points and bottlenecks, as it concerns groups with specific needs. Sometimes your design might not be accessible for people using tablets, in other situations it might be difficult to use for people with dyslexia or other conditions.
Although we are talking here about conversion, accessibility is at the core of every good design and should be a feature of all projects.
Smartlook solution: breakout tables and event analytics.
Breakout tables help you to segment event data by user location, system, or device. That’s how you can check if your conversion rate is comparable across different segments, and if not to look for the reasons.
Event analytics lets you learn how often a given problem occurs and look it up in your session recordings.
Are there any conversion patterns in my customers’ behavior?
User behavior analytics lets you spot the actions that characterize those customers who are likely to convert. Maybe it’s usually during the fourth visit when they make up their mind? Or they visit a certain set of pages? Learning those details can help you with optimizing your conversion rate, as well as nudging those customers that are close to making a purchase.
Smartlook solution: session recordings and events.
To learn more about your customer behavior and spot some patterns, you can use session recordings and events features in Smartlook. You can sort the recordings by what happened during them – for example, watching those when a user finished their purchase and then those when a user made it far but ultimately abandoned their cart. If you spot an interesting event, add it to your custom events list and search for it in different recordings automatically.
We’ll cover the security of your customers’ data later on, but don’t worry – all their sensitive data like credit card details, etc., are hidden on the recording.
What solution works best for boosting conversion?
When you implement changes, user behavior analytics help you make a quick assessment of their impact. Whether you want to compare historical data or a different customer journey path, heat maps and funnels are there to give you a quick overview.
Smartlook solution: heat map analytics and funnels.
When you change your Call-to-Action button, move some elements above the fold line, or try to direct users’ attention to certain sections, a heat map is there to show you the results. It helps you notice which part of your site catches the average user’s eye, and what they miss.
Smartlook also helps you with testing new features. You can set up two separate funnels: one that includes the use of a new feature or option, and another without it. That’s how you can evaluate if your users adopt new possibilities and their impact on conversion.
How can I divide my customers into segments?
The key to working on your conversion rate is to understand your customers’ needs, and creating appropriate segments can help you gain more precision. That’s how you can observe if your conversion rate differs between various customer segments and thus prepare specific actions to improve it.
Smartlook solution: advanced filtering.
You can set up custom, advanced filters to display specific session recordings. Choose the device, OS, location, or UTM tags. Set specific URLs that were visited. Look for the exact text that was typed or events that occured. You can translate virtually any segment into filters and save your search to access it whenever you need.
How can I take care of the security of my customers’ data?
Data safety is crucial for every business, but it’s a top priority when it comes to ecommerce and payments. No doubt you double-check any tool you use.
Smartlook Solution: Smartlook provides you with tools to minimize personal data collected through session replays.
At Smartlook, we take data privacy issues very seriously. We use state-of-the-art security protocols and infrastructure. We also process data only within the scope that’s permitted by legal regulations and by our users, so you have total control over what happens to your business data.
We also never record any sensitive data of your customers, like passwords or bank account numbers. In recordings, you’ll see such information masked. You can also connect via our API to get full customization of sensitive data masking.
Conclusions
When working on your ecommerce conversion rate, you may spot several areas where you can excel and improve your results. How to organize your process? To recap, let’s mention a few points:
- Set priorities
When you identify what aspects of your business should be improved to boost your conversion rate, prepare a clear priority list. This will help you focus on the most important points. Look for low-hanging fruit, as they will give you tangible impact. Later on, you can focus your attention on fine-tuning the conversion rate. - Think about iterations
Adopting the mindset of continuous improvement will help you achieve a steady growth of your conversion rate. Don’t try to master each area before you move on to another. To get better results, set your goals to develop each one to a certain point, and then move on to work on another aspect of your conversion rate. Later on, just start the cycle again. - Assess your progress
Don’t forget to evaluate your progress and the impact of your changes. Analytics tools will also come in handy also at this stage, giving you data to work with later. - Make decisions based on data
Finish each process by making good use of the data you have gathered. This will help you make better decisions and learn from your actions. Also, data speaks for itself and will help you gain additional necessary resources to optimize your conversion rate.
Now, it’s time to take action! Where will you start?