Throughout this article, we’ll explore 9 of the most crucial metrics for measuring mobile app user acquisition, from downloads and CTR to Return on ad spend (ROAS). By analyzing these metrics, your marketing team will be able to determine whether your acquisition strategy is working or if it needs to be adjusted.
We’ll begin by defining app user acquisition and then move on to key acquisition metrics.
What is mobile user acquisition?
Mobile user acquisition is an important aspect of mobile app marketing. It’s what brings new users to mobile apps and games, which is crucial for the growth and success of any business.
The main goal of mobile user acquisition is to drive traffic to app store listings and encourage users to install and engage with apps or games. There are various strategies and tactics that can be used to achieve this, such as ASO, app store advertising, social media, influencer marketing, and email marketing, among others.
With growing competition in the app market, it’s essential to have a well-planned user acquisition strategy to stand out from the competition. However, to ensure your mobile acquisition strategy is effective, you’ll need to track key acquisition metrics. The sooner you identify your acquisition pain points, the sooner you can adjust your strategy and achieve your goals.
Here’s a list of the most essential mobile acquisition metrics that you need to pay attention to:
- App installs
- App store conversion rates
- Organic & non-organic install split
- App User Acquisition Costs
- Return on ad spend (ROAS)
- Customer lifetime value (cLTV)
- Uninstall rate
Let’s take a more detailed look at each of these metrics.
1. App Installs
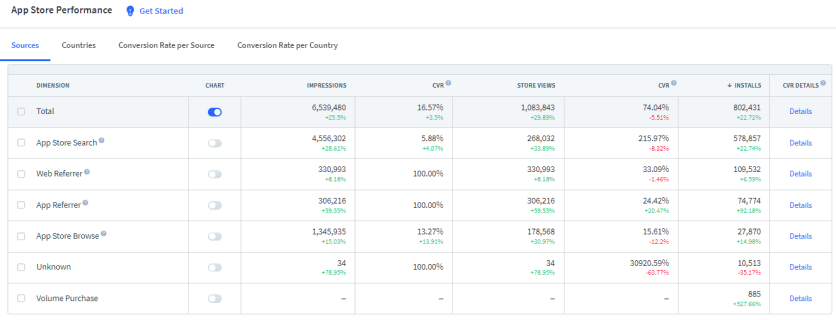
To see the growth rate of your acquisition numbers, you’ll need to consider one of the most essential metrics – your app’s install count across various platforms and channels. To attribute new users in a more convenient way, consider using an attribution provider to help distinguish organic downloads (users finding your app naturally) from paid downloads (users finding your app through ads or marketing).
You can see the install number in your app console (Google Play Console or App Store Connect) or use tools like App Radar to track the installs by source and country.

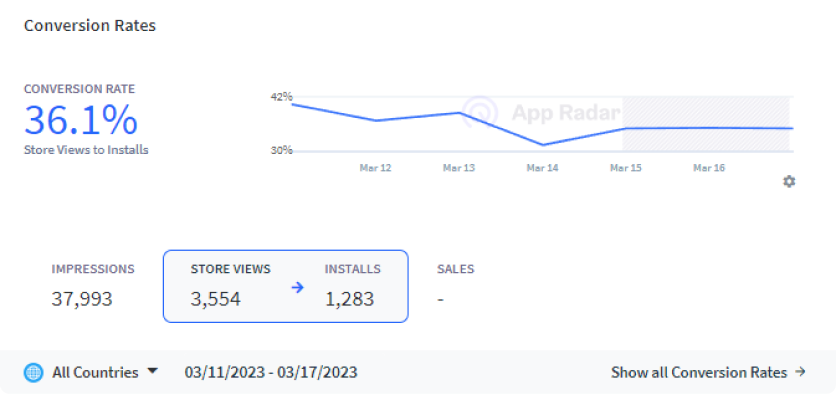
2. App store conversion rates
To pinpoint the stage of user experience that requires optimization, you’ll need to track your app store conversion rates. If your CVR from Impressions to Store Views is low, consider testing another set of keywords or your app icon and/or name. If you have a high CVR from impressions to Store Views but a low CVR from Store Views to installs, there’s a good chance your app store listing is not convincing enough. In this case, try a different set of screenshots and a more actionable preview video that showcases your app. You should also try optimizing your app description by highlighting benefits.

3. Organic & non-organic install split
To get a better understanding of how your app is being installed, it’s important to look at the split between paid and organic installs. This will help you identify which channels need to be optimized, including how you can make the most of your marketing budget.
You can calculate the split by dividing the total number of non-organic installs over a defined period by the total number of installs during the same period. To make your acquisition analysis even more accurate, calculate organic & non-organic installs split by different locations. This way, you can identify which channels work best on a specific local and put your effort into the emerging channels and countries.
4. App User Acquisition Cost
The cost of acquiring new users, also known as customer acquisition cost (CAC), is a key metric for measuring the success of your user acquisition campaigns. By calculating the CAC for each campaign, you can see which is the most effective in terms of cost efficiency. For example, if you spend $1,000 on user acquisition efforts for a Black Friday campaign and obtain 100 users, then your CAC is $10 per user.
Remember that your main goal as an app marketer is to keep your CAC as low as possible. One method of decreasing CAC is by obtaining users organically without relying on paid methods. But keep in mind that solely growing an app with organic marketing efforts takes much more time.
5. Return on ad spend (ROAS)
If you’re looking to acquire new customers through paid acquisition, you’ll want to focus on your return on ad spend (ROAS). This metric is calculated by dividing your total revenue by your attributed ad spend. For example, if an ad campaign costs $10 per paying customer and generates $15 in revenue per paying customer within 90 days, your 90-Day ROAS would be $5 per customer.
While a $5 90-Day ROAS may sound like an easy target to hit, it can actually be quite challenging to achieve. The ideal payback period and expected return depend on factors such as app category, business goals, and app marketing channel(s) involved.
6. Customer lifetime value (cLTV)
Custom lifetime value measures how much value each customer brings to your business. This metric is more relevant for subscription-based apps but can also be considered by other mobile app owners. In tracking this metric, you should be looking to either increase your cLTV over time (each individual user becomes more valuable to your business over time) or the number of new users (which balances out decreases in cLTV).
CLTV is calculated by multiplying your average revenue over a given period per customer (for example, monthly subscription cost) by how long users stay subscribed. For example, if your monthly subscription cost is $10, and users typically stay subscribed for 2 years, then the cLTV is $10 x 24 months = $240. By understanding cLTV, businesses can ensure they are making the most of their customer relationships and maximizing their profits.
7. Uninstall rate
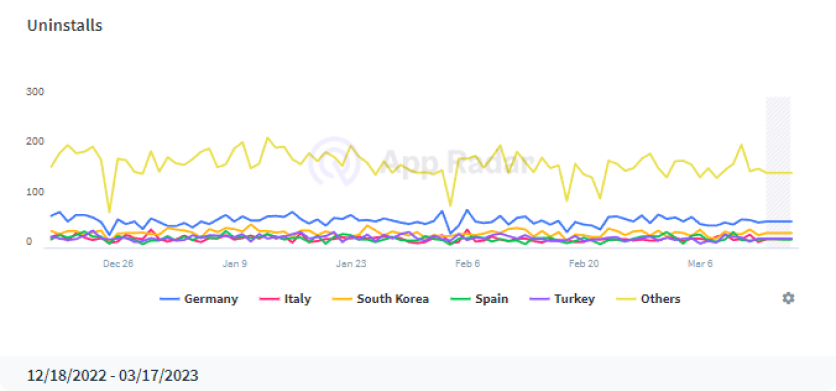
When you compare your uninstall rate against other measures, you’ll get a quick indication of which acquisition channels are providing high-quality users. A high uninstall rate might mean that something is wrong with your app or onboarding process. It could also be an indication that your marketing efforts don’t match user expectations. In other words, you acquired users that tend to churn very quickly.
To calculate the uninstall rate, you need to divide the total number of uninstalls by the total number of installs over a set period of time. Also, be sure to analyze the uninstall rate by country. This will tell you where your strategy is working and where you acquired low-quality users.

Smartlook helps you fight high uninstall rates by providing insights into user behavior and allowing you to identify pain points and areas of improvement in your app.
Session recordings: Smartlook allows you to record and replay user sessions, giving you a firsthand look at how users interact with your app. This can help you identify any usability issues or areas where users may be experiencing frustration.
Heatmaps: These show you where users are clicking and scrolling in your app, allowing you to see which areas are getting the most attention and which are being ignored. This helps you optimize your design and layout for better user engagement.
Crash Reports: An app’s stability is closely related to high uninstall rates. It’s no secret that frequent crashes negatively affect the user experience. Smartlook Crash Reports allows you to view recordings of the moments leading up to a crash. Save countless hours of time with additional reproduction and reporting.
In short, by using Smartlook to gain insight into user behavior and identify pain points, you can make targeted adjustments to your app or website and reduce the likelihood of users uninstalling.
Takeaways
There are many different ways to measure how your mobile user acquisition strategy is performing. That said, don’t overwhelm yourself with dozens of numbers. With the right acquisition metrics in place, you can ensure that you don’t miss an opportunity to acquire more mobile users and grow your business.
Keeping track of these 7 metrics allows you to make adjustments to your mobile acquisition strategy as needed so you can achieve the best possible return on your investment. Track these metrics closely, and use them to maximize your user acquisition efforts to knock your mobile acquisition goals out of the park.


