Funnel drop-offs — the moment when users abandon a conversion process on a website or mobile application — often indicate areas where users are experiencing problems with your product. Finding those drop-offs and fixing the problems that cause them can be a great way to improve your conversion rate.
However, most tools for finding funnel drop-offs have two big limitations:
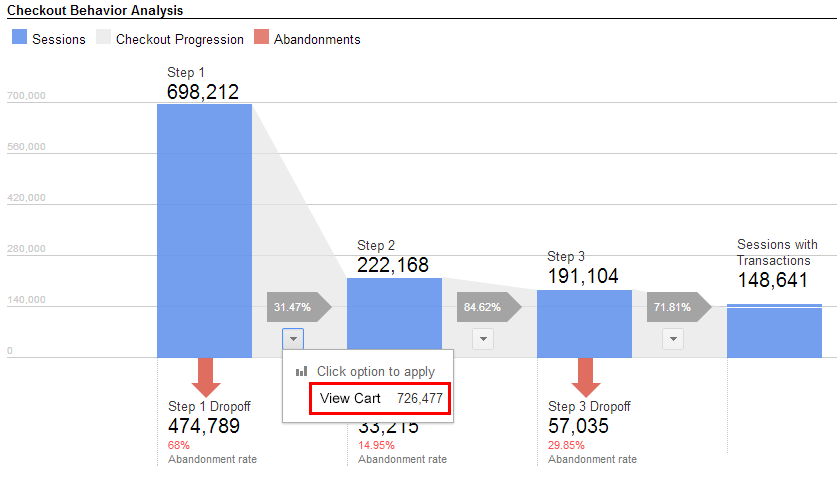
- They don’t tell you why visitors dropped off. For example, it’s easy to visualize your funnels with Google Analytics and identify the pages where most users fall off (as in the screenshot below). But how do you know what caused those drop-offs? To get that information, some people combine Google Analytics with tools like Hotjar for screen recordings and heatmaps. Looking for drop-offs this way is slow and painful because you often have to watch hundreds of recordings to find one that answers your question.
- Gathering enough data for new funnels requires a lot of time and website traffic. With most analytics tools, you have to define a funnel and then wait for new website traffic before you can make statistically significant conclusions. During that time, drop-offs remain undetected, meaning you’re missing out on potential revenue.
In this guide, we’ll show you how to avoid these issues with Smartlook, our analytics tool for websites and mobile apps, which pairs funnel analysis with always-on screen recordings so you can immediately find drop-offs, even retroactively.
With this process, you’ll be able to quickly find drop-offs that affect your revenue and, more importantly, see why they happened.
Let’s define a funnel first
A funnel is a path that a user goes through before performing a desired action, such as a purchase or signing up for a service. This conversion path consists of multiple stages — points that mark the user’s progress through the funnel.
A drop-off point occurs the moment a user abandons a path. Identifying these points provides valuable insight into user behavior and allows you to develop and implement targeted strategies to reduce abandonment rates and boost conversions.
There’s no one-size-fits-all approach when it comes to building a funnel and addressing drop-offs, mainly because there are multiple types of funnels. The most common are:
- Product launch funnels
- Email subscription funnels
- Application funnels
- Demo funnels
- Onboarding funnels
- Review funnels
- Upsell funnels
For instance, while an onboarding funnel may benefit from additional steps and comprehensive information, application funnels that aim to capture and qualify leads should be as straightforward as possible.
How to calculate the drop-off rate
Before you start optimizing your funnel, you need to ask yourself a simple question. Is there anything wrong with your drop-off rate at all?
To answer this question, you’ll need to set up tracking for your funnel(s):
1. Map out your main paths to conversion in your web analytics tool if you haven’t done so yet. In Smartlook, just go to the Funnel section and create a new funnel for each path.
2. Identify the stages of each path, from the initial point of user entry to the ultimate conversion goal. For each stage, define an event in Smartlook Funnels. You need to create events before creating a new funnel.
3. Save your funnel(s) and wait until historic data accumulates.
4. Calculate drop-off rates per stage. A tool like Smartlook will track the number of users entering your funnel at the initial stage and the number of users progressing through each subsequent stage and calculate drop-off rates for you.
5. Compare your drop-offs at each stage to identify critical points where users are abandoning the funnel. A significantly high drop-off rate at a specific stage indicates a potential issue that needs attention.
6. Consider contextual factors — sudden changes in user behavior might be influenced by external factors, like seasonality, which should be considered during the analysis.
If the initial investigation reveals issues in funnel performance — that aren’t caused by external factors — you can move on to deeper analysis.
The impact of funnel drop-offs on your business
Obviously, drop-offs are bad. They hurt your conversions and prevent you from reaching your revenue objectives. But there’s more to it.
Failing to understand your drop-offs can lead to misguided marketing strategies, resulting in a product offering that’s entirely wrong.
To avoid this, the first question you should ask yourself when you spot a spike in drop-offs is: “What’s the reason behind it?”
Although it’s tempting to immediately make changes to your funnel without digging deep into the data, it’s not recommended. You need to get to the reason behind it first. This is what we’re going to help you with in the next sections.
Why is my conversion rate dropping?
Knowing a funnel’s drop-off rate isn’t very useful by itself. But when you understand why someone dropped off, you can optimize the user journey and make changes that may increase conversions.
Let’s say we’re looking at the flow between clicking the “Pay Now” button and the “Thank You” page of an ecommerce store. In Smartlook, you can create such a funnel with two events:
- Event 1: Users click on the “Pay Now” button (you can select the button with our no-code picker to define the event).
- Event 2: Users land on the “Thank You” page (visited URL event).
In theory, there shouldn’t be drop-offs between these two steps — people who picked an item and entered their credit card information clearly want to buy. In reality, you can often find drop-offs at this stage.
For example, this screenshot of Smartlook shows a checkout funnel with a 16.41% drop-off rate between these two events.
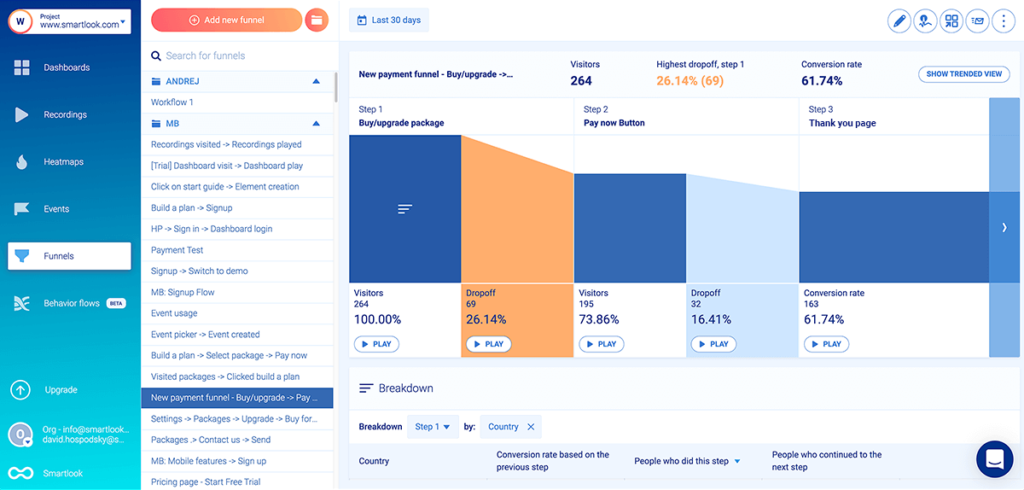
This is where screen recordings shine. By clicking the “Play” button underneath each step of the funnel, you can go directly to the screen recordings of all the visitors who dropped off at that stage. This lets you see the experience and behavior of those 16.41% of users without sifting through all other recordings of people who went through the same funnel.
While we’re on the topic of efficiency and time-savings, let’s see how Smartlook avoids the second limitation we mentioned, i.e., the time it takes to collect enough data for new funnels.
Historical data: Finding drop-offs in new funnels without waiting for traffic
For most websites, it takes several weeks to get enough funnel traffic to make statistically significant conclusions. And with most analytics tools, you have to go through this waiting period for every new funnel. During that time, you might be missing out on conversions and consequently, revenue.
To avoid this issue, Smartlook can take your historical data and turn it into insights, screen recordings, and heatmaps that you can analyze retroactively.
Here’s how:
After you install the Smartlook snippet, Smartlook starts collecting every user interaction on your website in the background via always-on screen recordings. That’s why when you define a new funnel, it automatically gets populated with historical data, as far back as your data retention plan goes.
As a result, you can immediately locate drop-off points and start optimizing your funnel, without waiting for new traffic. This feature also comes in handy if you want to add a step to an existing funnel, as it only takes a few clicks to add the step.
Now, let’s see how you can create and monitor funnels in Smartlook.
How to create essential funnels and monitor sharp drop-offs
Finding a website’s overall drop-off rate (and conversely, its overall conversion rate) is simple. You just need to know how many people visited the site and how many of them converted.
But that’s not particularly useful since users go through a lot of steps in their journey. Each step can push them further along the conversion path or cause a drop-off. That’s why it’s better to look for drop-offs between consecutive steps inside each funnel, like in the examples below.
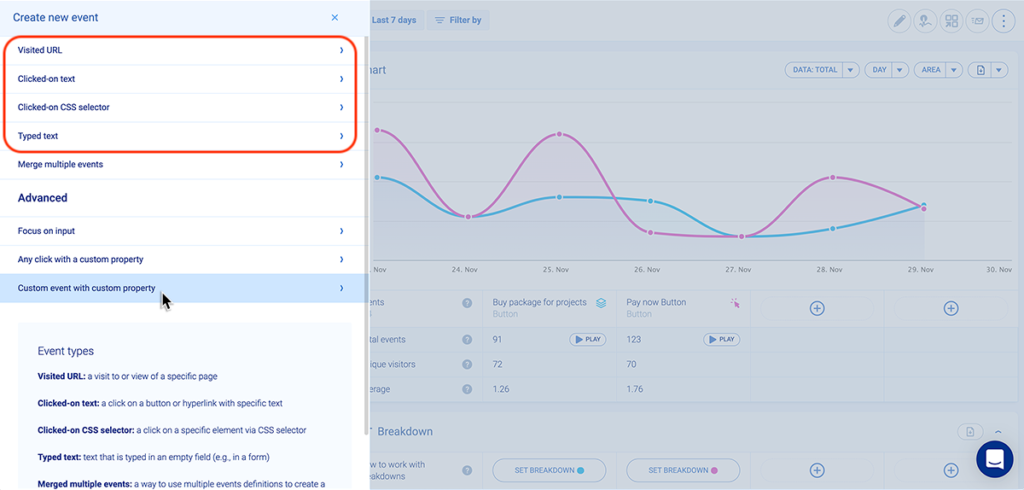
Before we dive in, keep in mind that the funnels shown here consist of standard events (like URL visits, button clicks, and text inputs), which you can set up in Smartlook without any programming.
When you have your events, simply put them in the required order to create a funnel.
Once you do that, Smartlook automatically creates the funnel visualization, like in the GIF below.
Also, for each step of the funnel, Smartlook can break down users by country, device, operating system, and other criteria.
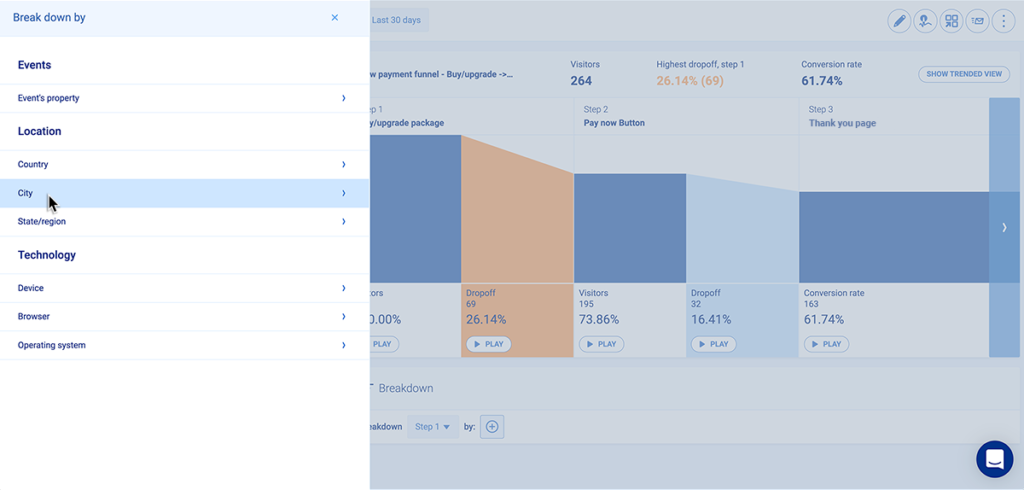
This lets you easily identify issues that are specific to a category of users.
The checkout funnel
The benchmark shopping cart abandonment rate in Europe and the U.S. is around 80%. There’s no question that drop-offs during the checkout process pose a serious threat to your conversion strategy.
Here’s how you can create a funnel in Smartlook that tracks your users’ entire checkout process, from the homepage, through adding an item to the cart, to clicking on “Pay Now” and getting a confirmation of purchase:
- Event 1: A homepage visitor clicks on the shop (select the button with our no-code picker to define the event).
- Event 2: The visitor searches for an item (typed text).
- Event 3: The visitor clicks “Add to cart” (clicked on a CSS selector).
- Event 4: They click on the “Pay Now” button (clicked on text).
- Event 5: They land on the “Thank you” page (visited URL).
Many ecommerce sites will see a large drop-off between users who add an item to the shopping cart and users who purchase. To further dig into why customers who were interested in an item didn’t buy, you can add more events between steps 3 and 4.
You could create separate events for everything that happens on the checkout page, like selecting shipping options, adding discount codes, or filling in billing info. One of our customers did this and discovered that customers were abandoning their carts because their shipping costs were much higher than expected. After they lowered their shipping rates, sales increased by 161%.
While each step in this funnel can reveal user experience issues that give you clues about why people aren’t converting, it’s especially vital to investigate any drop-off between events 4 and 5. Anyone who clicked “Pay now” and didn’t land on the “Thank you” page probably encountered a technical error.
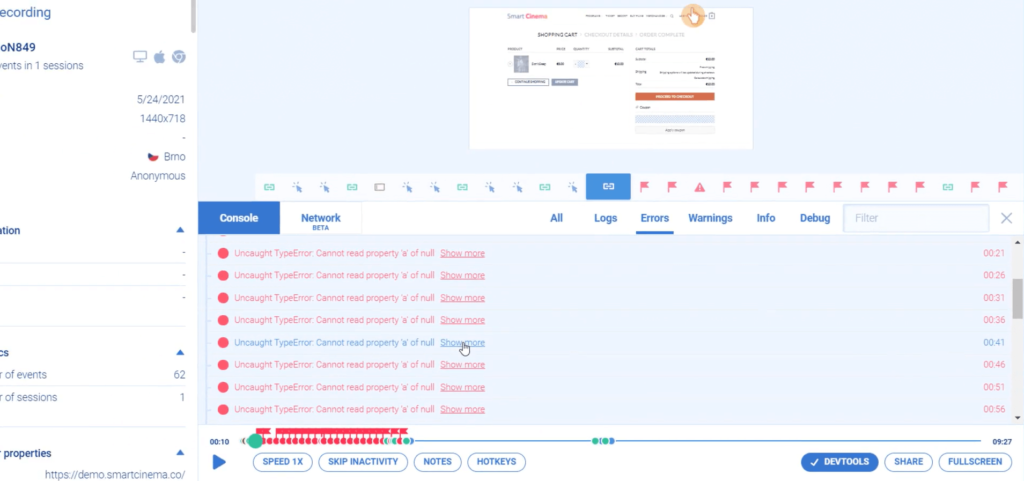
If you find drop-offs here, you need to dig into the recordings and see what’s going on. There are two common problems you might find:
- JavaScript errors. Smartlook automatically detects those and shows them in DevTools, so you can quickly send them to your dev team.
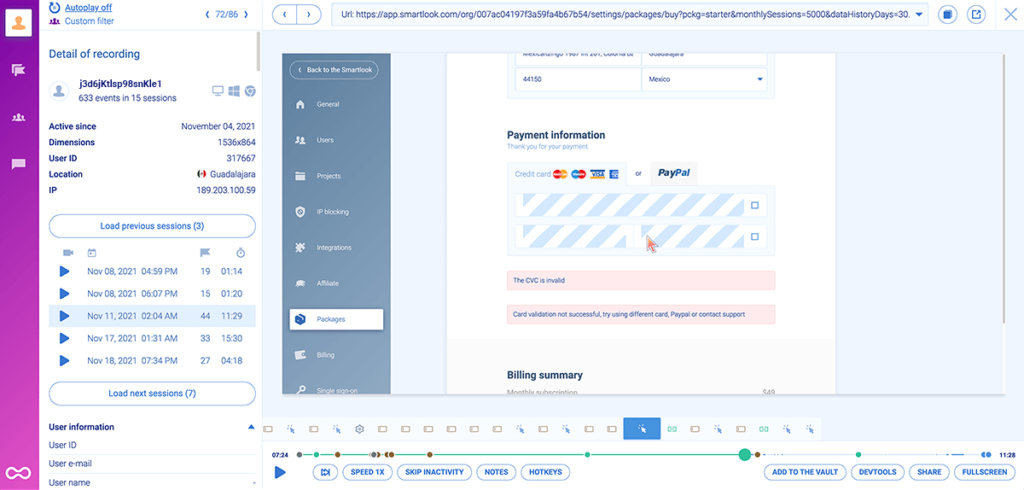
- Problems with the payment method or payment provider. Maybe some users entered the wrong card info, or your payment provider couldn’t accept their payment. Again, that’s easily identifiable with screen recordings, as shown in the screenshot below.
Whatever the case, you want to get on this right away. If left unchecked, these problems can add up to thousands of dollars in lost revenue.
Let’s say your average order is $25 a day. If technical issues prevent just one user from checking out per day, that adds up to $9,125 of lost revenue every year. Imagine if you’re selling expensive items or subscription plans — the losses can easily be in the hundreds of thousands. Not to mention, the experience of trying to buy something unsuccessfully is infuriating.
Email newsletter subscriptions
A common conversion funnel that marketers care about maps the journey from reading a blog post to subscribing to a mailing list.
If you’re trying to grow your email base, you likely have a form where people can leave their email and a call-to-action (CTA) button to subscribe to your newsletter.
Here’s what the funnel optimization process might look like for that flow:
- Event 1: Users arrive on the landing page (visited URL containing “blog”).
- Event 2: They fill out the form field for entering their email address (typed text containing the @ symbol.).
- Event 3: Users click the CTA button (select the button with our no-code picker).
- Event 4: They get a confirmation or arrive on a “Thank you” page (visited URL).
If there’s a drop-off between events 1 and 2, you might want to analyze which areas of your pages garner the most eyeballs with Smartlook’s heatmaps. Once you know that, you can try increasing the conversion rate by moving your form and CTA to more visible areas.
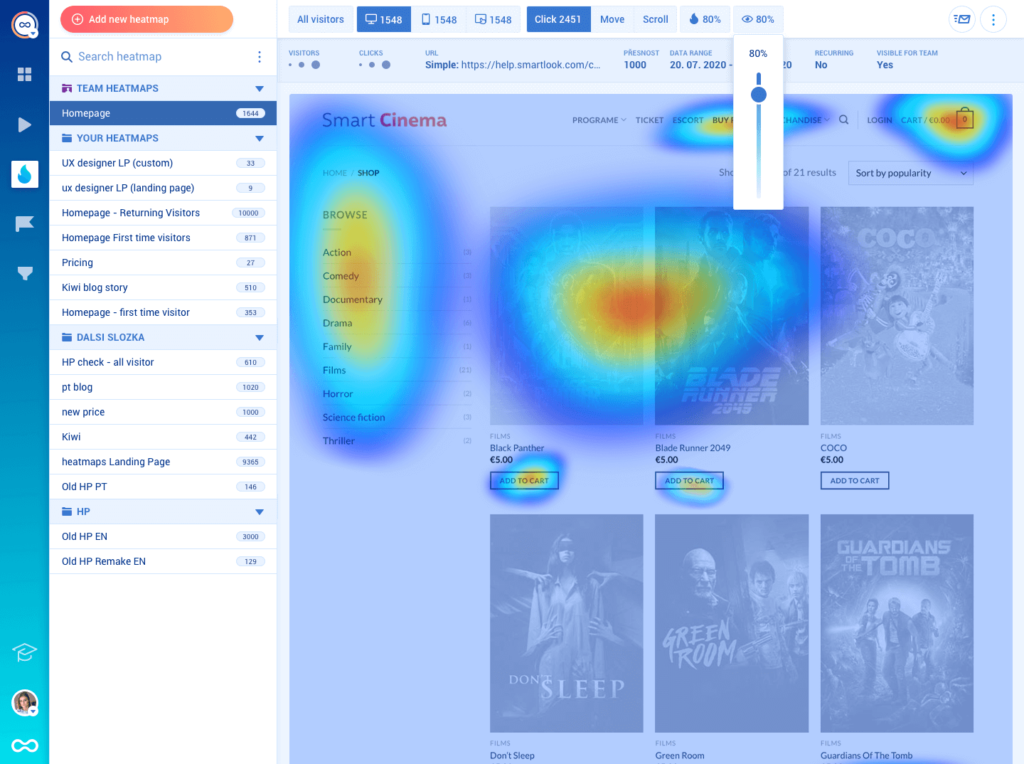
After updating the design, you can also create a new heatmap and contrast the user behavior with the old one, just by changing the date range.
It’s also crucial to look for drop-offs between steps 2 and 3, since in theory, a user who types in an email should always click the subscribe button. In reality, technical issues can prevent some users from subscribing, like false warnings that their email is invalid. Also, some users may get distracted by other elements on the page and forget to subscribe.
Similarly, there should be no drop-offs between events 3 and 4. Users who click on the button after entering a valid email should get a confirmation or land on the “Thank you” page.
In both cases, screen recordings can help you quickly learn why these unlikely drop-offs occurred.
Mobile and SaaS application onboarding tutorials
Most mobile apps and SaaS products include a product tutorial for first-time users, but many users don’t complete the tutorial during their free trial. This is a big challenge for product managers since it makes it difficult to convert people from free to paid.
By mapping the entire tutorial to events in Smartlook (you’ll need a developer because you can only track interactions on mobile devices with custom events), you can find user behavior insights by watching session replays of people who quit the tutorial early.
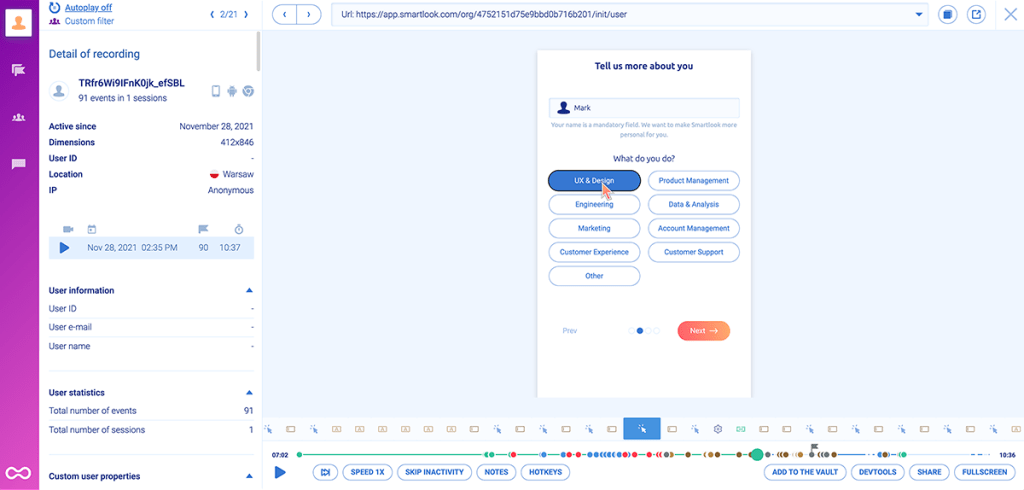
The image above shows a moment during a Smartlook screen recording of a mobile user’s journey while navigating an onboarding sequence. During the roughly 10-minute session, the user completed 91 events.
Let’s say the overall drop-off rate for this funnel is 90%. That might make you consider redesigning or removing the entire tutorial. But if the average user completes almost 100 events before quitting, there’s probably some value in the tutorial.
If you look at the drop-off rate between each step, you might learn that the sharpest drop-off happens near the end of the tutorial. Perhaps there’s a technical error happening between those steps, or the users simply think they’ve learned everything they need at that point. Again, to get a better idea of the user experience and make more informed decisions, you want to analyze the drop-offs between steps of the funnel, not just the overall drop-off rate.
How to reduce drop-off rates
You’ve got the data, what’s next? Here are a few best practices that will help you reduce drop-offs:
A/B test your funnels
After performing a drop-off analysis, you’ll have the insight required to create hypotheses regarding the reasons behind high drop-offs. With A/B testing, you can validate your ideas before releasing full-scale changes.
A/B testing funnels involves creating two versions (Funnel A and Funnel B) and displaying them to equal audience segments to determine which results in lower drop-offs.
While traditional A/B tests are limited to testing elements within a single page, advanced software like Optimizely allows you to set up multi-page (or funnel) tests. These multi-page experiments involve making changes to more than one page within the flow to evaluate the overall impact of optimizations on the user experience.
To better understand how users respond to changes, integrate Optimizely with Smartlook (your web analytics tool) to look into user sessions behind the test metrics.
Watch out for crashes and bugs
Poor design isn’t the only reason behind high drop-offs. If you’ve built app funnels, unexpected crashes and bugs can hurt them, too.
Smartlook offers real-time monitoring for performance issues within iOS and Android apps and delivers crash reports to easily detect problems before they impact the UX — trace crashes and identify the reasons behind them.
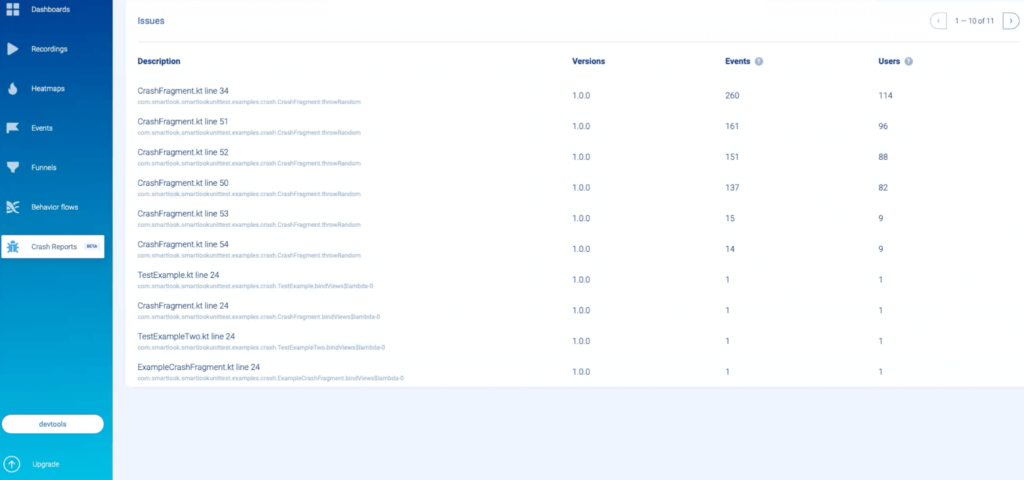
Furthermore, you can review all sessions where a crash occurred and get more context. No need to reproduce crashes manually.
Set up alerts for sharp drop-offs
You should always monitor your essential funnels (those closest to a purchase event or another business goal) and be the first to learn if there’s a sharp drop-off.
Smartlook has a special feature for that, called anomalies. Once you set up an anomaly for an event or funnel, you’ll get alerts in the app or via email whenever sharp drop-offs (or increases) happen. These alerts can be triggered in two ways:
- By a conversion rate dropping outside of a defined range, e.g., below 2%.
- By a percentage change from your baseline, e.g., 50% lower than normal.
When anomalies are set up, you’re instantly alerted to critical errors, enabling you to address them much faster. If you act on them quickly, these alerts can save you a lot of conversions.
Next steps: Set up Smartlook, define your events, and get started with funnel analytics
We just covered a lot, so here’s how you can put everything into action:
- Sign up for a free 30-day Smartlook trial — no credit card required.
- Install our code snippet by following the instructions in our Help Center. As soon as you do that, Smartlook will start recording everything your visitors do.
- Define events. Again, events are all user interactions that can be measured. You can track standard events (URL visits, button clicks, text inputs, and a few others) without any programming skills, or create custom events with JavaScript to track pretty much anything else.
- Add your events to a funnel. To create a funnel, choose two or more events and put them in the order you believe your users follow.
Finally, if you want a more detailed presentation of Smartlook that’s tailored to your business, schedule a demo with our team.