How our Newborn Quickly Grew into a Serious Analytical Machine
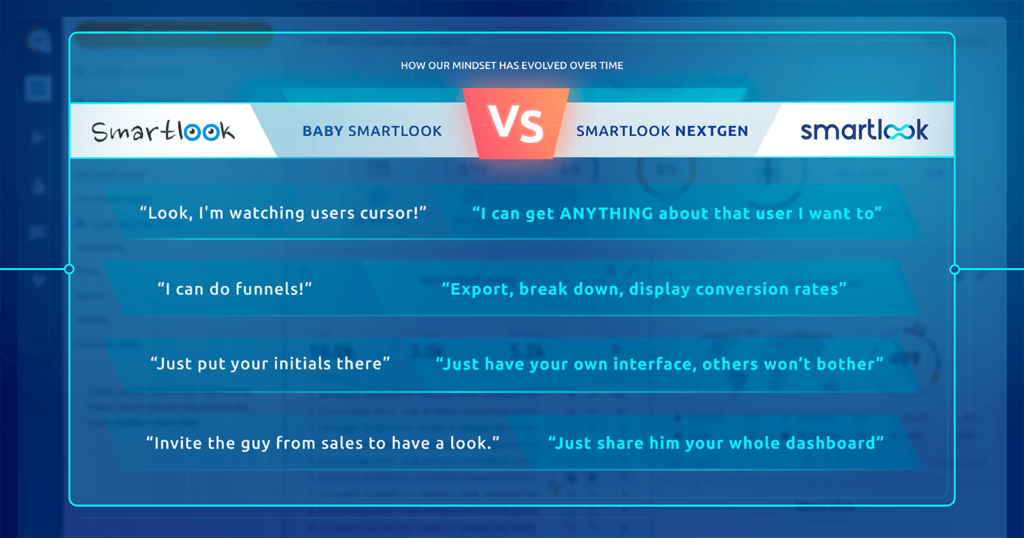
Four years ago, we started Smartlook as a simple free tool. As a humble companion to the all-mighty Google Analytics. We were extremely proud of our newborn baby, though. It could measure things and solve bugs, after all! And more importantly, it allowed your regular marketing Joe to gain more insight into customers without the need of being an analytics expert. On one of the leaflets from that era, you can find the claim:
“Everyone can be an analytic”
Soon after that, our binary baby started to learn new things. How to do automated event tracking. How to create heatmaps. How to export data to other platforms. Suddenly, we started to draw the attention of well-respected companies. UX designers, product managers, sales and marketing people in particular began to be very curious. How could these dedicated experts use Smartlook on an everyday basis? With this kind of audience, Smartlook began to represent a serious project, instead of just a nice-to-have gadget.
We still have our regular marketing Joe who peeks there from time to time only to check some heatmaps and couple of interesting visits. These users were already pretty satisfied with Smartlook as it was. But not those highly specialized experts. No, Sir! They insisted on us growing quickly and providing them with a really deep analysis.
It was no longer about
“Everyone can be an analytic”
But more like
“Serious analytics is not for everyone”
Suddenly, we have to handle enterprise-level companies working in large multinational teams handling enormous amounts of data. Some of them process more than 120 million users which equals up to 300 million sessions! Often, these customers juggle their data from department to department – product management, marketing, sales, development and others. Experts from these departments have very different needs. Also, they save much more data in the system. In the end, we came to the conclusion that we have radically redesigned Smartlook to handle big clients working on high profile projects.
But how can Smartlook handle behemoths of business after only four years of development? After four years, most startups are barely able to stand on their own feet. At that age, very few companies aim that high.
We just had to force our beloved offspring into adulthood. In 2020, it was time to send Smartlook off to boot camp to become a heavy-duty analytical universal machine.
Our developers worked hard to bring Smartlook to the next level in order to be able to handle large teams and big data. It was all worth it. The adult version will contain so many changes that we decided to give it a brand new name – Smartlook NextGen. It is truly the next level in workspace design, functionality and the overall amount of features.
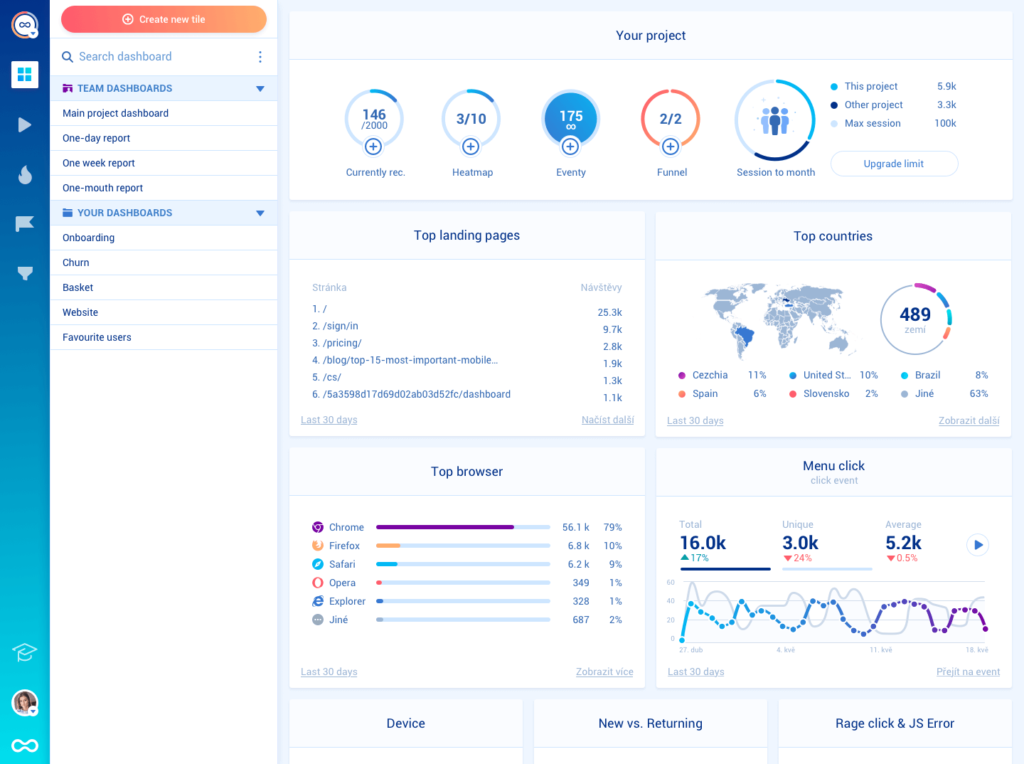
The new version will allow you to read much more data from your project instantly. The NextGen interface was created to give you more insight, more control, while still being easy to use at the same time.
It will also make it possible for big teams to work on the same project in an effective and organised way. Permission system will be able to assign exact roles to every user. That way, it will easily be managed by even very large teams working on one single project without becoming confusing or complicated to use.
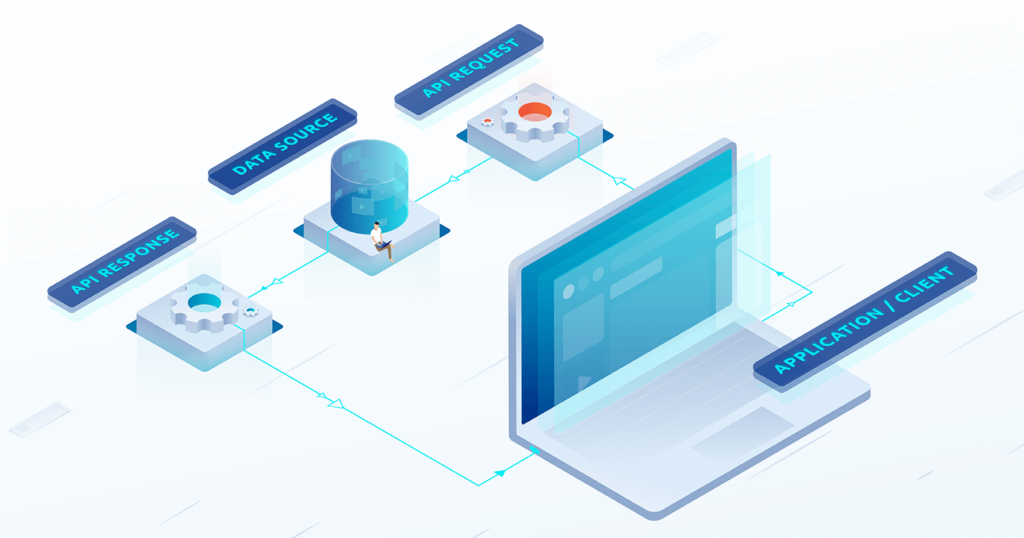
The new API will also allow your company to extract data and send them to an analytical tool of your choice. Just take whatever data you need, no need to open our workspace over and over again. If you need to see funnel conversion rate in your analytical tool, then you are just a few seconds away. Or do you wish to see the occurances of the events? Feel free to export all the data you need via the REST calls. You can now prepare all these exports and kick back while your team members are getting the needed data on their dashboard.
To reflect all those changes, we introduced a new pricing system. Our two new paid packages are called Business and Ultimate.
How our mindset has evolved over time:
As of now, the NextGen version has been launched and is fully functional. Feel free to explore. And when you do, please share with us your feedback, so we can continuously make improvements. For the sake of all users.
We will support the old dashboard until January 11 2021, so our users still have enough time to cope.
Remember last time when Steve from marketing changed parameters of that important funnel? Or when you returned from vacation and couldn´t find your data among tons of new contributions from several departments of your company? Well, that’s gone. Every user will have the option to create their own dashboard. Solved.
Alright, let’s cut the chit chat. You read this article because you want to know what exactly is going on.
Time to muscle up – what can you expect from the full version
The fully customizable workspace is now displaying much more data. But just those you actually want to see
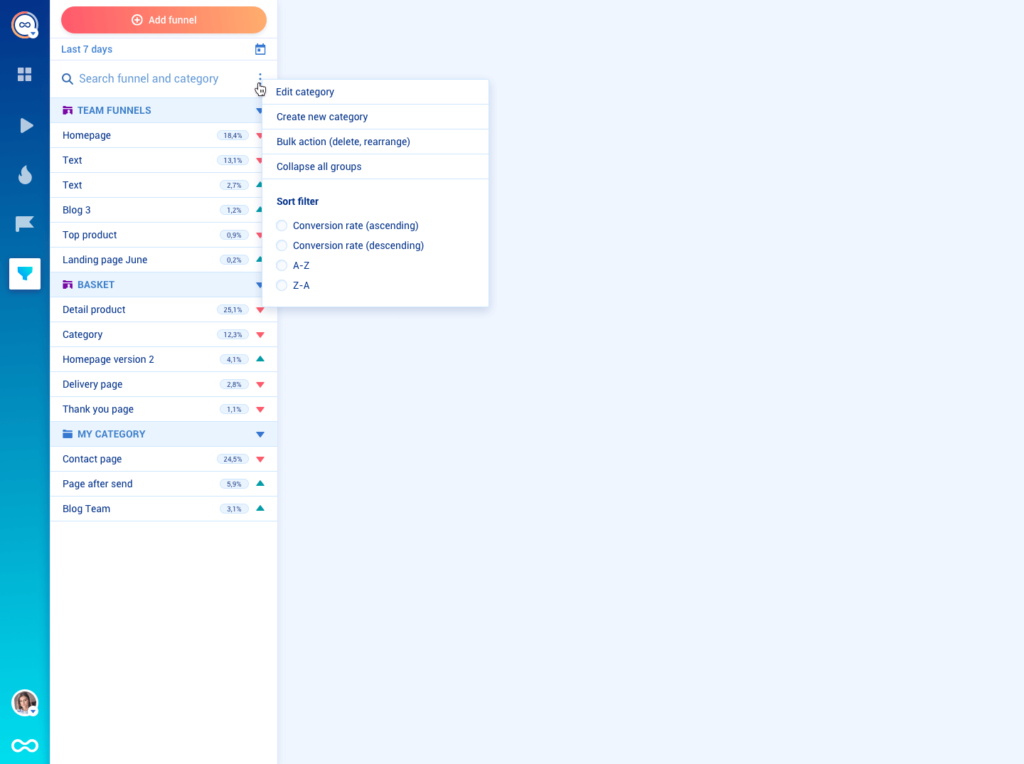
Many users have praised our dashboard for being so straightforward. No doubt about that. With such a plain design, however, come also many disadvantages. Did you ever handle a large project containing many parameters? Then you know how much scrolling and clicking was to just compare a couple of funnels with each other or to find your saved analytics in the first place. That’s why we decided to create a brand new workspace, that is easier to organize even for multiple users and it makes it much easier to access all important data:
Let’s have a closer look at the left side:
The vertical panel will help you organize more analytics at once but also see more data without the need to click anywhere. Take those pesky funnels, for instance. Want to have a quick overview of how they are doing? Percentage on the right will show you conversion rate. And the arrow pointing either up or down is a current trend.
What kind of data is always visible in Smartlook NextGen
- Recordings
All saved segments are now easily accessible.
Intelligent sorting will suggest filters you use the most. - Heatmaps
All heatmaps are now conveniently displayed on the left menu. - Events
Events now allow advanced filtering and even sorting. - Funnels
Conversion ratio in percentage is immediately visible.
Trending of conversion ratio is showing an increase / decrease.
Not only can you watch more analytics in one panel, you can also manipulate more data at once. Bulk actions will allow you to delete or rearrange plenty of data at once. That way you can save time for more important things (like finally come to Brno, Czech Republic and try out our famous plumb liquor – slivovitz).
Every member of your team can organize and label their own data

When you are working on bigger projects in Smartlook, your dashboard gonna be soon filled with all kinds of data. Data for returning visitors. Data for your new landing page. Data for the blog. Data from the sales department. Data from the marketing department. Data from the new guy in your company who just started to learn Smartlook.
Smartlook NextGen is created in order to organize better analytics with your colleagues. Now, you can create folders and independent categories right in the left sidebar. But don’t worry too much about interfering with your colleague’s project. Every user has their own dashboard, so there will never be that ‘Hey, Steve, did you delete that funnel for that shopping cart from last week’ conversation.
On the top of that, there is now an option to divide your team to admins / users. Admin will see maximum data, while your regular marketing Joe won´t be bothered by too many stats.
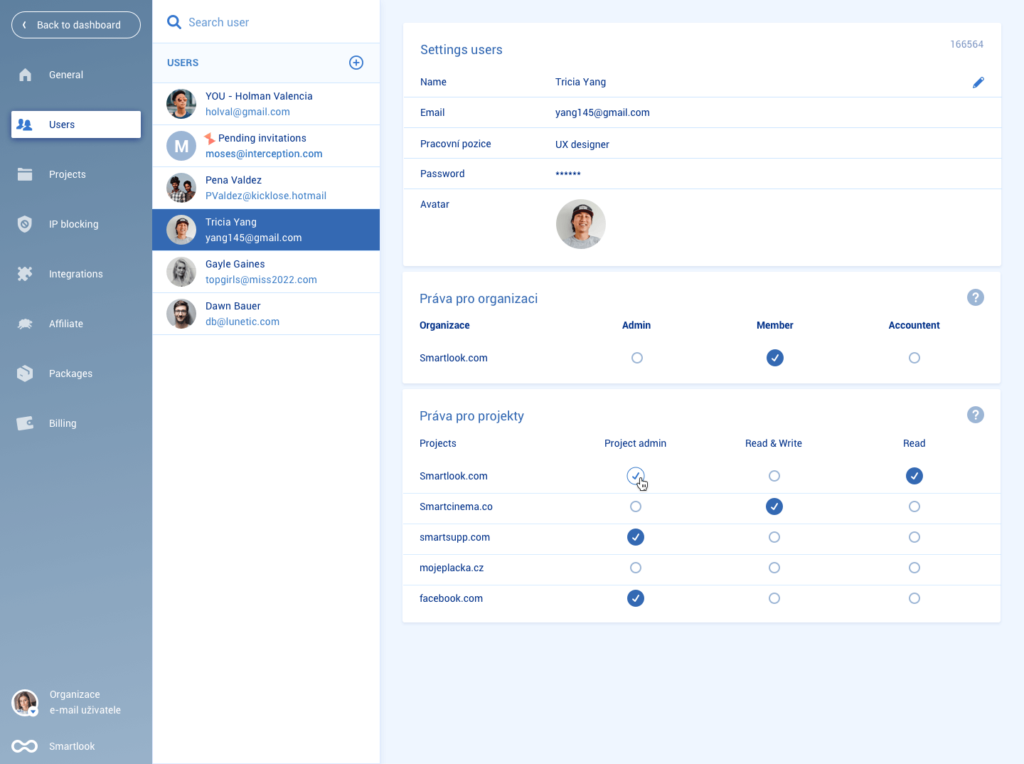
Thanks to the new SAML sign-on authentication, there is no more need for your team to remember any separate login credentials. Any user can just easily log in using SSO login credentials or even access Smartlook from your company’s dashboard.
Not getting the analytics you want? Then integrate NextGen in your system with API
With this feature, we gonna make your IT experts happy. API is a computer interface which will allow integration between Smartlook and other computer systems. This way, your company can build your own analytics using our data and vice versa. First, you need to create an API token which will allow you to authorise Smartlook in your system. Then, you can start to build your own analytics the way your company needs it.
Especially handy when you need for instance:
- Access data in your dashboard
- See funnel conversion in your daily report
- Use visitor journey in your presentation
With REST API, you can use our data within your designated analytical tools:
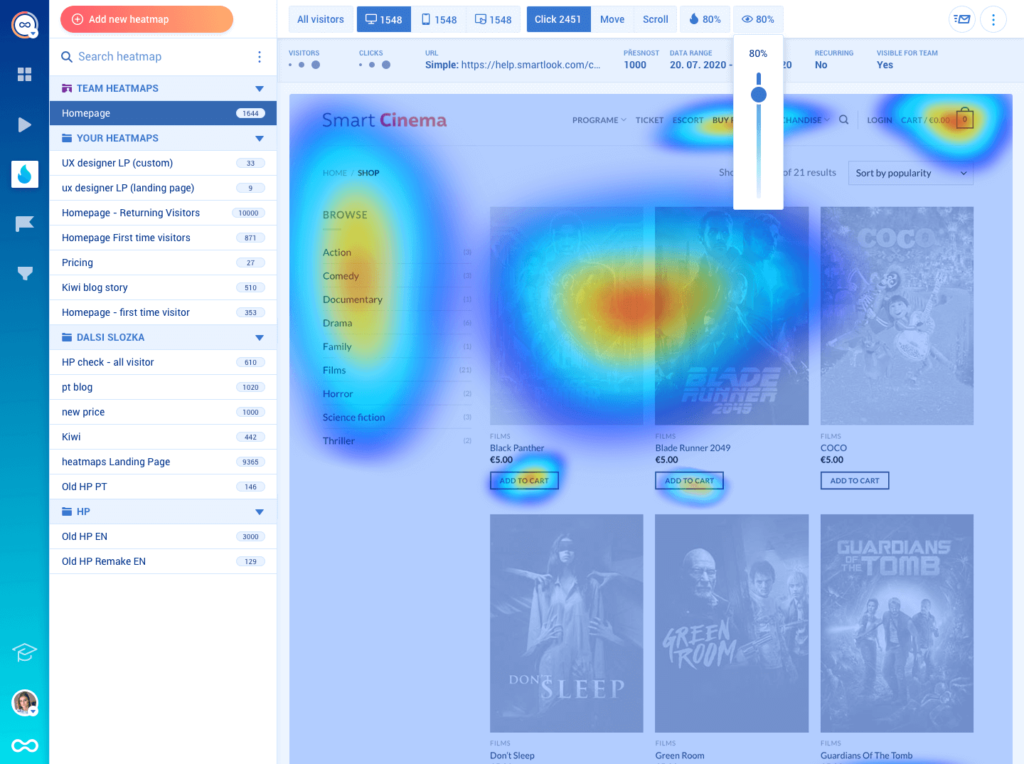
Heatmaps now can take care of themselves, no need to constantly engage
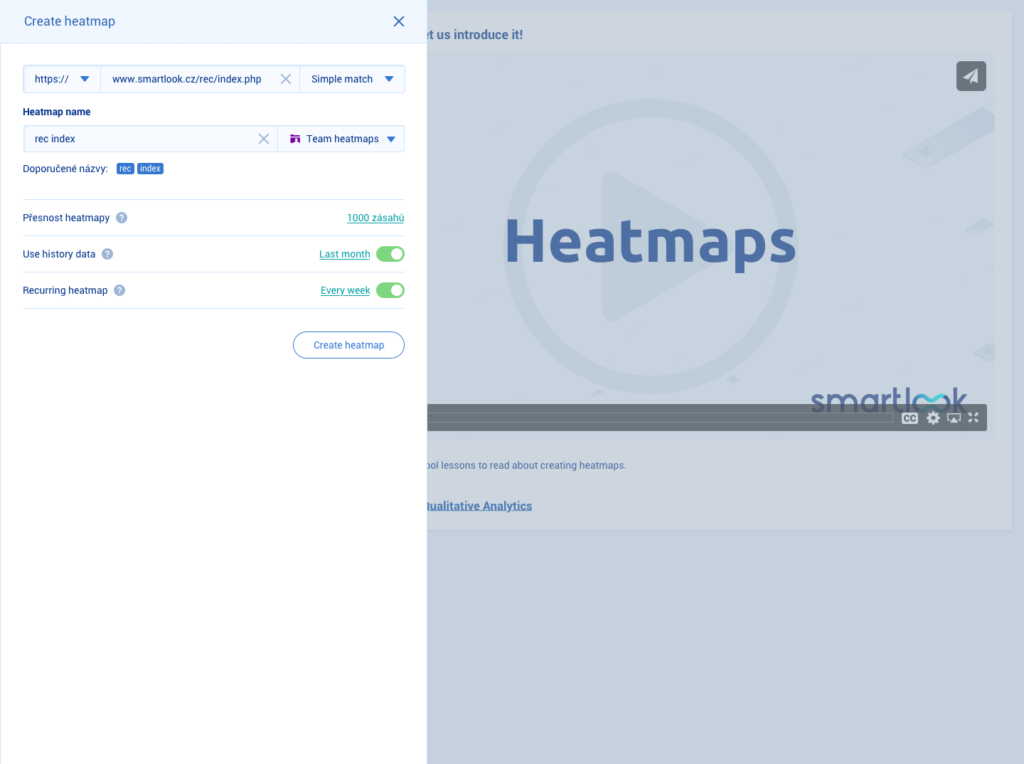
Heatmaps will allow you to spot part of your web or app which is getting the most attention. This can be extremely useful in case people are ignoring some part of your web or app, which is important and you want it to be noticed and clicked-through. But setting up a new heatmap every week or so can be time consuming.
Recurring heatmaps will collect the data automatically dependent on your setting. This will save you time and mental capacity. No need to think about your heatmaps, they will collect data continuously.
The new feature is no brainer. Just press ‚Add new heatmap‘ on the heatmaps tab. Then don´t forget to turn on ‚Recurring heatmap‘ option. Before you confirm your setting, define whatever you want to generate a new heatmap every week or every month. Voilà! Now, Smartlook will generate new, fresh heatmap periodically without you to do anything.
Other than saving your precious time, recurring heatmaps are a great tool how to stash your data for further use. When you have your data for long weeks and months, then you can easily compare your current state with your web’s or app’s history. Especially useful, if you expect some changes in your user experience. Just don’t forget to buy enough data storage.
And if you ever end up stuck with something, the help is just round the…sidebar
When you are starting a feature for the first time, there will be an educational video waiting for you. This way, you can learn the feature even in case you don’t know much about analytics yet.
Still not sure? Now, you can find the question mark icon on the bottom of the left sidebar. This will lead you to our help site featuring educational videos Smartlook School and many useful articles.
Something is still lacking in the new Smartlook? Something sinister has happened? Please, don’t hesitate to talk about it with our customer support team. We appreciate your feedback!