Is it even worth it then? Right from scratch, I will disappoint you by saying there is no universal answer. It depends on the type of your business and your current situation. In this blog post, let me help you to make the right decision. Naturally, we will talk about storing data with Smartlook, but it should also be applicable for any user who is looking at making accurate decisions based on data.
Who will benefit by having older data? And who really needs it?
When buying data for longer than one month, then you’ll probably do it for one of the three reasons:
You want to track returning customers
Depending on the type of your business, your customers use some features of your platform continuously, or they can visit your website sporadically. Examples of such a variety could be
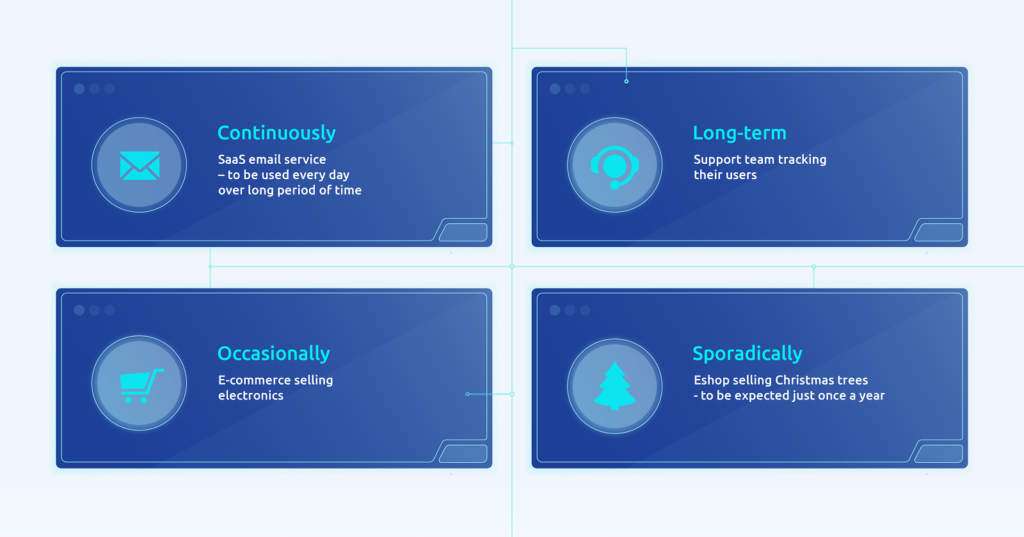
But Christmas tree entrepreneurs aside, most companies will be very focused on the customer retention. That is, are customers using your services repeatedly enough to become loyal customers who bring long-term value. If your churn factor is too high, if there are too many customers never returning to you, then you have a big problem.
By using a longer period of time, you can also eliminate counting your returning visitors wrongly as new visitors. This can happen when evaluation data at the beginning of the new month and not counting visitors at the end of the previous month. On this topic, I recommend reading a very refined and simple analysis from legendary Avinash Kaushik.
You are testing improvements
Maybe your UX designers come up with a promising new wireframe, or maybe your sales department suggest to make a new contact form. You will be very likely glad for the option to compare your older versions with the new one. Did the new design represent a real value or just an expensive nice-to-have non-necessity?
You have to also keep in mind that it takes some time before the dust settles. In other words, your customers need time before they get used to a new feature or design. Then you want to test continuously from launching the new version to following weeks and months.
You are checking your web/app if everything is working fine
You successfully launched your new website or a feature, tested all major design elements, compared results with the old version. Congratulations, the mission succeeded! But don’t also forget to check if everything is working properly from time to time. Maybe you’ll find out after a year or two, that some feature suddenly dropped from being used 2000 times a month to just 400. Such a sudden drop is indicative of something being wrong.
How exactly can you utilise old data in Smartlook
Let’s have a look at the most typical ways you can leverage data older than one month:
Set up and compare historical events
Data are stored automatically in Smartlook. In the free version, they are erased after one month. But if you purchase extended data history, then you can go way back, even up to 12 months.
You can learn in-depth about events and event tracking on our Smartlook School, so here’s just a quick tip:
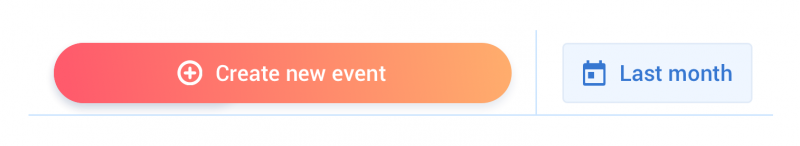
You can choose custom data range via a drop-down menu next to “Create new event button”.
How far back can you go with your events depends on your package…
Use retention tables
Retention tables are a complementary tool to events. But they are essential if you want to track returning customers over a longer period of time. A detailed guide on retention tables was already written by our customer success team leader, I strongly suggest every serious Smartlook user read it. For using retention tables, long data history is crucial, because:
“…longer data history in Smartlook makes your cohort analysis more reliable. That’s because data history determines for how long Smartlook can identify the same user as returning. By default, it’s for 30 days. So anyone who comes back on day 31 will be seen as a new visitor, and it will skew your data…”
Set up retroactive heatmaps
One of the most beloved features in Smartlook is retroactive heatmaps. Basically, you can create a new heatmap using old data, or you can see what people were clicking on in the past. Just start a new heatmap and set up a date in a specific historical date.
Also, in the upcoming “NextGen” version, you will have the option to choose “Recurring heatmaps”, which will save heat maps automatically over time.
The most stereotypical image of people who will benefit having long data storage:
(If you’re one of them, buy more data immediately)
STORY A

Working with a massive amount of data, Mr Big Shot had a hard time preparing an analytic strategy for the next couple of months. The main shopping season was coming quickly, and he needed to grasp three consecutive sales – Black Friday, Christmas, New Year’s Eve.
When he tried to manage this customer analysis last year, most of the data was lost or hard to reach even before Christmas. And it always took the company’s analytics the whole eternity to prepare a report from historical occasions. They were always telling him that their web has too many visitors to compare different pages and different sales in Google Analytics.
One of his junior colleagues suggested that they should try an alternative tool this time. The name “Smartlook” was mentioned. Mr Big Shot never even heard about this company, but it was not a significant expense, so he approved the budget.
Right after the New Year’s sale, a report came to Mr Big Shot’s office. To his satisfaction, they were able to track returning visitors in retention tables and compare, which type of customer (and from where) was staying loyal to the company. It was also extremely useful in testing UX of the new web because, in several months, they were able to differentiate between random events and a solid trend. Data team exported him the whole customer journey in a well arranged way, which was very convenient for his next presentation in front of the investors. During the Black Friday next year, they managed to raise conversion rate by whooping 15%.
STORY B

This seasoned professional was working for a company developing project management tools. Let’s call the software “WorkSmart inc.”. Thanks to WorkSmart, employees in bigger companies could better organise individual workload and measure the effectivity of different teams. UX Guru’s mission was to ensure that this software is easy to understand and intuitive even for very average computer users.
The beta version of WorkSmart toolkit has already been in the open testing phase for two months, and some of the users have been using it ever since. UX Guru would like to compare a feature allowing users to re-use old tasks to save time. When they launched this feature, nobody knew about it. Since then, beta users had enough time to become familiar with the environment and also were blasted by a new onboarding emails and posts. But did they learn how to use it?
UX Guru could send requests to developers, but it always took them at least a week to prepare a report from Google Analytics. This time, he tried to analyse the app by himself using Smartlook.
Without much hassle, UX Guru was able to watch recordings of the latest sessions and compare them to recordings from the first week of testing. Results were not flattering. Most users didn’t understand at all how to “recycle” old tasks and re-wrote them instead. Thanks to this analysis, UX Guru created a different wireframe, much easier to grasp without explaining.
STORY C

Penny is a marketeer working in a European publishing house. One of the most profitable segments of this company represents cookbooks. Penny wanted to start a new project to focus more on selling cookbooks when covid-19 happened. People were staying suddenly more at home, and so they also did have much more time to cook. Cookbooks were selling like hotcakes. How could Penny gather objective data for her new campaign, when this segment was all skewed by the abnormal situation? She knew it would be probably possible in Google Analytics, but that was way beyond her abilities…
Because Penny was clever, she already did buy longer data history when purchasing Smartlook. This way, she could reach older data which were not clouded by the anomalies and could better predict campaign in the distant future. Old data showed that in normal times, people are more interested in titles like “Quick and easy recipes for every day” or “Cooking the easy-way”. With this analysis in hand, she then was able to convince her boss to give a long-term priority to the fast-food category on the website. Penny also recommended her team to stick with short “quick to read” descriptions instead of in-depth lengthy content.