


There are two distinct, and remarkably mind-blowing moments that everyone experiences while they’re reviewing their initial user session replays.
One is excitingly positive, other, rather not so.
The first one I’ll note here as the ‘Wow this is great’ moment. This is an extremely positive moment.. Usually, it’s directly followed with great excitement and optimism as the viewers start to understand that they finally have a tool that allows them to understand why users behave the way they do. The universe of potential blows up in their minds and ideas start to flow like crazy, until the second moment.
The second moment is a grounding one. It’s the ‘Ha, that’s funny, it shouldn’t do that’ moment. At this moment the viewer notices something unexpected, not intended, not programmed to happen. Something that influenced their users to leave the website, churn and break their engagement.
Both moments eventually occur. Always. And both of them are full of actionable insights.
In the first one the viewer is considering all the small tweaks they can make to achieve the full potential and friction-less UX. In the second the user is pushed to seek a solution for the obvious issues present.
We built Smartlook for these actionables – to provide our users with a way to fully understand their users behavior and a direction in building their amazing digital experiences.
And now, we’re pleased to announce that we’re releasing Smartlook’s Devtools.
For all those ‘it-shouldn’t-do-that’ moments
Smartlook’s Devtools are built for discovering, troubleshooting and discovering bugs and issues that occur on your website.
They expand our existing Console that is used to present all the JavaScript errors that get recorded in the end user’s browser.
Onward, Smartlook’s Devtools will incorporate both Console and Network Hooks into one.
Accordingly, you’ll find the Devtools within the session replay player at the sample place where Console function was (between Notes and Hotkeys):
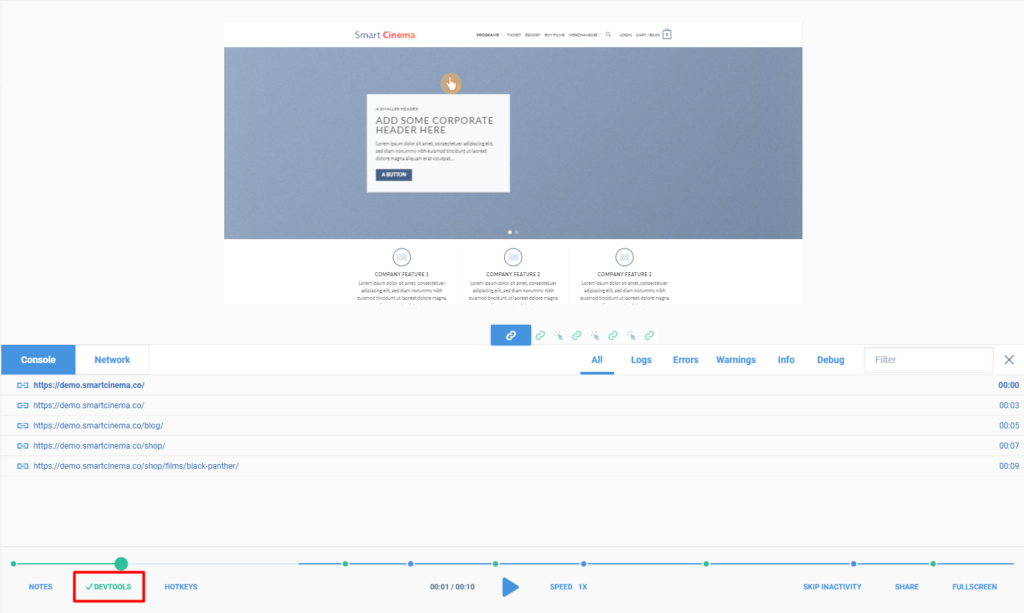
Smartlook’s Devtools provide our users an ability to see all assets, requests, or logs that happened in their users sessions, and much more.
They’re necessary for complete understanding of the users session from a more technical perspective. Smartlook Devtools are critical when troubleshooting, discovering and resolving bugs.
In essence – the session replay is a visualization of user behavior with the website content. At the same time Smartlook’s Devtools replicate all the information the users browser process as well- including errors, logs, warnings, media and script downloads, and more…
Beyond bugs and issues – Smartlook’s Devtools also allow our users to see how specific assets (media or scripts) impact download speed on their end users browser. So, if you ever see a user leaving your website before all the assets are downloaded – double check the network hooks for clues on what is hampering the websites’ download speed.
Console & Network Hooks combined into one
Smartlook’s Devtools comprises of two distinct parts: Console & Network.
Both of them include URLs, a Filter and Timestamp for easier discovery of the data and navigation between the elements.
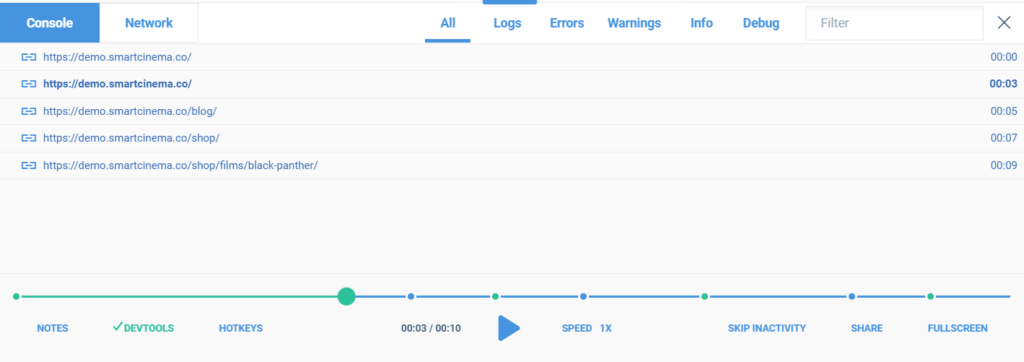
The Console part (as shown above) includes Logs, Errors, Warning, Info and Debug areas which you can use to review all the most important notifications from the JS console. Just like you’d see in the browsers.
Our users can already use an API method to send their own custom JavaScript errors and messages to Smartlook. You can read more about how Smartlook handles JavaScript default and custom errors here.
It is in the console part where these errors will be presented and be accessible onward.
Similarly, the Devtools’ Network part includes an overview of all assets that have been downloaded by the end user within their session. These are further grouped by Xhr transfers, JavaScript scripts, media and other assets downloads.
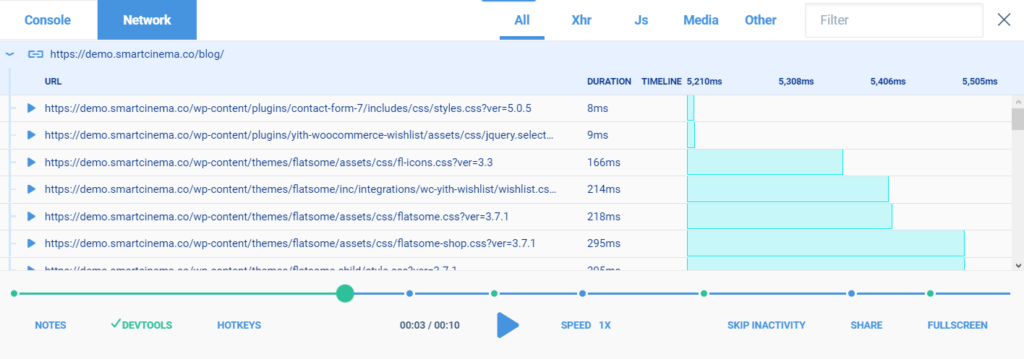
As hinted above this Network part includes the downloaded assets duration timestamp with a neat graph bar visualization of those download times. This way, Smartlook’s users can see if there’s a specific asset that failed to download or discover anomalies in their respective download times.
Available today for all Power users
Smartlook’s Devtools were built so our users can have a deeper, albeit slightly technical, insight to their user’s sessions. They’re perfect for delivering bug-free and flawless digital experiences.
The Devtools have been released to our production environment today. But, they will be accessible only to Smartlook’s users with a Power package, on demand.
The demand aspect is only temporary as Network Hooks are in beta at the moment. We’d use this time and your feedback to fully optimize the tool and discover further improvements before releasing it to all projects by default.


