![User behavior analytics: Learn the fundamentals of making data-informed decisions [updated]](https://hpassets.smartlook.com/wp-content/uploads/sites/2/2023/02/10163120/cover_101-2-1024x536.png)

If you want to learn about user behavior analytics, you’ll need to read into what lies beneath statistics such as:
- The amount of time users spend on your website
- The number of new sessions
- Conversion rates
These numbers alone will only give you a partial understanding of user behavior. With additional user insights (sometimes called qualitative insights), you’ll get quick access to the missing context of specific user groups.
What is behavior analytics?
User behavior refers to all sorts of user interactions across websites, mobile apps, and digital products. These interactions consist of making purchases, signing up, clicks, taps, interactions with elements, inputting text, and choosing navigational paths.
As user behavior varies across user segments, you’ll need a comprehensive understanding of the following:
- User behavior patterns
- Navigational patterns across your website, mobile app, or digital product
- Why users behave in specific ways
To understand user behavior analytics, you’ll need to make sense of the data that shows you how users behave and interact with your mobile app or website.
There are multiple ways to observe user behavior, from watching session recordings and analyzing heat maps to tracking events and funnels. Each method will give you a different level of insight and granularity.
You can track user activity and interactions across:
- Websites
- Digital products
- Games
- Mobile apps
By discovering user behavior patterns, segmenting users into different groups, and analyzing large batches of data, you can craft a better user experience.
But first, you’ll need a reliable analytics tool to get started.
Combine numerical data and user insights with your user behavior analytics tool
There are multiple ways to observe user behavior. There is plenty of user behavior analytics software on the market, such as Smartlook, Mixpanel, Fullstory, Hotjar, Mouseflow, and more.
When it comes to user behavior data, with Smartlook, you’ll have access to:
- Session-level data (observe real-time user behavior by watching session recordings)
- User-level data (the sessions and events attached to specific users)
- Event-based analytics (specific interactions — clicks, taps, text inputs, etc., between users and your product)
Unlike Google Analytics, with Smartlook, you’ll have access to 3 different data scopes so you can dive into user behavior on a whole new level.
You can even view aggregated data to analyze user behavior along specific user paths thanks to funnel analytics.
For a quick overview of aggregated user engagement, you can take a look at heatmaps to see which elements your users interact with most.

Benefits of behavior analytics
There are many benefits of behavioral data analysis. Some of the most important are as follows.
- As a marketer, behavior analytics help you reduce bias
For marketers, analytics are crucial for more than one reason. As David Coveney states in MarketingWeek:
“We marketers need to be conscious of our own biases and actively seek alternative perspectives. Otherwise, we just try to confirm our own prejudices.”
He singles out two biases that can hinder your work:
“The two big biases marketers face are ‘cognitive bias’ and the ‘availability heuristic.’
The former is the tendency to focus on and remember information in a way that confirms our preconceptions and worldview — in other words, we see reflections of a truth we have already assumed.
The ‘availability heuristic’ takes place when a boss relies on immediate examples that come to mind when evaluating a specific idea or plan that you have put forward, and which are, essentially, totally subjective opinions.”
Assuming that you perfectly understand your users without talking to them or analyzing their behavior is a big mistake. Instead, try thinking of user behavior from a different perspective — design a couple of hypotheses and test them to see whether they work.
- Improved conversion rates and monthly recurring revenue (MRR)
Getting insight into users’ behavior can increase your effectiveness and help you achieve your KPIs.
By studying user behavior analytics, you can spot where your users experience trouble and adjust your conversion processes accordingly. This will result in an increased conversion rate and greater profits from the same volume of traffic.
- A better evaluation process regarding your current design and user experience
When a new design, feature, or functionality goes live, user behavior analytics help understand how they’re received. It’s a big moment! You can check how many users explore new options, including how they use them.
Anything you learn will help you better understand your users’ needs. Consider the following use case: imagine you notice that some of your users are struggling to make the most of your features. By tweaking the instructions written in the interface
and checking the results, you can improve the usability of your website, app, or product.
- Spot friction in the user journey and fix it
When you learn about a bug from a customer complaint or a storm on social media, the consequences are often serious. Some of your customers may decide to leave your product or service. Often, the results will have an impact on your reputation in the long run.
Real-time user behavior analytics allow you to quickly spot error messaging and user problems so you can react in a timely manner. Analytics will even highlight errors that are so minuscule that users don’t even bother to complain.
Understand the ‘why’ behind user behavior — start a full-featured, 30-day trial (no credit card required).
What user behavior can be analyzed?
How to track user behavior on a website
Websites give you a lot of options to analyze user behavior, from how your website visitors navigate to where they scroll, click, and leave your page.
Observe how various design elements are displayed and double-check to ensure you’re offering a consistent experience across devices.
Be sure to check how returning users’ behavior differs from first-time visitors. This can be useful when evaluating user engagement and retention rates.
E-commerce and SaaS websites are particular examples, as conversion rate optimization plays a huge role with them.
From eliminating bottlenecks to choosing the best user interface design, user behavior analytics give you real-time feedback regarding any changes you implement.
Looking for ways to optimize the conversion rate in your e-commerce store? Here are some tips to boost your e-commerce conversion rate.
How to track user behavior in mobile apps
Similar to websites, you can also benefit from learning how users navigate mobile apps. For example, you might notice you’re experiencing a lot of misclicks. To fix this, try adjusting the placement and size of your buttons.
When it comes to features, you can track which ones your customers find the most valuable. By analyzing in-app feature interaction, you’ll get a good idea of which features should stay and which should go.
When looking for a specific tool for performing user behavior analytics, check to make sure it doesn’t slow down your app. If you want to analyze user behavior during mobile onboarding, dive into our article.
How to track user behavior in games
User behavior analytics in games is a great way to improve the user experience. Analytics help you analyze the difficulty of your game, its missions, levels, and how people react to them.
If you notice that advancing to the next level is too easy or frustratingly hard, simply adjust it to find the sweet spot.
Your players may encounter some unforeseen paths or dead ends. They may even find bugs you weren’t aware of. With screen recordings and behavior analytics, you’ll not only see what’s wrong, but you’ll also see the cause first-hand.
Check how Vertigo games improved their game development with a combination of numerical data and user insights.
How to track user behavior in products
User behavior analytics is a big part of product analytics. By analyzing user behavior in your product, you can improve the customer experience and retention rates.
For example, by tracking feature usage, you can verify whether your users are using a feature the way it was initially designed. You can also cooperate with product teams to come up with a marketing strategy that addresses user needs in accordance with current positioning.
By analyzing retention and churn rates, you can spot if users return to your product or don’t see it as a solution to their problems.
How to analyze user behavior
Connect your analytics goals to your business goals
Before you leap straight into watching user session recordings, stop and think about your business goals first.

Depending on the challenge, you can begin looking for other information and pay attention to different details.
Let’s assume your goal is to improve your website or app design. In this case, your goal for user behavior analysis is to find answers to the following questions:
- What are your users’ main struggles?
- Which areas of your design are performing well?
- What impact have recent changes had on your business performance?
You can tackle multiple issues at the same time and prepare various analytics goals for each challenge. But keep in mind you may spread yourself too thin and be less effective than if you were working on one issue at a time.
Remember that your business and analytics decision-making process will have a big impact on the type of data you’ll collect.
Lacking crucial information will lead you to misunderstand the results, yet tracking everything may prove a waste of time. Invest some time when considering what to track – this will save you a lot of time in the long run.
Prepare a map of critical paths
Critical paths are a series of events that must occur in order for your users to achieve their goals. They’re the crucial steps in the customer journey. For example, the critical path for a food delivery app may look something like this:
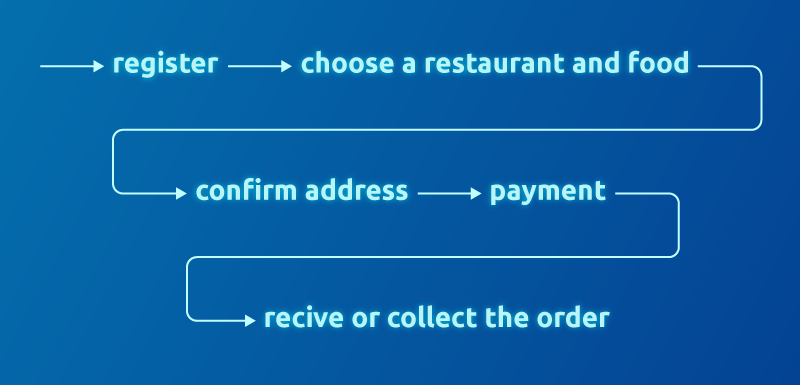
Tracking these paths will help you understand where your users experience bottlenecks so you can adjust the processes accordingly.
Once you have defined the events you want to track, organize them into separate categories to make it easier to keep all of the data in order. Instead of scrolling through a list of events, you’ll be able to look up a specific category and the event you’re looking for.

Identify your users and their behavior patterns
Another important step to setting up user behavior analysis is to understand how your users are identified. After all, you’ll need to assign sessions to corresponding users so you can have an overview of the complete user journey.
You can also check if you need to connect your behavior analytics tool with a CRM tool or another database.
This is especially useful when you want to use behavior analytics data to boost customer service or increase the effectiveness of your technical support.
Collect user feedback through surveys and customer feedback widgets
Sometimes, numerical and user behavior data aren’t enough. In this case, you can integrate a user feedback tool with your behavioral analytics tool.
For example, when you integrate Survicate with Smartlook, you combine the power of direct user feedback and session recordings. Set up a Survicate feedback widget and ask your users about their user experience with the product (use a survey with a scale from 1 to 5).
If you receive a bad score, ask them for more details. If users refrain from sharing feedback, watch session recordings to see how they navigate through your product.

Ensure events are tracked properly
Before you jump straight into analyzing your data, run a test session to determine whether or not everything is working properly. This will help you spot weaknesses in your testing system and avoid consequential pitfalls.
Look for a solution that lets you track events backward. At Smartlook, we collect data relating to everything. Anytime you need to know about a new event, you don’t have to wait while new data is collected — you can start your analysis immediately.

Drive actionable insights
This is the most exciting part of user behavior analytics. You can finally dive into the data to find out how users interact with your website or mobile app. As you progress, make sure to take note of all the ideas for improvement that cross your mind. Afterward, you’ll be able to gain important insights and put them into action.
The amount of information can be overwhelming. Even though you’re responsible for setting your priorities and measurement system, try to focus on low-hanging fruit first. This can help you structure your analytics even better and identify quick wins.
Adjust your tracking plan measurements
Your user behavior analytics system isn’t set in stone. As you go, you should adjust your measurements to suit your (changing) needs. If you decide that you want to get more in-depth and add another level of granularity to your data, or you notice that some events just aren’t producing value, simply go ahead and make the necessary changes.
Advance your customer behavior analytics skills further
If we were to sum it up, behavioral analytics explore the what and why of user behavior. Based on your marketing goals, you can decide whether to focus on what the user is doing or why they are doing something specific (or a combination of both).
Lastly, you can combine customer behavior data with session-level insights. This includes aggregated data about bounce rate, session duration, and the conversion rate regarding various CTAs.
3 key takeaways:
- User behavior analytics show you how users interact with your website or mobile app
- User behavior insights give you additional context into metrics like the amount of time users spend on your website and the conversion rate and show you where there’s room for improvement
- If you’re just starting out, don’t attempt to analyze everything at once — it’s better to plan, prioritize, and start small
Understand the ‘why’ behind user behavior — start a full-featured, 30-day trial now! (no credit card required).