Cross-platform analytics is the process of tracking the behavior of users as they move between website browsers and native mobile applications — ideally, using only one tool.
The ability to analyze user behavior across platforms is important for any company that has both a native mobile app and a website, especially for e-commerce businesses where users have many touchpoints with brands’ sites and apps before completing a purchase.
However, most mobile app and web analytics tools can only analyze one platform at a time, leaving user behavior data siloed into different tools or dashboards.
Because only a few tools can track users on both websites and native mobile apps, many teams end up with the analytics data for their desktop and mobile site in one tool, while their native mobile app’s data is in another.
In these cases, it’s still possible to get a cross-platform view of users’ behavior by organizing the data manually. Alternatively, you can use a third-party app that automatically syncs datasets from both platforms, but you still need to sort out what data gets sent to the app. You’ll also be jumping back and forth between tools constantly, as you’ll need to manage additional software alongside your web and mobile app analytics solutions.
Put simply, these manual workflows are time-consuming and prone to human error, which only gets worse as the volume of customer data grows.
Instead, a better way to approach this problem is to use a tool that’s built to do cross-platform analytics. Specifically, a tool that can do two things:
- Identify and track users as they move between your native mobile app and website.
- Aggregate user behavior data from these different sources in a single, unified dashboard.
In this guide, we’ll show you how to do both of these things with our tool, Smartlook, which lets you analyze cross-platform user journeys without using any other tools or manually combining data.
Besides setting up a combined website and mobile app project, we’ll also show you how to analyze and improve your users’ experience with the help of session recordings, events, and funnels.
Want to learn how Smartlook’s cross-platform analytics can help you get an accurate view of users’ journeys? Sign up for a free live demo with our team.
Collect and analyze user behavior data from your website and native mobile app in one place
Again, one of the biggest obstacles to getting a complete picture of users’ behavior is not being able to see all of your user data from different platforms in the same dashboard.
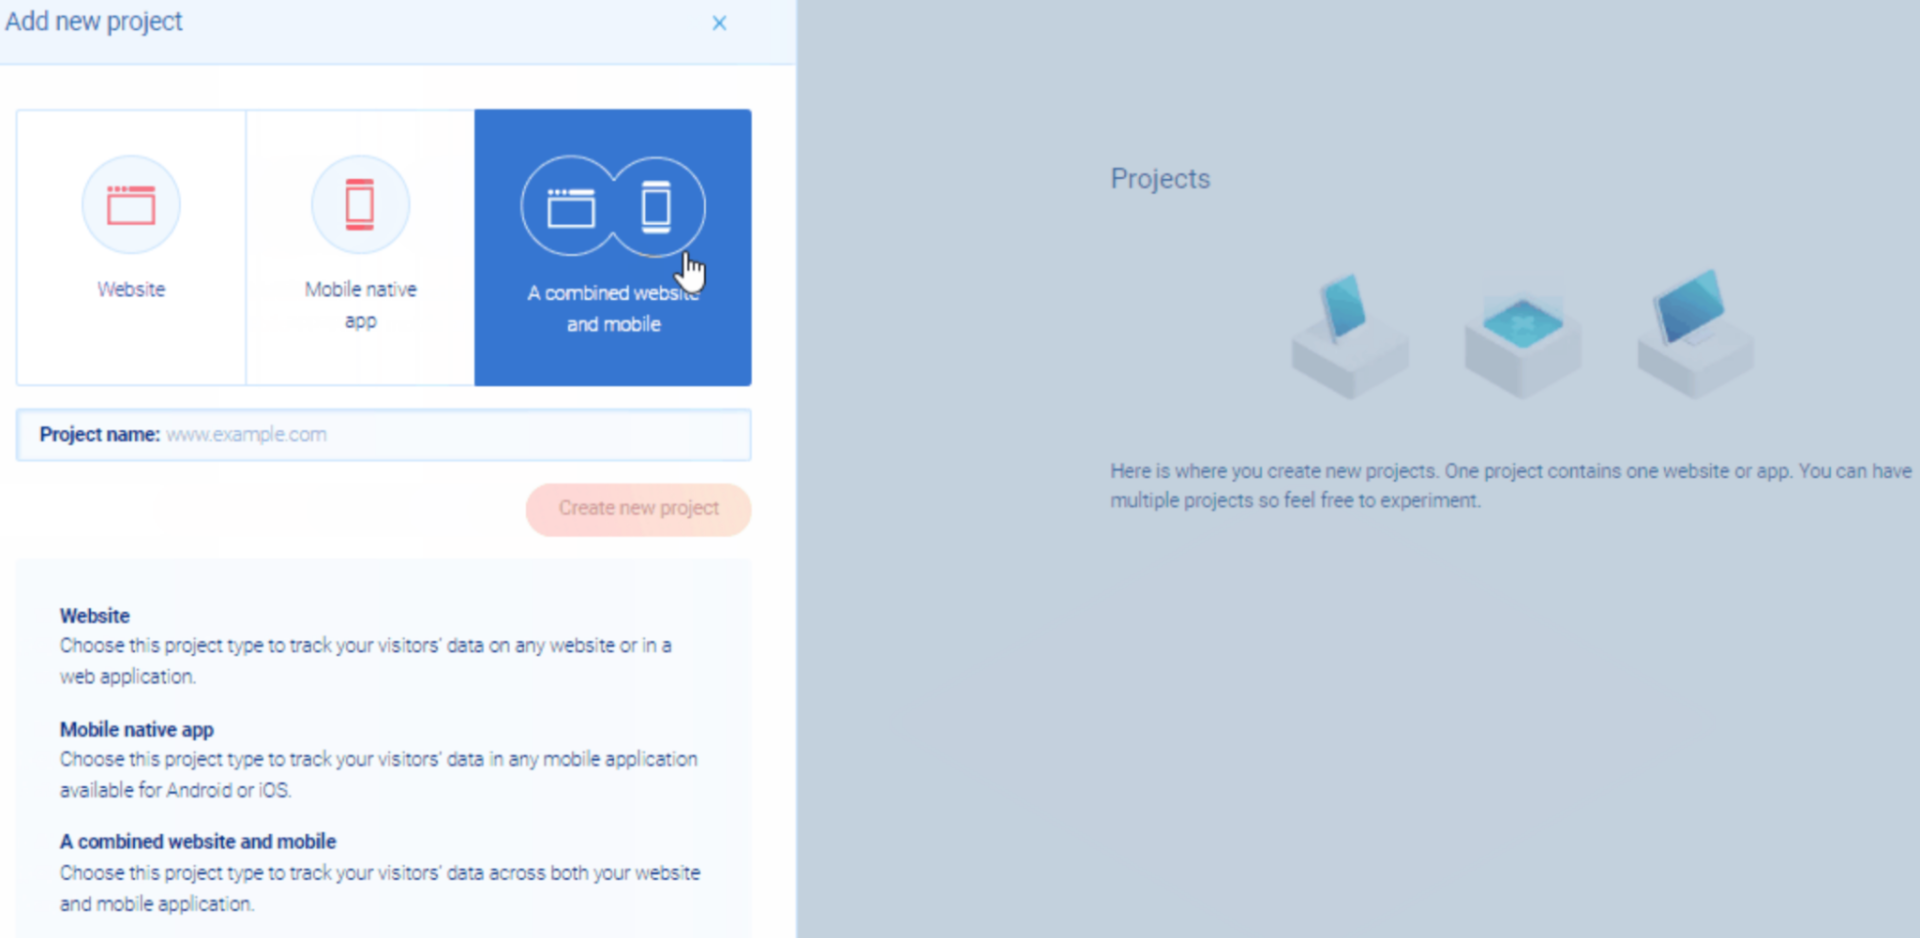
Smartlook overcomes this problem with the ability to create a combined website and mobile project, letting you do native mobile app analytics and website analytics in the same project.
A common use case for cross-platform analytics is tracking users as they visit your site, click on a CTA to download your mobile app, and then start using it. Let’s look at PayPal as an example.
Users can open PayPal’s website on their mobile phones and log into their accounts. Since PayPal wants to promote their app, they’ve placed a lot of messages and CTAs for logged-in users to download it.
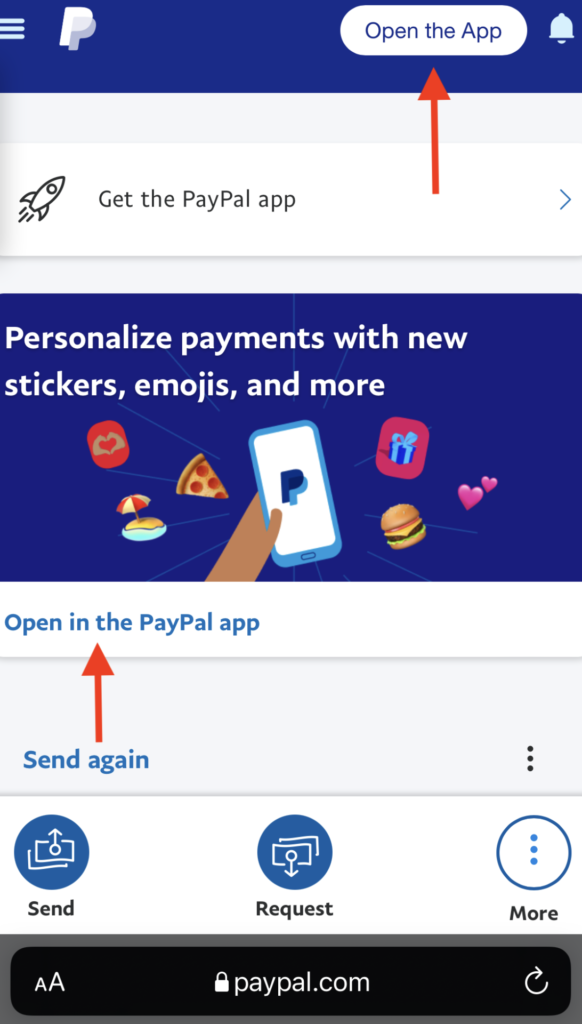
Clicking on these buttons takes you to the App Store or Google Play, where you can download the app.
Now, this journey may take place entirely on the same mobile device. However, it’s still a cross-platform journey, as users jump between a mobile website and a mobile app.
If PayPal was using one tool to track website analytics, and another to track mobile app analytics, there would be no way to analyze this user’s journey across the two platforms.
In one tool, user journeys would end when they click “Open in the PayPal app” and there would be no way to tell if they actually downloaded the app successfully and/or logged into it.
In the other tool, user journeys would start with logging into the app for the first time, but you wouldn’t be able to tell how they found your app or what interactions they’ve had with your site prior to downloading the app — unless you find a way to manually match users between the two analytics platforms you’re using.
But if PayPal was using Smartlook, they could track this journey using a combined web and mobile project, and both the website session and mobile app session would appear in the same dashboard.
With our Identify API, they could associate each user session with an identifying characteristic like username or email, which would then automatically match users’ sessions across platforms.
Watch session recordings to see your users complete journey — from their point of view
Once you have a combined website and mobile app project set up in Smartlook, there are many ways to analyze users’ cross-platform journeys.
Session recordings (sometimes called session replays) let you watch a user’s entire session so you can understand their experience with your website or product.
Once our code snippet is added (for websites) and the SDK is set up (for mobile apps), our tool starts recording every user session, regardless of whether it occurred on your website or native mobile app. You can find the session replays in the “Recordings” tab of your Smartlook dashboard.
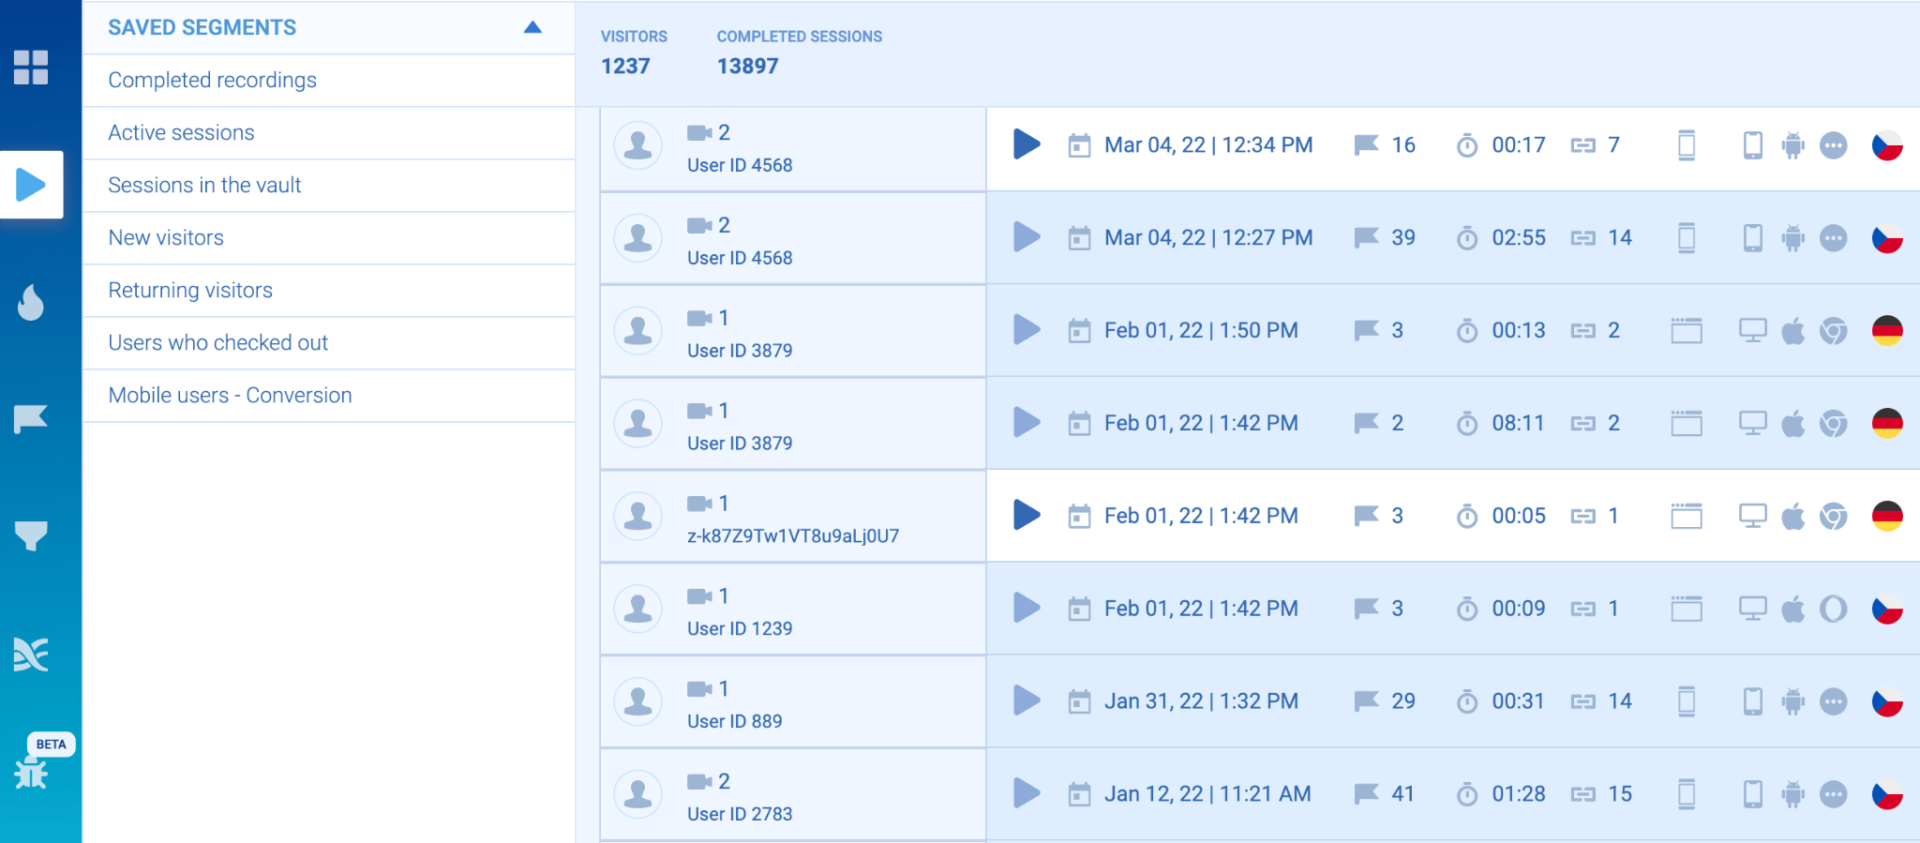
In a combined web and mobile project, the “Recordings” tab will show you a chronological list of all the latest user sessions that happened on any of the platforms you’re tracking.
So, if one user opened your mobile app at 3:55 p.m. and another user browsed your website at 3:57 p.m., you’ll see both sessions in the same feed. The type of session is indicated with an icon representing mobile app or desktop (as you can see in the screenshot above).
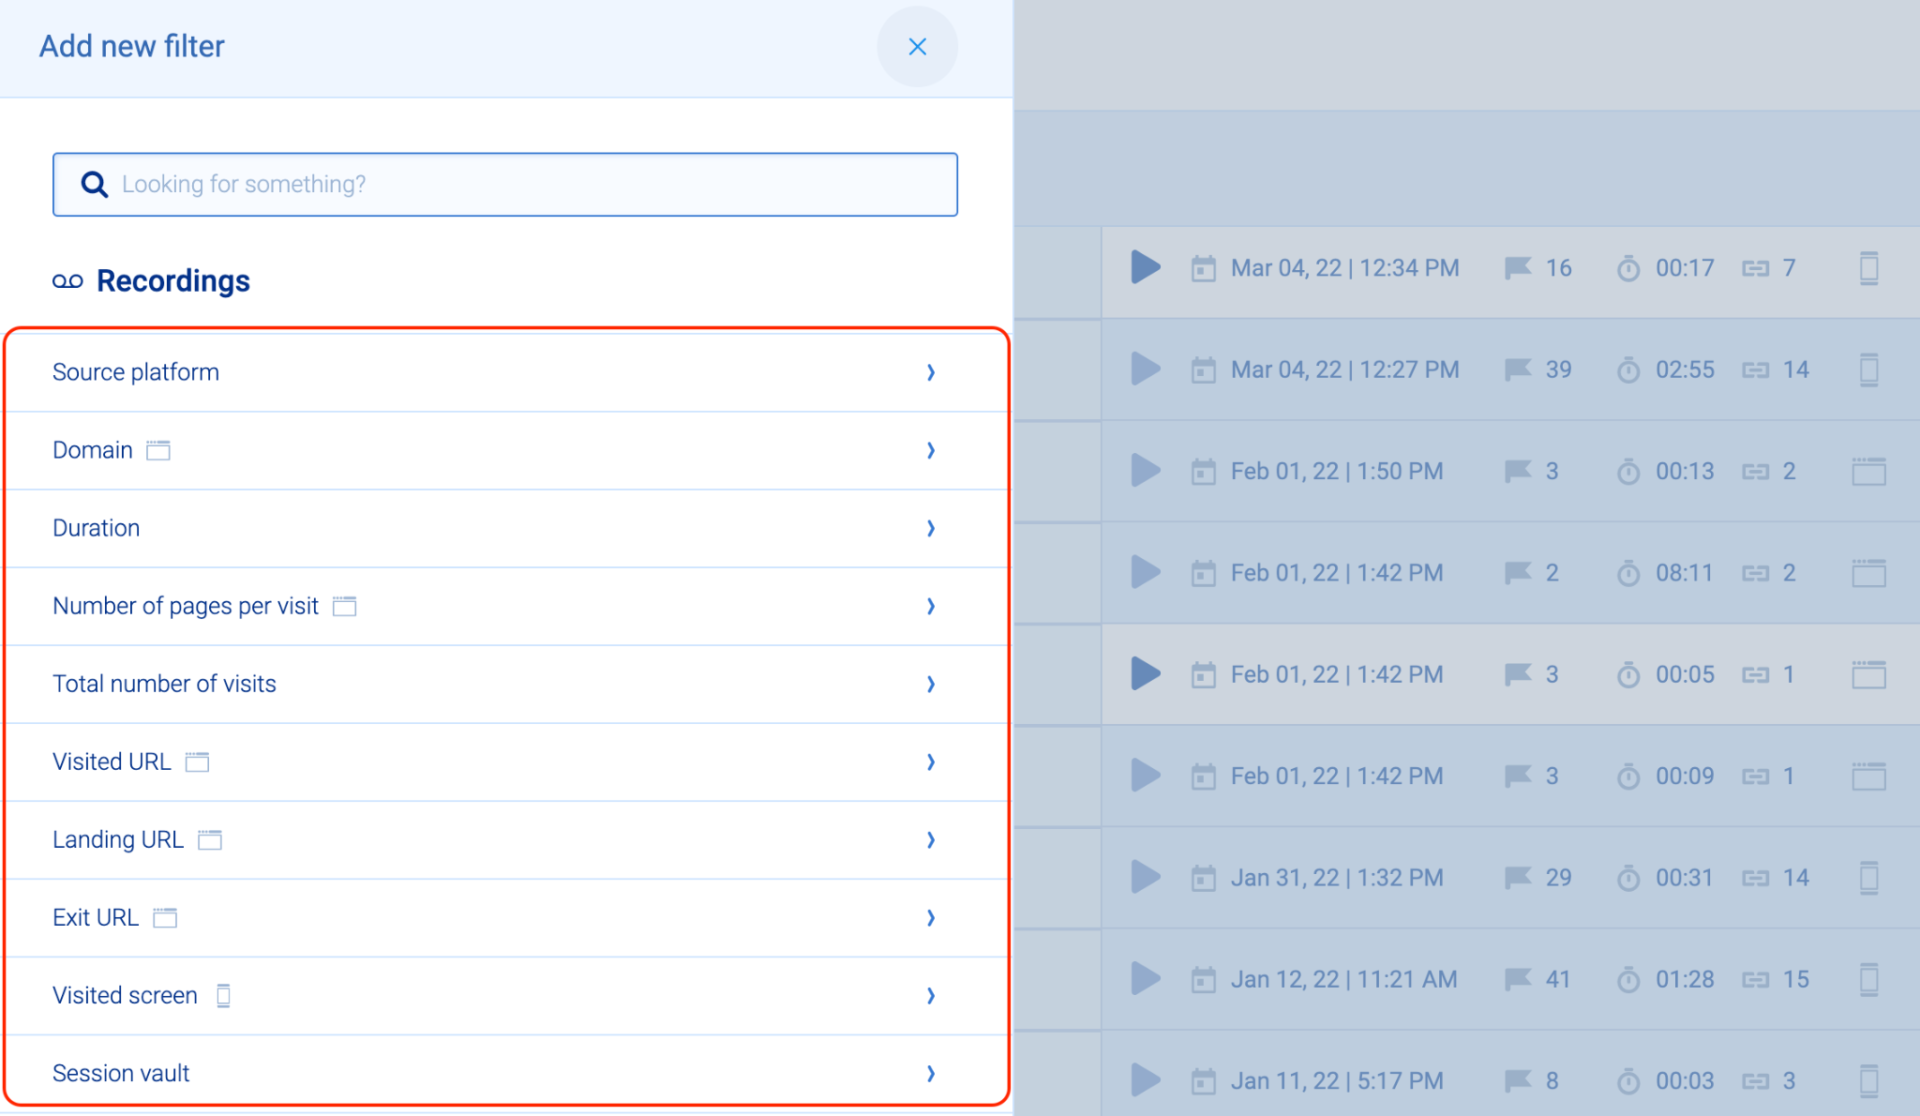
If your site gets hundreds of visitors each day, you won’t want to watch every session. Instead, you’ll want to use filters to narrow the feed down to only a few sessions that will show you specific user behaviors. Smartlook offers more than 30 filters, such as session duration, country, device, and new users or returning ones, to help you quickly find relevant recordings. It’s worth noting that some filters only work for websites and others only work for mobile apps (as indicated by the icon next to the filter name).
If you select one of these filters (visited URL, for example), it will only show you sessions from the platform it’s compatible with, eliminating all sessions from the other platform. But filters like session duration and number of visits work for both platforms.
You can also watch all session recordings of specific users to analyze their behavior in the context of all their previous interactions with your site or app.
When you click on a session, you’ll see all the past sessions of that user, with a mobile or desktop icon representing which platform the session took place on.
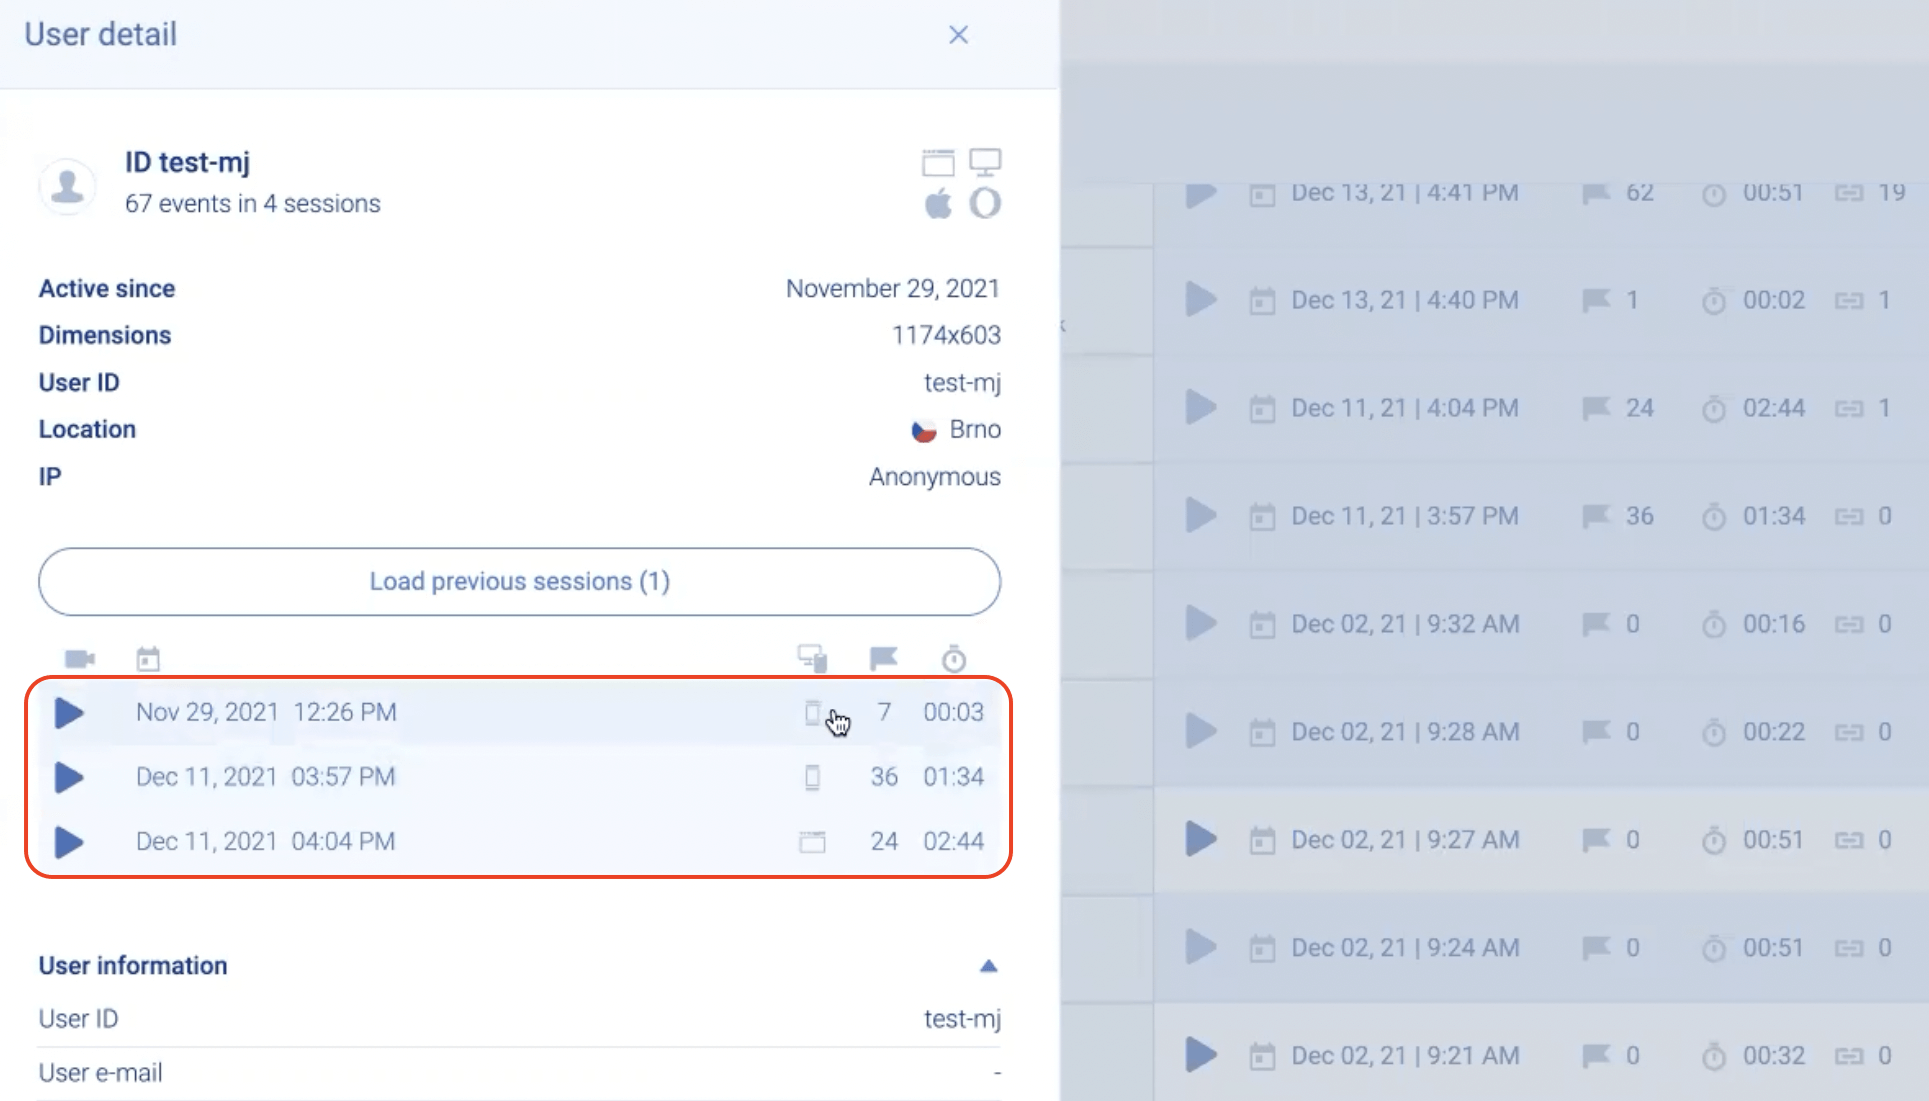
Let’s say you have an eCommerce store and you know that 20 regular customers drive a lot of revenue each month. Using Smartlook’s Identify API, you can send an identifier to Smartlook with each user to make it easier to look up those customers. You can identify these users via their email, for example, since they have to provide it when logging in and checking out.
From here, you can locate all of their session recordings and watch them chronologically to get a better understanding of these high-spending users’ behavior.
For instance, you may see that they tend to browse your site for a few hours, add items to their cart, and complete their purchase through your mobile app a few days later. Such behavioral data (alongside engagement metrics like retention rate) can give you ideas for improving the customer experience or encouraging other users to follow a similar path.
Analyze your users’ journeys across platforms and calculate conversion rates with funnels
Funnels help you analyze the user journey across your website and mobile app, calculate conversion rates, and find out where users drop off.
In Smartlook, you can create a funnel by placing two or more events in the order you believe your users follow. Events are the specific user actions that you track, like URL visits on the web, navigation between screens on mobile apps, or text inputs, which can be both web and mobile events.
Once it’s setup, Smartlook captures several events automatically:
- For websites, Smartlook automatically tracks all user interactions, like URL visits, button clicks, text inputs, and more. You can create custom events via JavaScript to track pretty much everything else outside of the automatically captured standard events.
- For mobile apps, Smartlook tracks user interaction events like finger touches, gestures, and focus on UI elements. For native iOS and Android apps, our tool also captures Analytics events that initialize an action in the app, like button clicks and navigation between screens. With mobile apps, custom events are usually the primary way of tracking user actions.
In a combined web and mobile project, you can also create merged events when you have events that take place on both platforms. If you want to track the total number of purchase events happening across both platforms, you first need to create the purchase event for web, and then create another one for mobile. Then, you can merge the two. Smartlook will aggregate the data for both platforms.
Once you have created your events, simply put them in the order you believe your users follow to create a funnel.
When you create a funnel, you can see how many users went through it, the overall conversion rate, and the drop-off rate between each step.
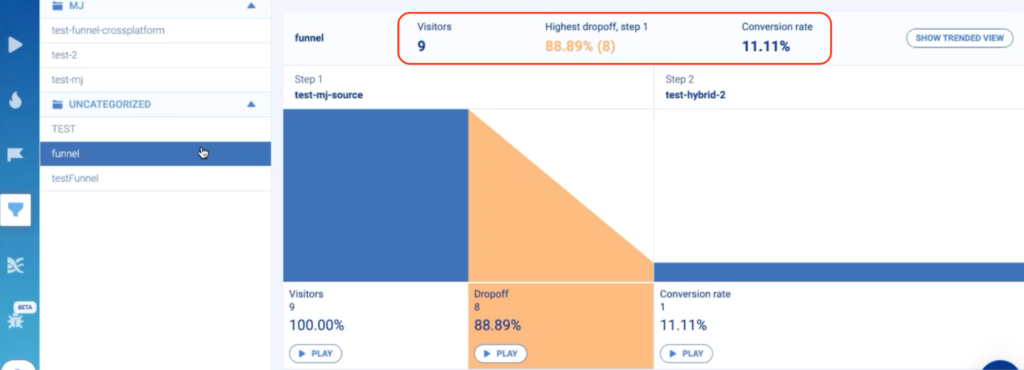
Let’s go back to our example of tracking high-spending users’ behavior and add funnel analysis to the mix. Say you’ve watched their session recordings and saw that they often start on your site but complete their order through the mobile app. You can map their actions to events and create a funnel.
For example:
- Event 1: Users visit the website homepage (web event).
- Event 2: They search for items (web event).
- Event 3: They login into the mobile app (mobile event).
- Event 4: They add items to their cart (mobile event).
- Event 5: They complete their order (mobile event).
Here’s what that funnel might look like in Smartlook:
You can always add or remove events, based on new assumptions you have about users’ behavior. For instance, session recordings might show that most high-spending users have started to visit a new product category. You can add this event to the funnel to more accurately reflect their journey.
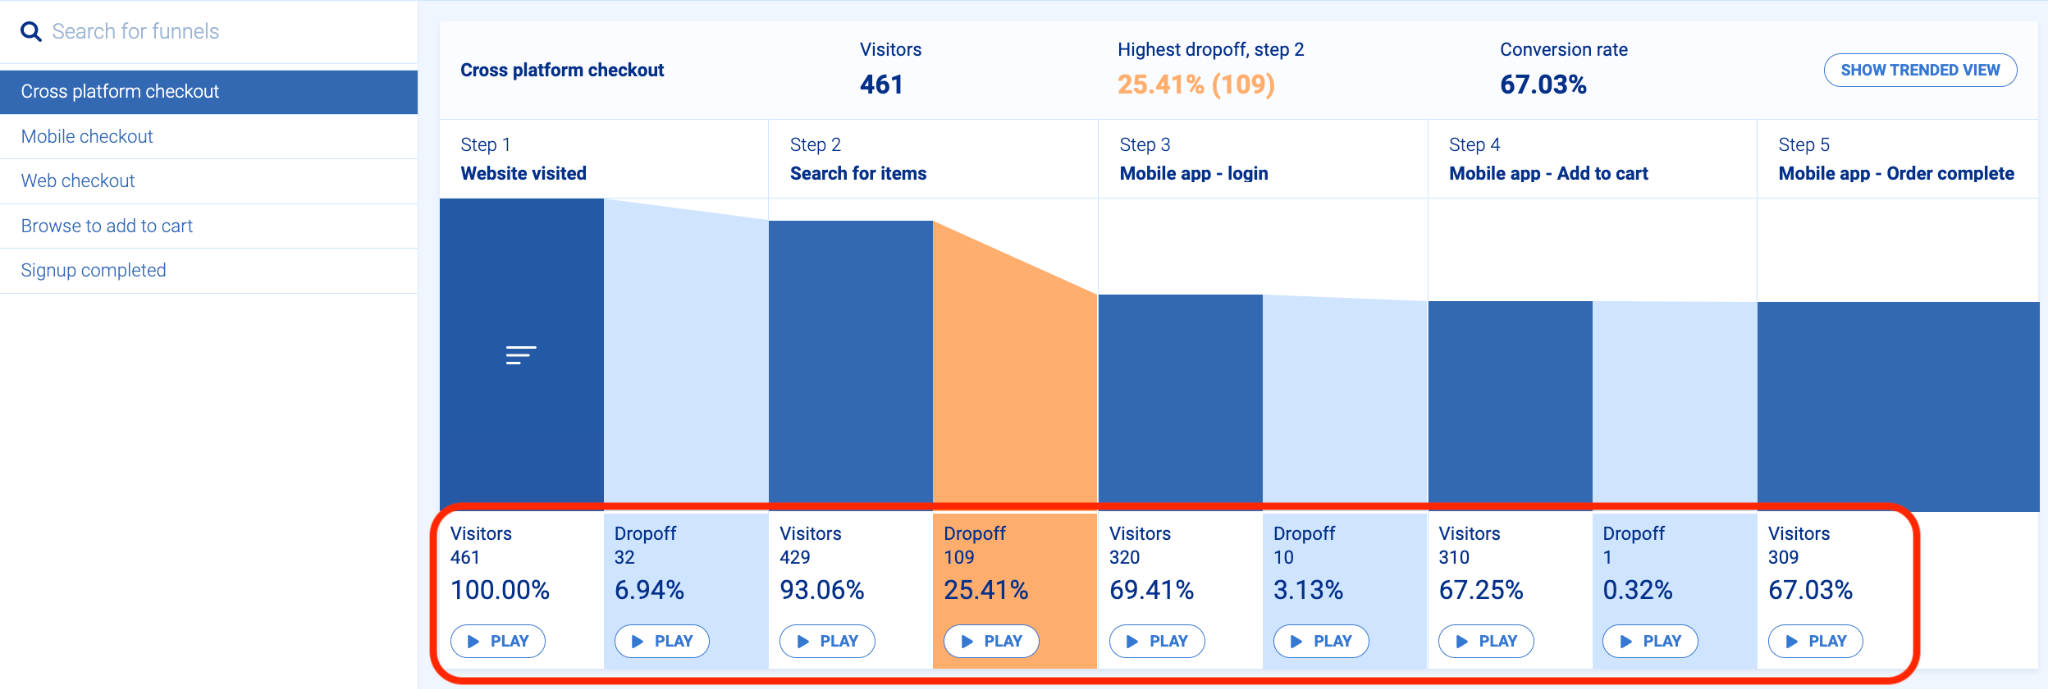
And if you wanted to track the overall conversion rate of both of your platforms, you could create a funnel using merged events. To create a 4-step funnel that tracks the conversion rate between viewing a product, adding an item to the cart, clicking “checkout,” and completing a purchase, you would create the following events:
- product view (mobile)
- product view (web)
- add to cart (mobile)
- add to cart (web)
- checkout (mobile)
- checkout (web)
- purchase (mobile)
- purchase (web)
Then you can merge each web event with its respective mobile event, and then put those four merged events into a funnel. The merged event aggregates data from both platforms and lets you see that data together in the same funnel.
In any case, building and tracking such funnels over time shows you how many users go through specific flows and where most of them drop off.
In addition, combining funnels with session recordings can reveal even more crucial customer behavior insights. Going back to our PayPal example, we saw they’ve placed a few CTAs on their site that prompt users to download their app. Naturally, in such cases it’s a good idea to track:
- How many users click on these CTAs.
- How many of them end up logging into the mobile app.
- What they do once they log into the mobile app.
Funnels, in combination with session recordings, let you do all three of these things.
First, a simple two-step funnel can show how many of the people that click the CTA end up logging into the mobile app:
- Event 1: Click on the “Open in the PayPal app” button (web event).
- Event 2: Log into mobile app (mobile event).
This lets you evaluate and quantify the impact of adding the CTA, as you can confidently say, “We added the mobile app CTA to our website last week and since then, X number of users have clicked on it and logged into the mobile app.” You can’t get these insights without a tool that tracks user journeys across platforms.
Additionally, Smartlook lets you watch session recordings of users at a specific stage in your funnel. Going back to the sample funnel we created above, you can see there’s a “Play” button under each step of the funnel.
Clicking on it takes you directly to the session replays of all users who made it to that stage. As a result, you can watch what users did before clicking the CTA button, as well as after logging into the mobile app.
This can reveal important insights about users who switch from web to mobile. For example, you might find that users tend to immediately complete the task they started on your site, or that they get distracted in your app and do something else entirely.
It’s also worth noting that you can track any type of relevant action as your first event in such a funnel. For example, Event 1 might be a user clicking on a “Download App” button placed inside a blog post about a new feature for your mobile app.
This allows you to attribute app installations to the specific marketing campaigns that brought the users to your site because you can see the complete user journey and understand the context behind users’ actions. When you see that they’re coming to your app after reading a post about a certain feature, you can jump into these users’ session recordings to see everything they do once they log into the app.
See a Smartlook cross-platform project in action
To set up cross-platform analytics in Smartlook, simply implement our tool on all of the platforms you want to track with the same project key/SDK key.
Keep in mind that our cross-platform analytics feature is currently only available upon request, so you’ll have to be a current Smartlook customer to try it out immediately. If you’re not a Smartlook customer yet, you can request a personalized demo from our team to see our cross-platform analytics feature in action.
Here are the setup steps in detail:
- Create a combined website and mobile app project, as shown in the image above. This project brings user behavior data in one place, so you don’t have to constantly switch between web and mobile projects.
- Install the Smartlook code snippet on your website. You can insert the snippet into your site’s HTML (directly or via Google Tag Manager), integrate it into your CMS, or import and initialize via NPM.
- Set up Smartlook on your mobile app by implementing the relevant SDK. Smartlook has SDKs for 10 native mobile app platforms, frameworks, and engines — including iOS, Android, React Native, Flutter, and Unity.
- Set up user identification to track users as they navigate between platforms. Our Identify API allows you to pass identifying characteristics like username, email, or user ID to Smartlook. By associating an identifier with a specific user, Smartlook can track that user’s activity across different platforms and show you their entire customer journey. (Note: The Identify API is available on all paid Smartlook plans, which have a free 30-day trial that doesn’t require a credit card.)
You can learn more about the setup process in this article.
If you want to learn more about Smartlook’s cross-platform analytics functionality and how it can benefit your business, sign up for a live demo with our team.