Google Analytics’ funnels help you track the steps users take to complete a goal on your site or app, like buying a product or finishing a tutorial. Analyzing funnels shows you where most users drop off, which, in theory, should help you make changes to boost conversions.
Now, Google Analytics has a few different types of funnels. The older Universal Analytics (UA) offers three funnel visualizations, while the new Google Analytics 4 (GA4) has one funnel exploration tool. In this article, we’ll show you how to set up and analyze funnels in UA and GA4, as there are big differences between both versions.
However, doing funnel analysis in Google Analytics comes with a huge limitation — you can only see where users drop off, but not why. As a result, you’re in the dark when it comes to understanding the problems that reduce your conversion rates or how to fix them.
Additionally, if some steps in your funnels are based on events that aren’t tracked automatically, you’ll have to create custom events (which requires another tool) and wait for data collection.
In the second part of this article, we’ll explore these downsides in more detail and show you how to overcome them with our tool — Smartlook.
Specifically, we’ll show how Smartlook can help you:
- Watch the session recordings of users who dropped off at a specific stage to see why they did so.
- Build funnels and analyze them immediately, without coding or waiting for new data collection.
- Break down funnels to uncover insights about different categories of users.
- Get notifications about sharp increases or drops in your funnels’ conversion rates.
If you want to start analyzing user behavior on your website or mobile app as soon as possible, sign up for a free Smartlook account (no credit card required).
How to build and analyze funnels with Google Analytics
As we said, UA and GA4 funnels are vastly different. If you’re not sure which version you’re using, open your Google Analytics account and look at the property ID (the numbers under the property name).
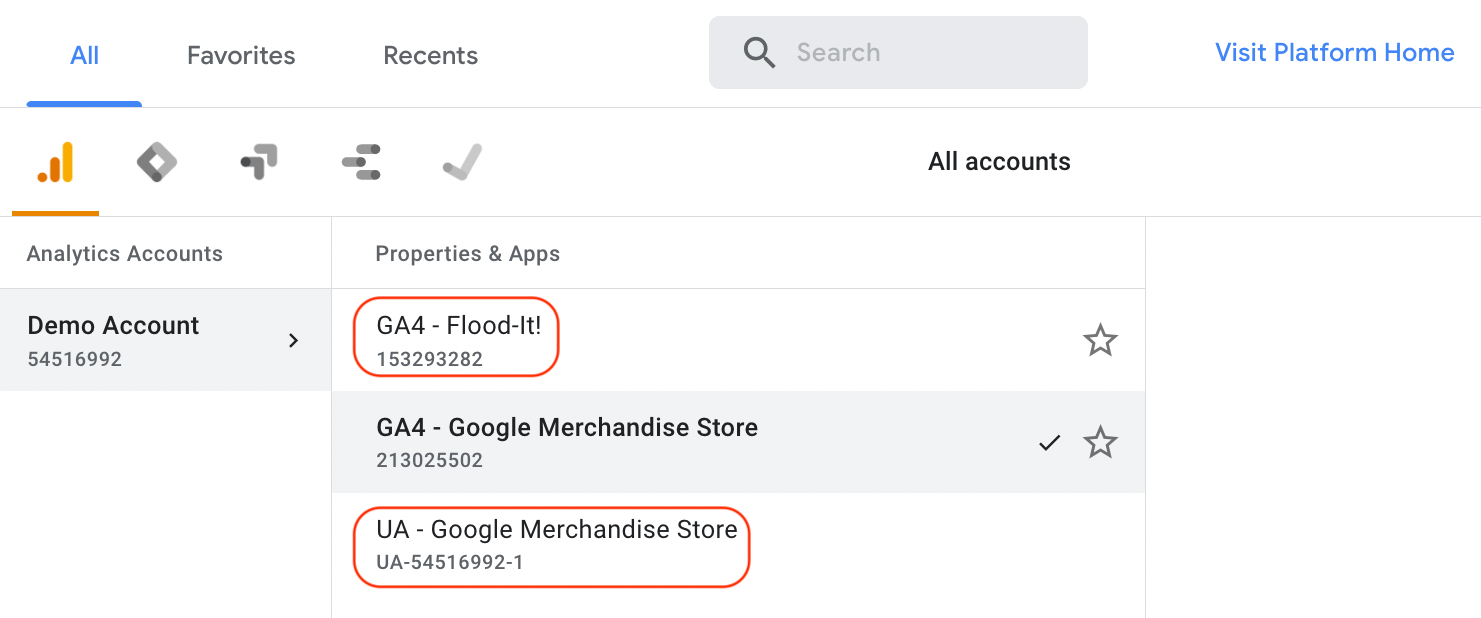
We’re starting our explanation of funnel analysis with UA (the older version), but if you’re using GA4, click here to skip to that section.
The three types of funnels in Universal Analytics(old version)
UA offers three types of funnels — Funnel Visualization, Shopping Behavior, and Checkout Behavior. The latter two (Shopping Behavior and Checkout Behavior) will only be available if you’ve implemented Enhanced Ecommerce.
Standard Funnel Visualization
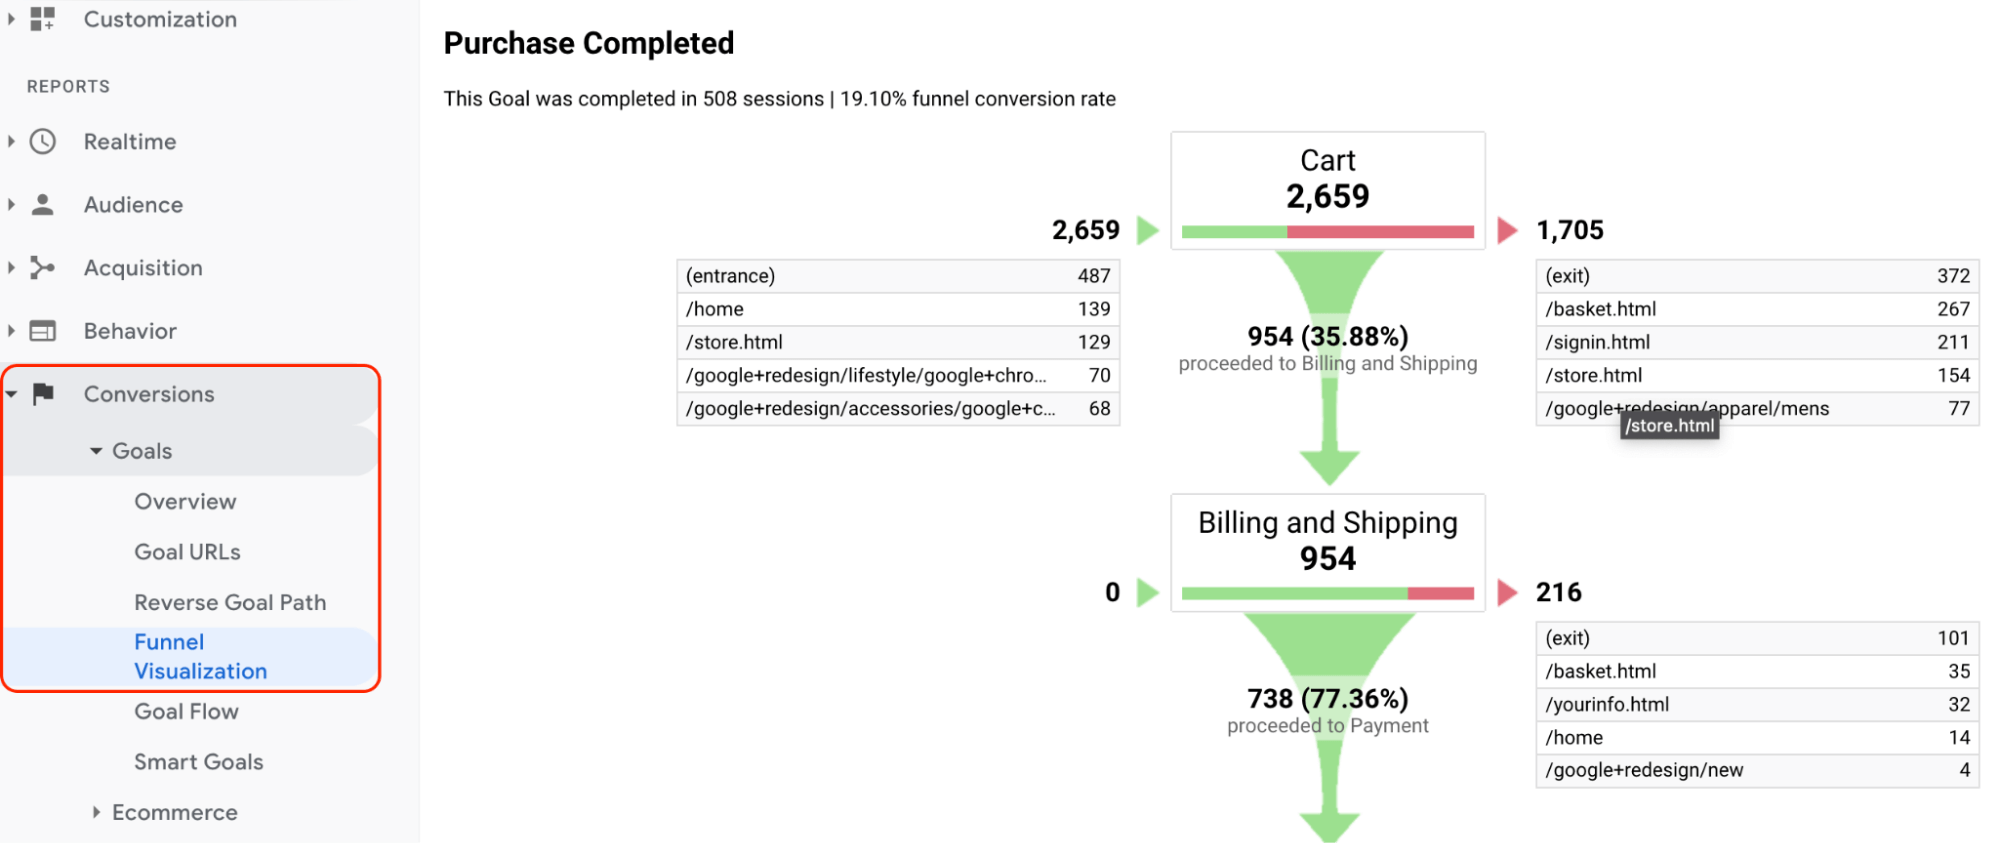
This is the standard funnel feature that all UA accounts have. You can find it by going to Conversions → Goals → Funnel Visualization.
To build a similar funnel, you first need to create goals. In Google Analytics, goals represent specific user activities, called conversions, like product purchases or newsletter signups.
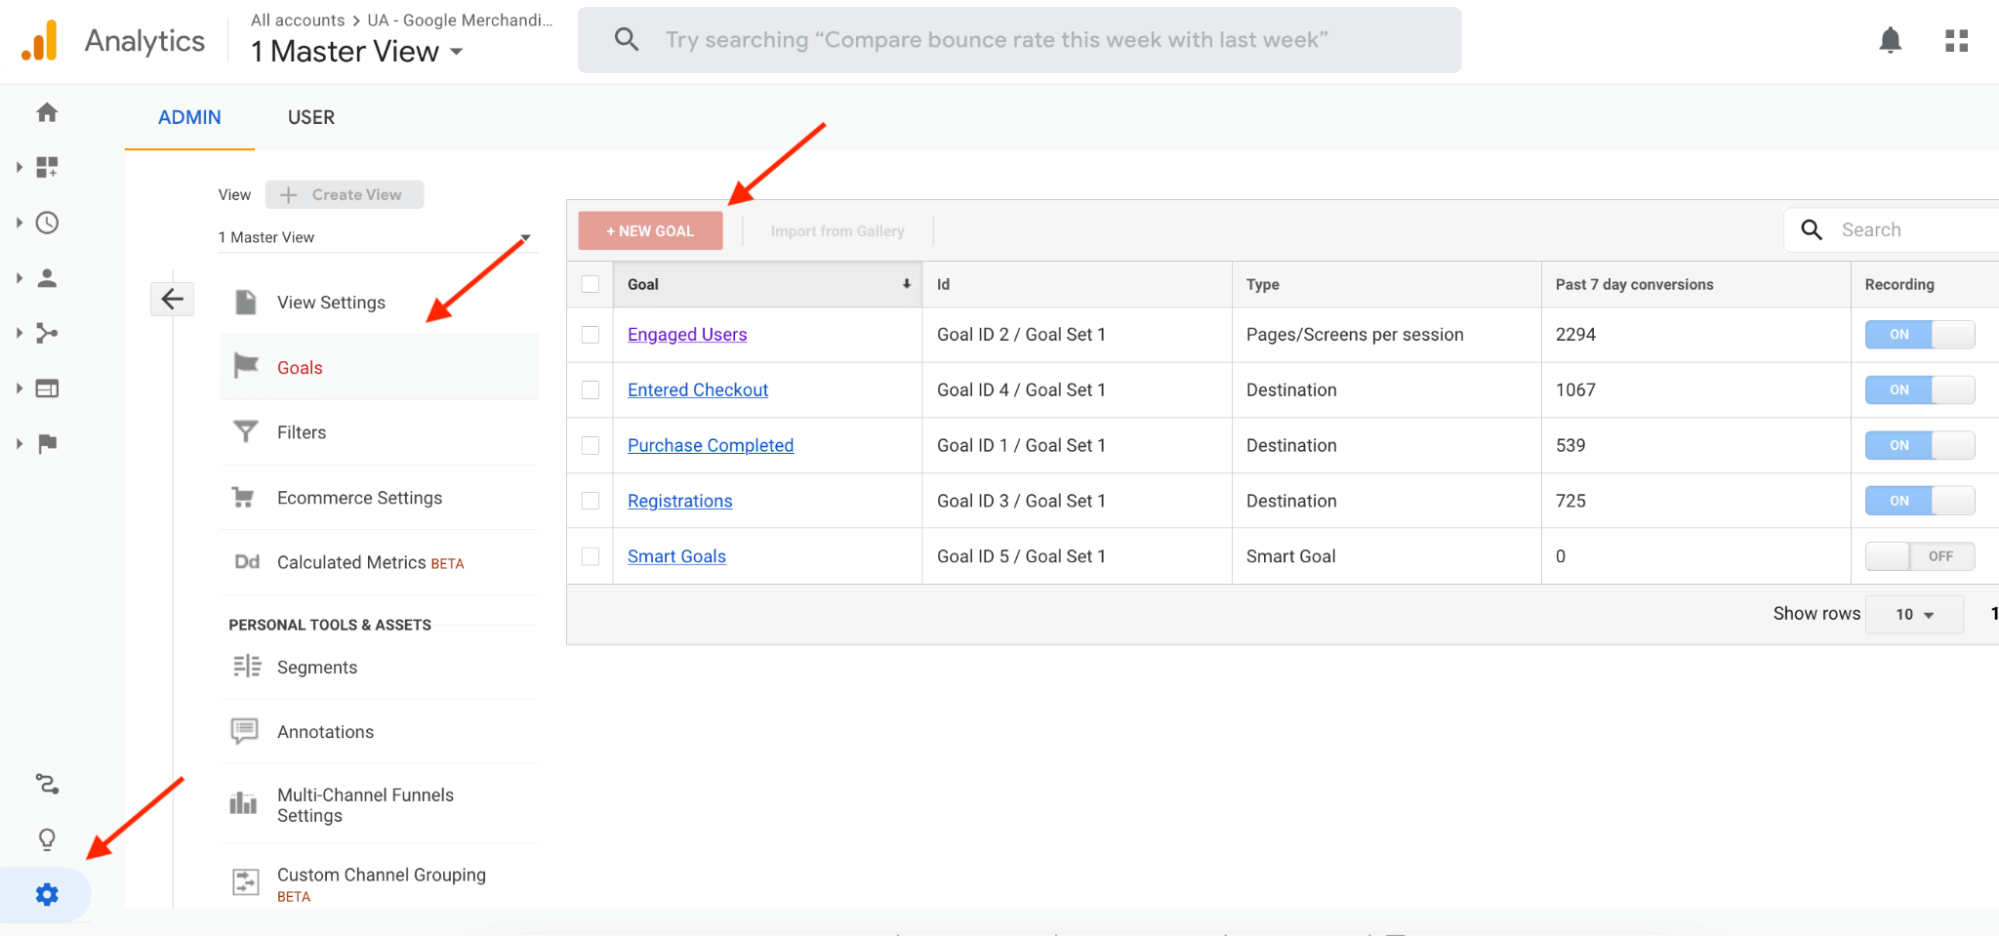
Once you have a goal, say a product purchase, you can build a funnel to track the steps leading up to it. To build a new funnel visualization for a goal, click on “Admin”, go to “Goals” and select “New Goal”.
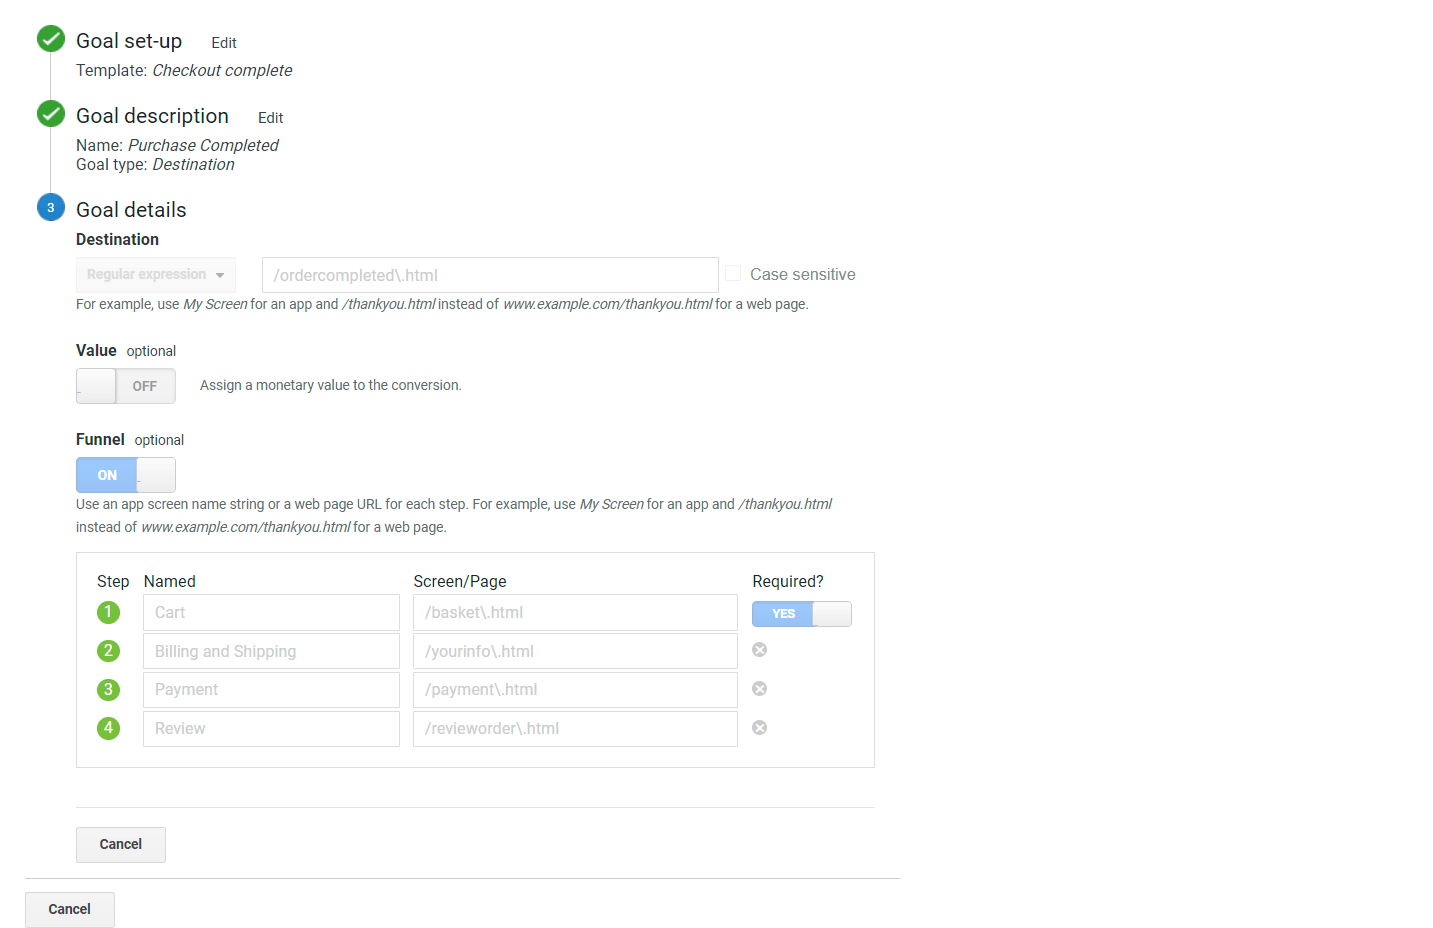
From here, you need to set up the goal by giving it a name, choosing what type of goal it should be, and providing an optional value. For the product purchase example, the goal would likely be for the user to reach a “Thank you” page, confirming their successful purchase. In that case, you’d need to select a “Destination” goal and enter the “Thank you” page URL. You can read more about the different types of goals in Google’s documentation.
Now, to create a conversion funnel (sometimes referred to as a goal funnel), enable the “Funnel” toggle under “Goal details.” Then, enter the pages (URLs), which will represent the different steps of your funnel.
If you don’t know which pages users go through before completing a goal, you can analyze the Goal Flow report (Conversions → Goals → Goal Flow) to get an idea of their journey.
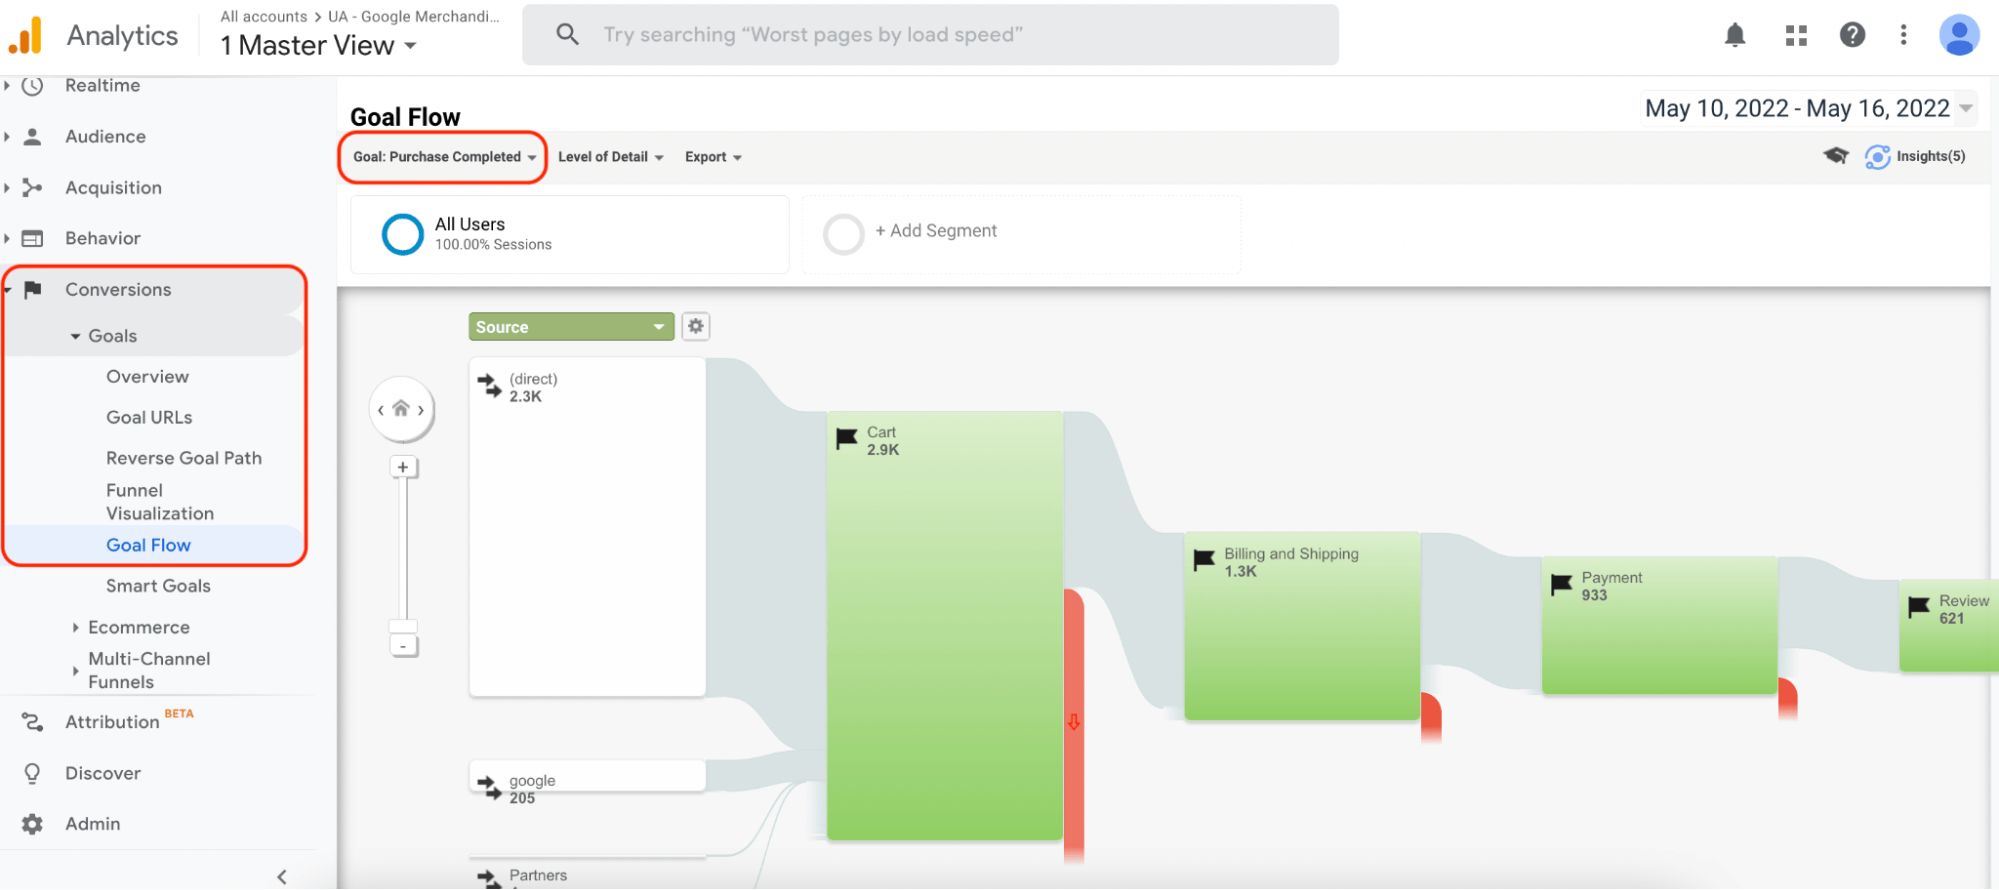
Once you’ve entered each step and created your goal, UA will start displaying the funnel visualization report.
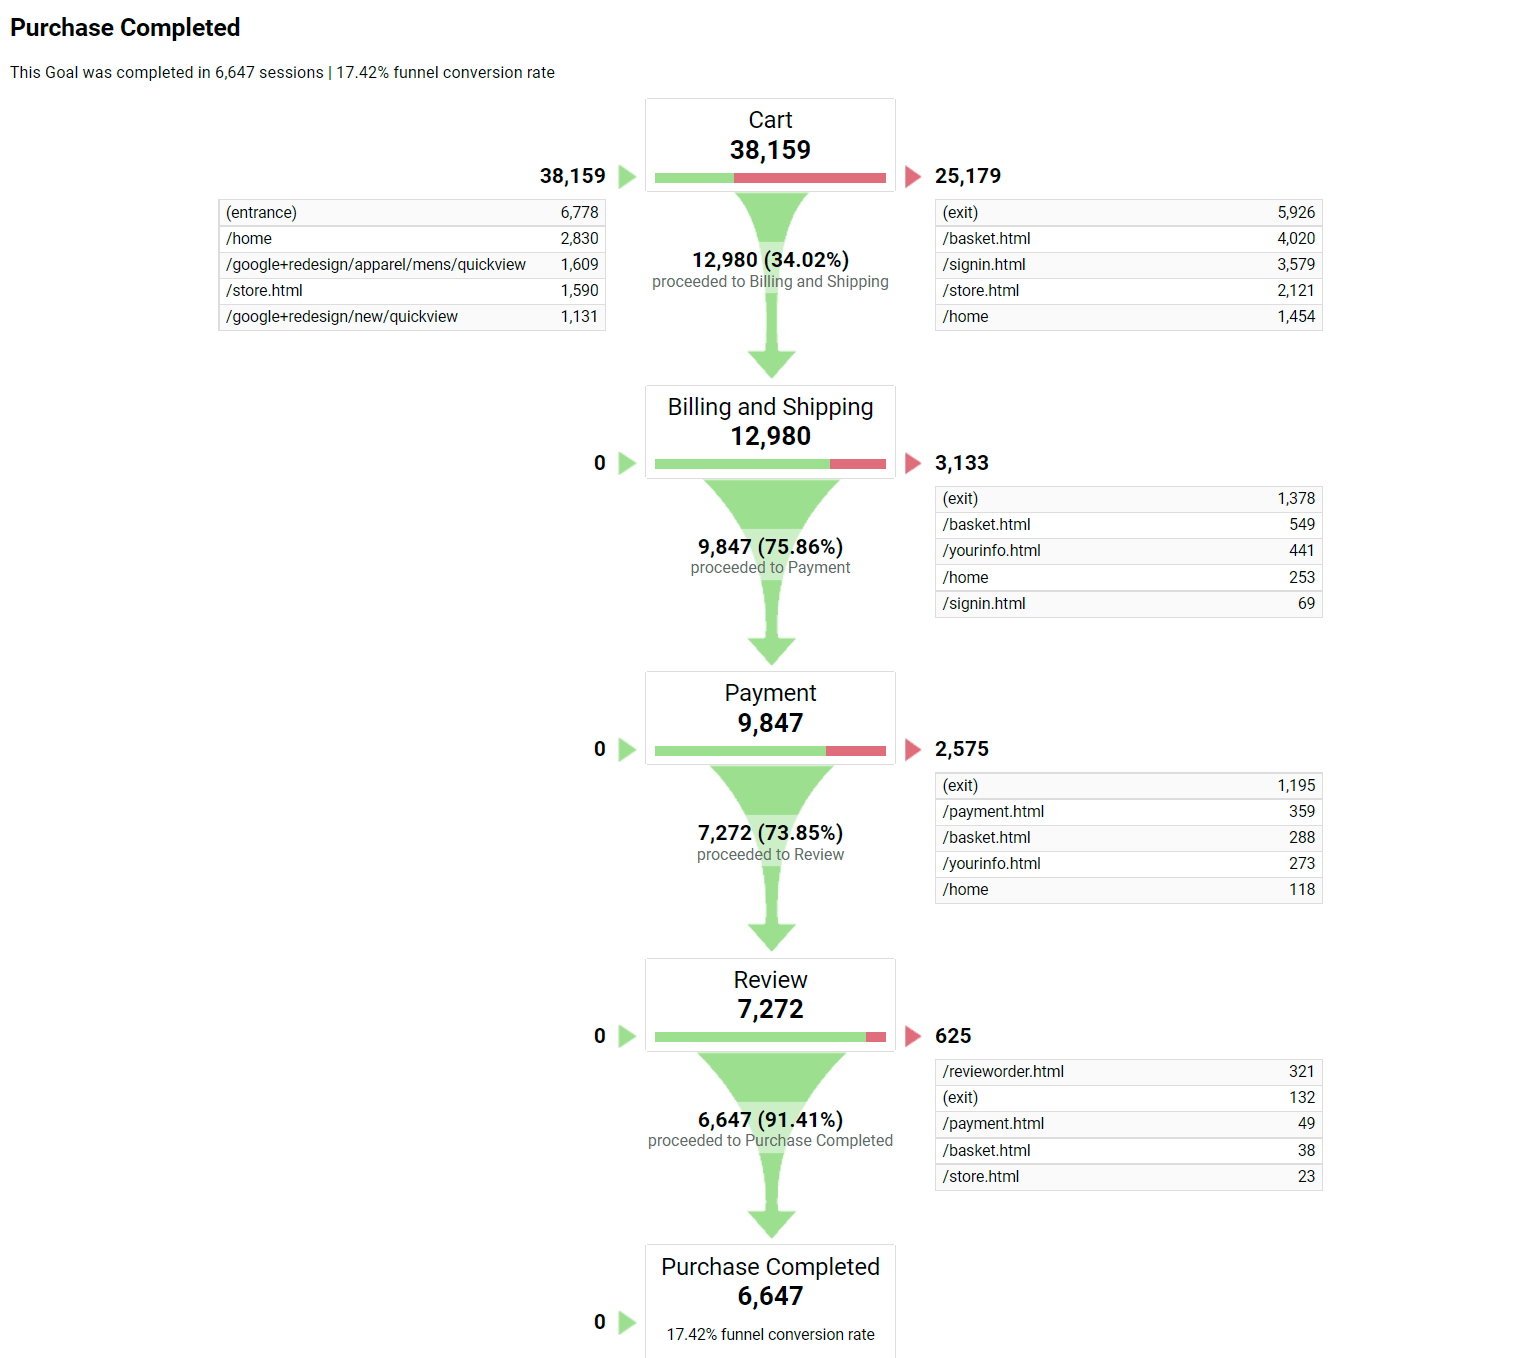
As you can see in the image above, the visualization will show you the conversions and drop-offs between each step, the pages users go to when abandoning the funnel, and the overall funnel conversion rate.
However, there’s a big catch here — this funnel visualization is built entirely on pageviews and sessions. This means that:
- The numbers you see aren’t users, but pageviews and sessions, making the visualization hard to understand and easy to misinterpret. For example, if you see a funnel with a 17% conversion rate (like in the screenshot above), it’s natural to assume that 17% of the users who entered the funnel went through it successfully. But with this funnel visualization, the conversion rate is the number of sessions that completed the selected goal divided by the number of sessions that entered the funnel (not users or even unique pageviews). Due to the common misconceptions, Google has an entire page dedicated to problems with the Funnel Visualization and Goal Flow reports.
- You can only include destination (i.e., URL-based) steps. You can’t include actions like button clicks, text inputs, or anything else that doesn’t generate a pageview as a step in your funnel.
These problems make the standard funnel visualization very limited, especially compared to the GA4 funnel exploration tool.
Shopping Behavior and Checkout Behavior funnels (Enhanced Ecommerce)
If you’ve enabled Enhanced Ecommerce for your site, you’ll also have access to these two funnel visualizations.
(Note: Google doesn’t refer to these as funnels, but rather as “Shopping Behavior Analysis” and “Checkout Behavior Analysis.”)
To access them, go to “Conversions” and click on “Ecommerce”. The first funnel we’ll cover can be found in the Shopping Behavior tab.
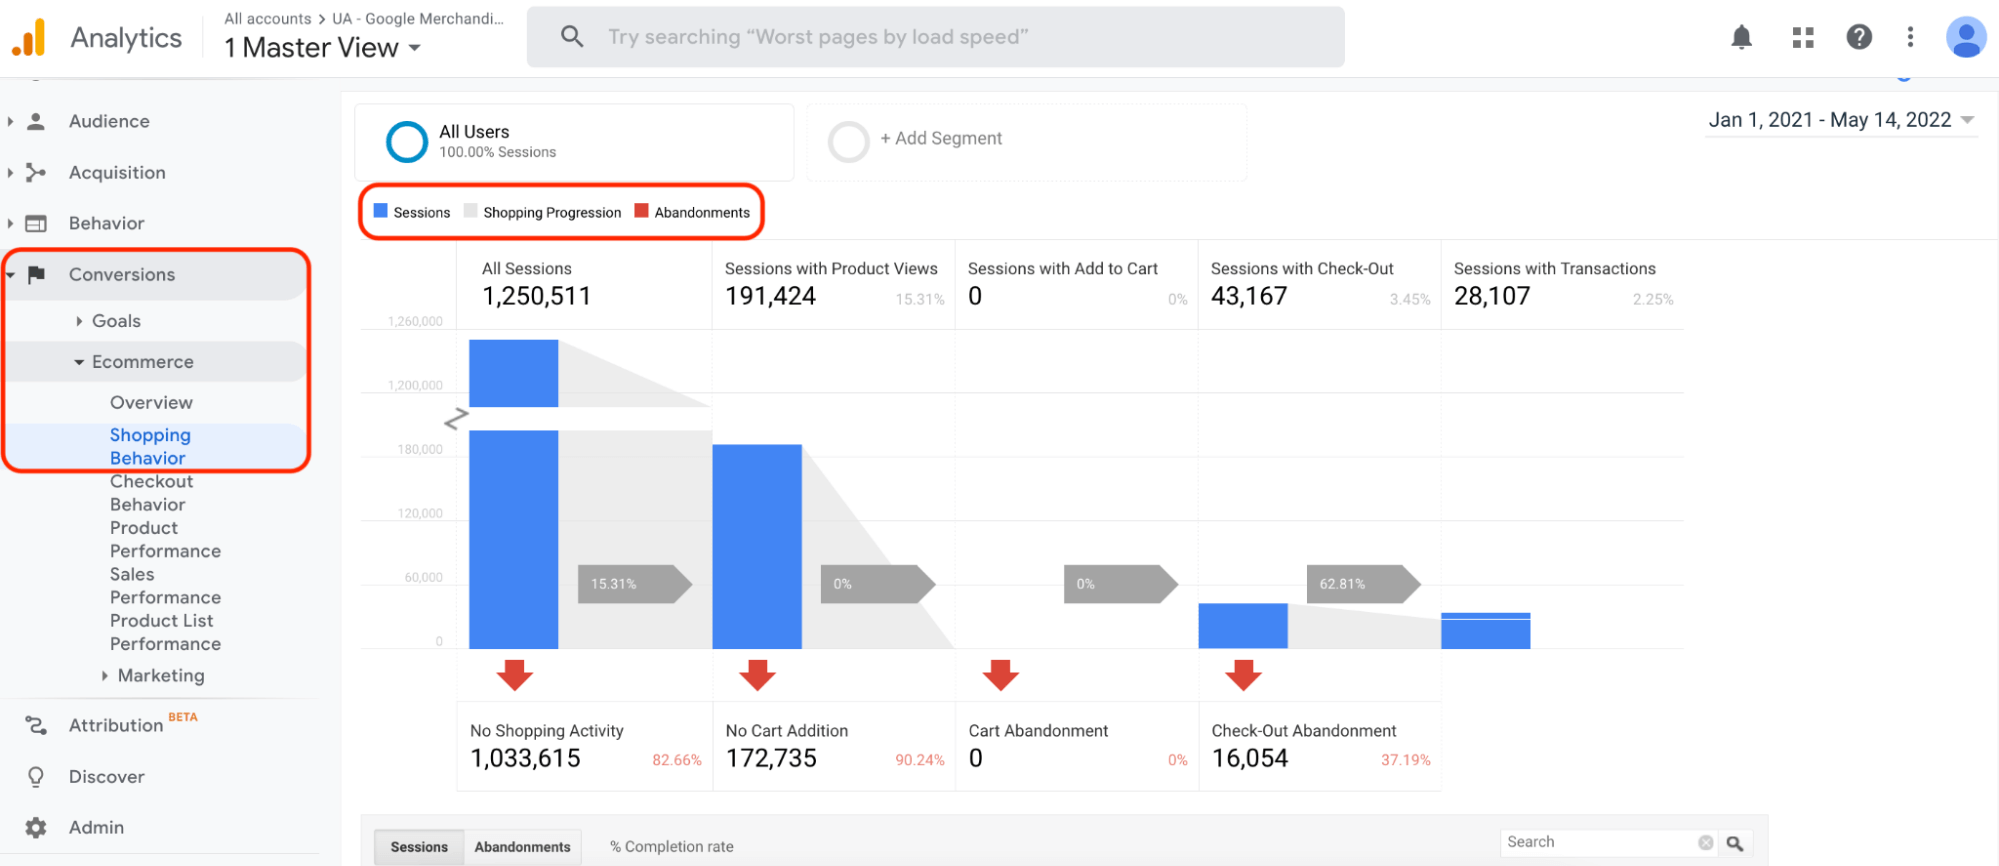
There’s a lot going on here, so let’s quickly break it down.
The blue color represents the total number of sessions at each stage of the funnel.
The shopping progression (the small grey arrow between the steps) shows what percentage of all sessions had a specific action. For example, Step 1 in the funnel includes all sessions on the site, while Step 2 includes only sessions with product views. The gray arrow shows that 15.31% of all sessions included a product view (Sessions with Product Views/All Sessions*100).
The abandonments below each step show the total number of sessions in which users didn’t continue beyond the selected step. For instance, out of the 1,250,511 total sessions in Step 1, 82.66% had no further shopping activity.
The same is true for the checkout behavior funnel visualization, which you can find by going to “Conversions” → “Ecommerce” → “Checkout Behavior.”
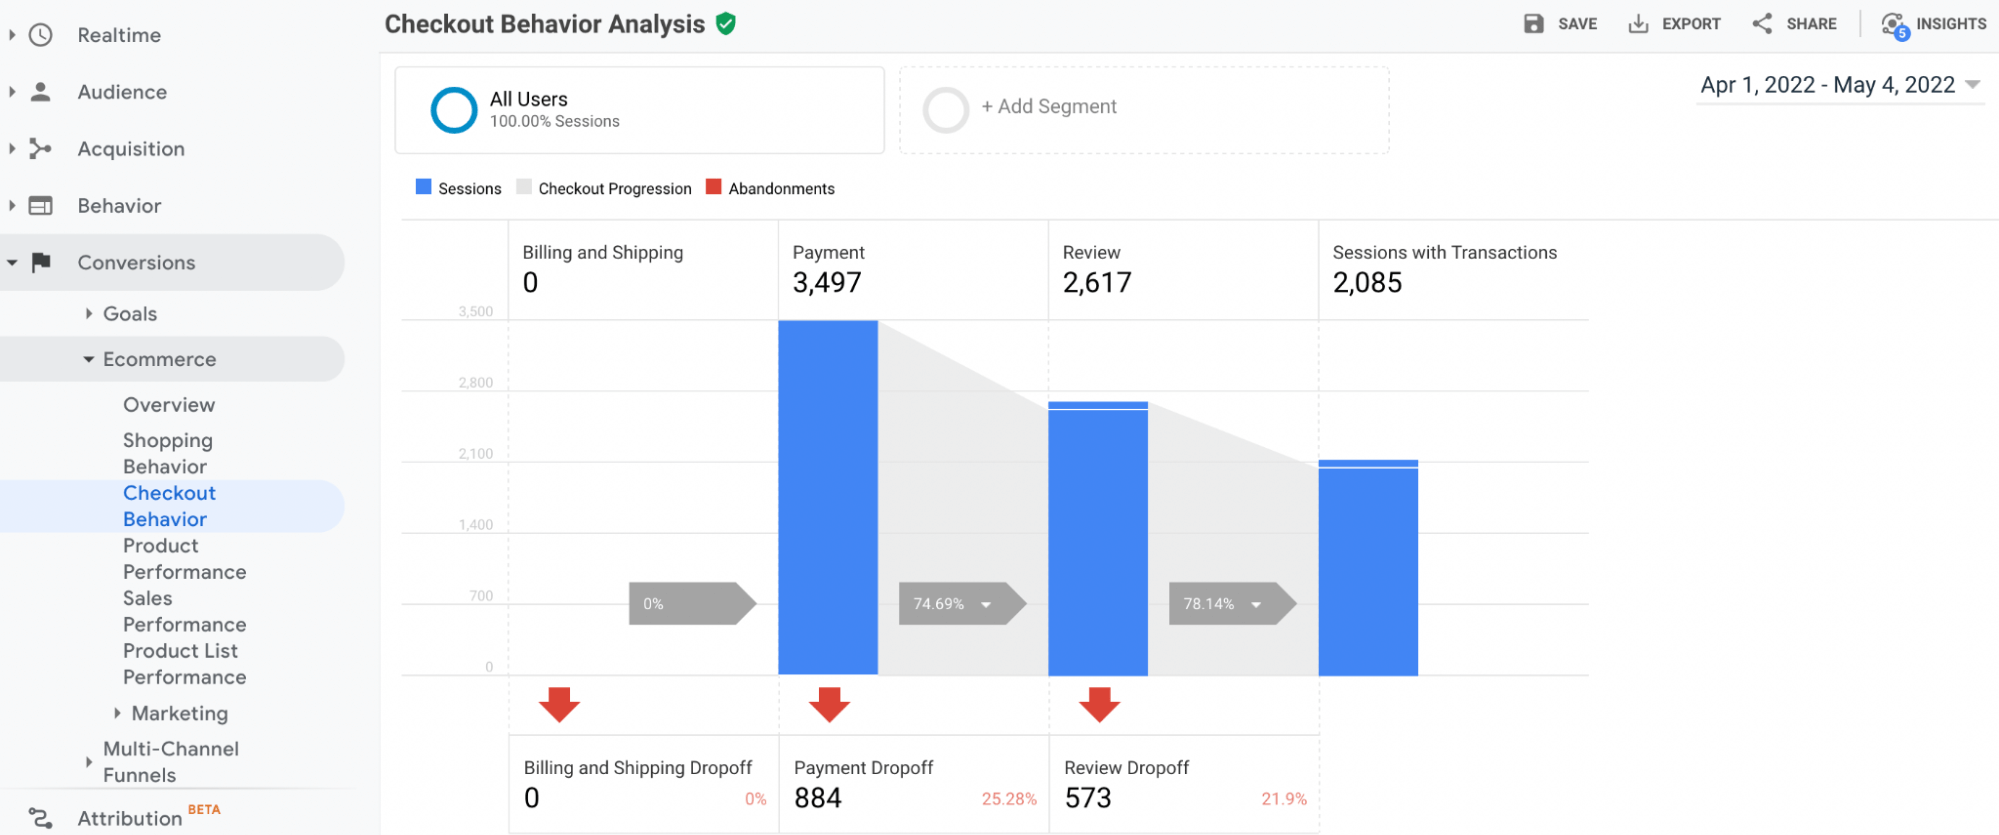
The difference here is that the Checkout Behavior report shows you how successfully your users moved through your checkout process.
For both reports, UA automatically determines the funnel steps based on your tagging. That’s why it’s crucial to send the correct types of e-commerce data. Even for a skilled developer, it can take multiple rounds of implementation and testing to make sure the tags send the right data.
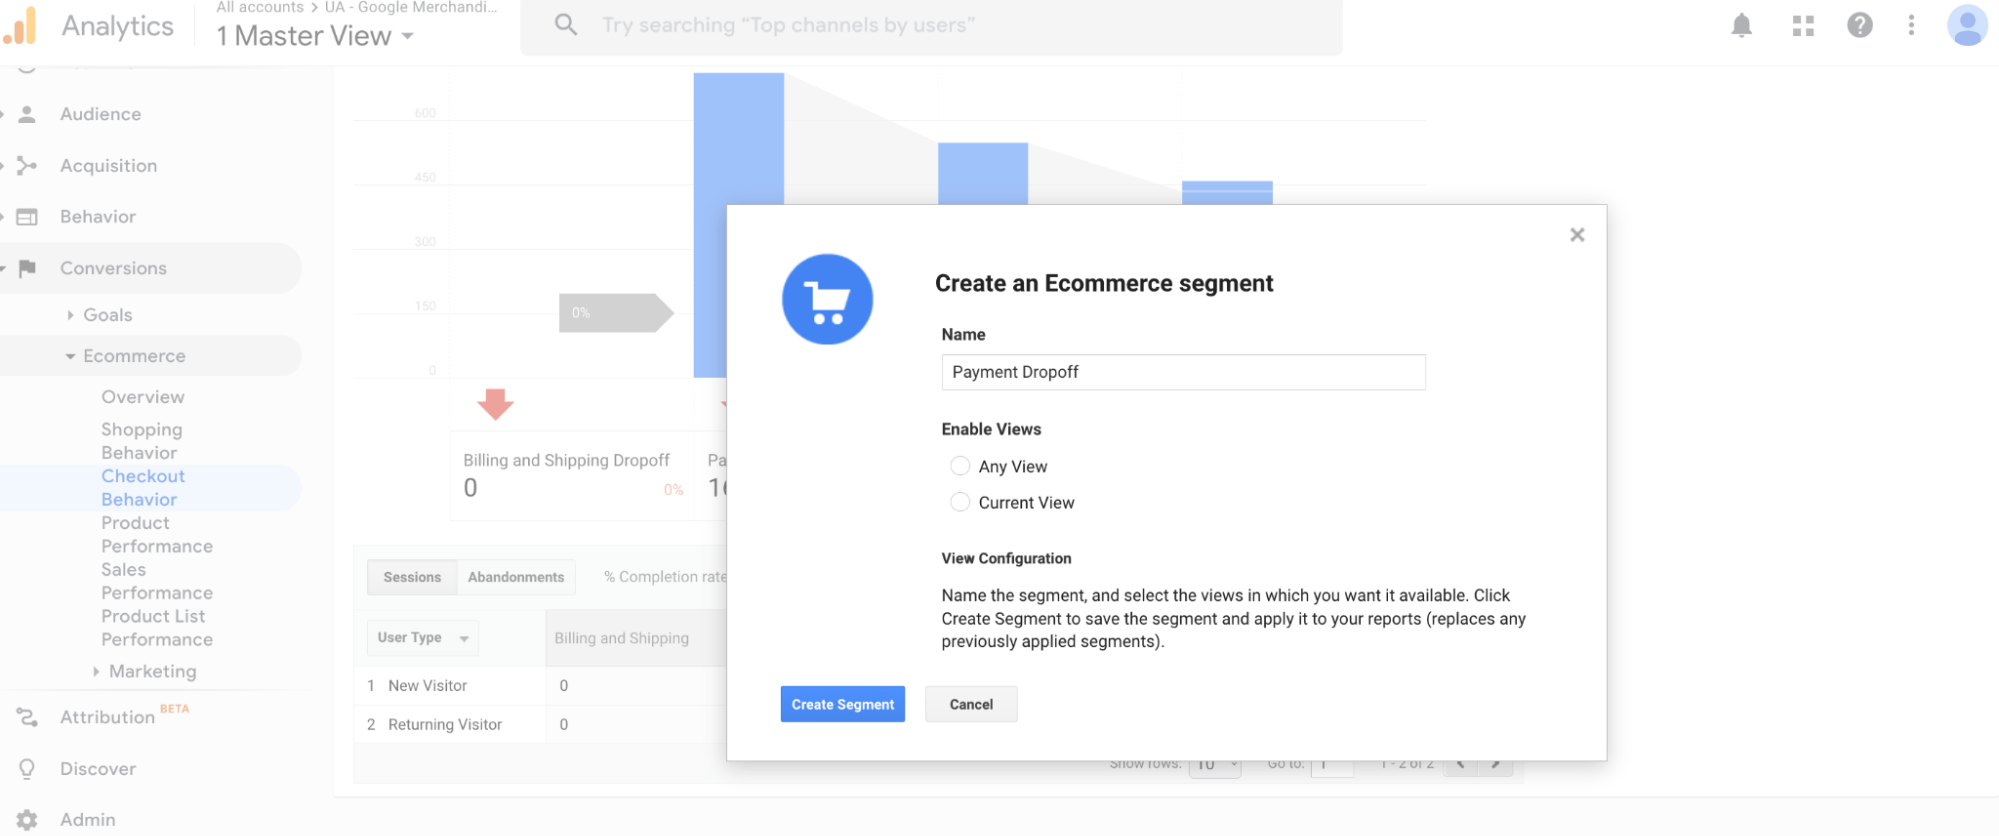
One cool functionality these reports offer is the ability to build segments of users from specific steps in the funnel. For example, you can click on the drop-off arrow under a step to create a new Ecommerce segment. You can then use this segment of dropped-off users for remarketing via Google AdWords.
Now, while these two funnels are more useful than the standard visualization, they’re really difficult to set up. Implementing enhanced e-commerce requires an experienced developer who’s familiar with Google Analytics and specifically familiar with ecommerce tagging.
Funnel exploration in Google Analytics 4 (new version)
As with many other features, GA4 completely revamped the funnel analysis experience in Google Analytics.
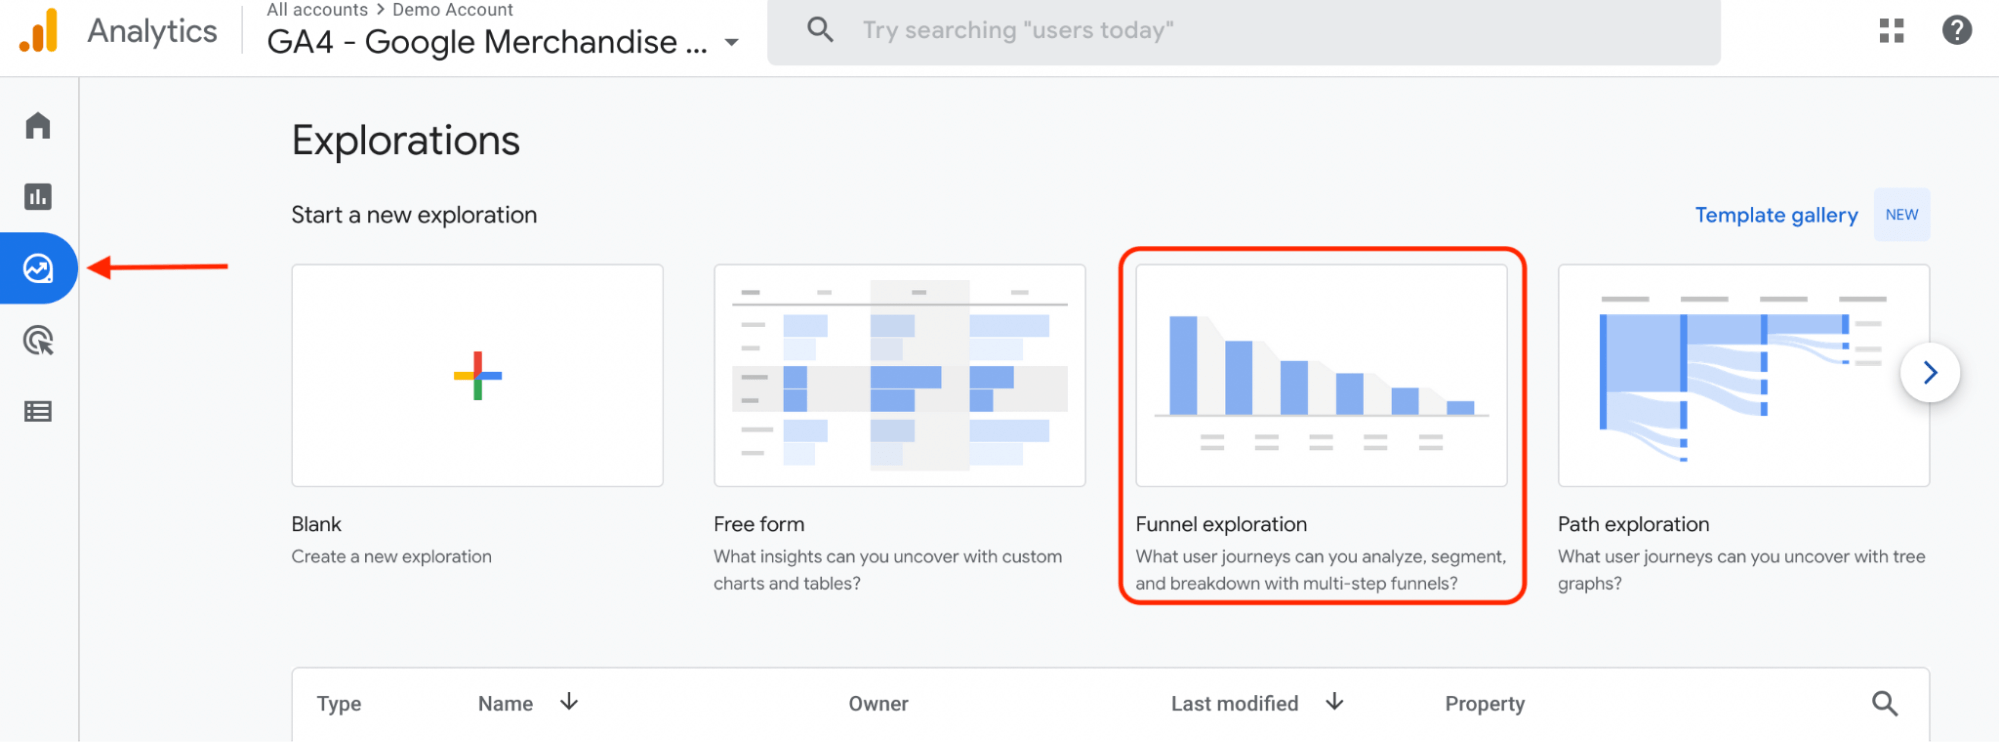
You can find the new GA4 funnels by clicking on “Explore” and going to “Funnel exploration.”
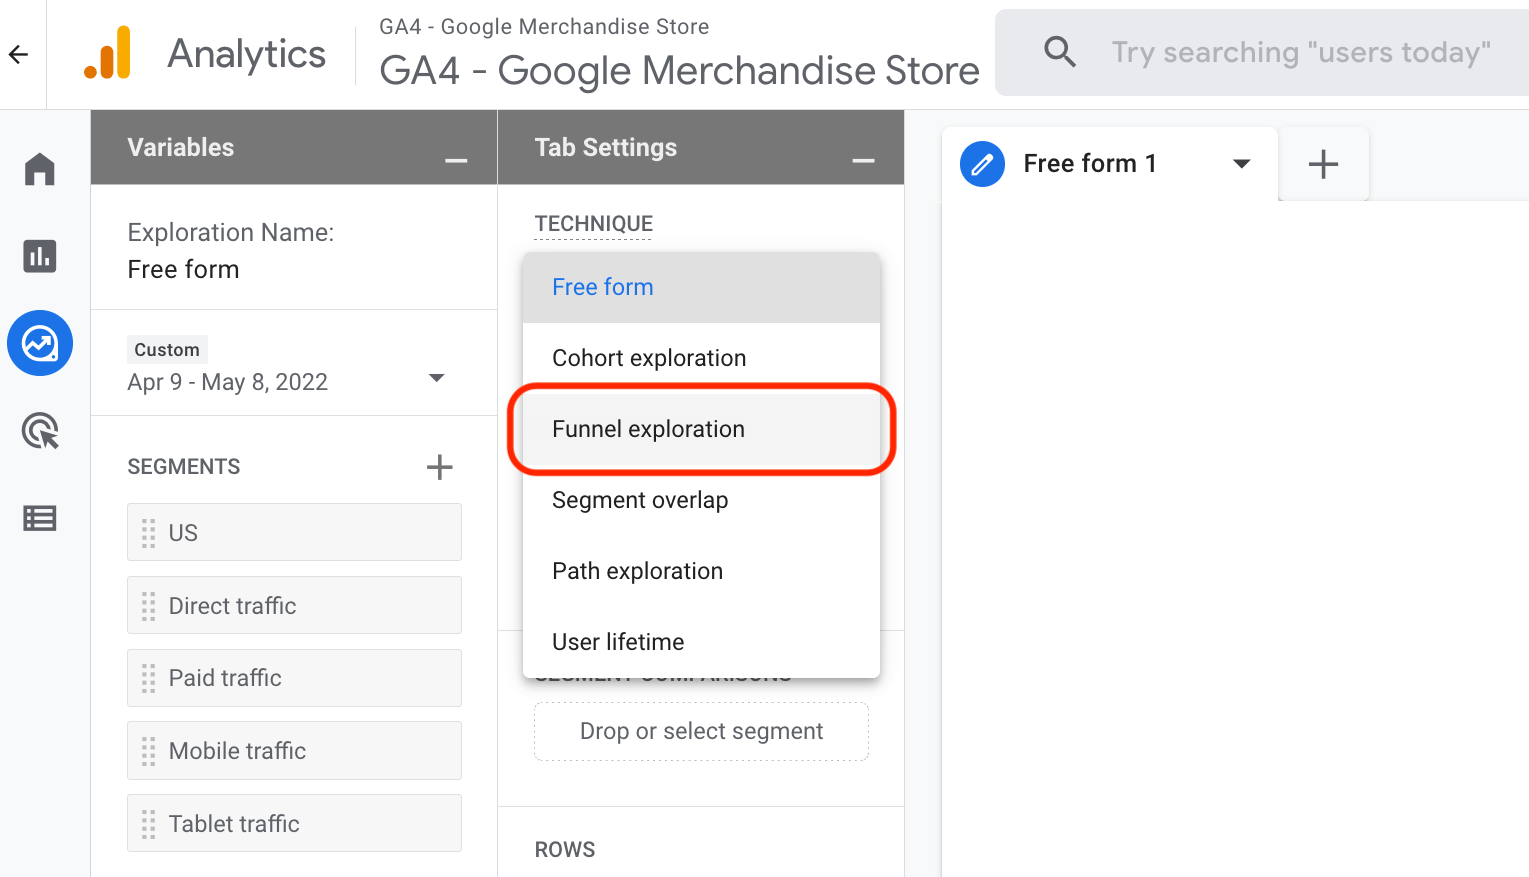
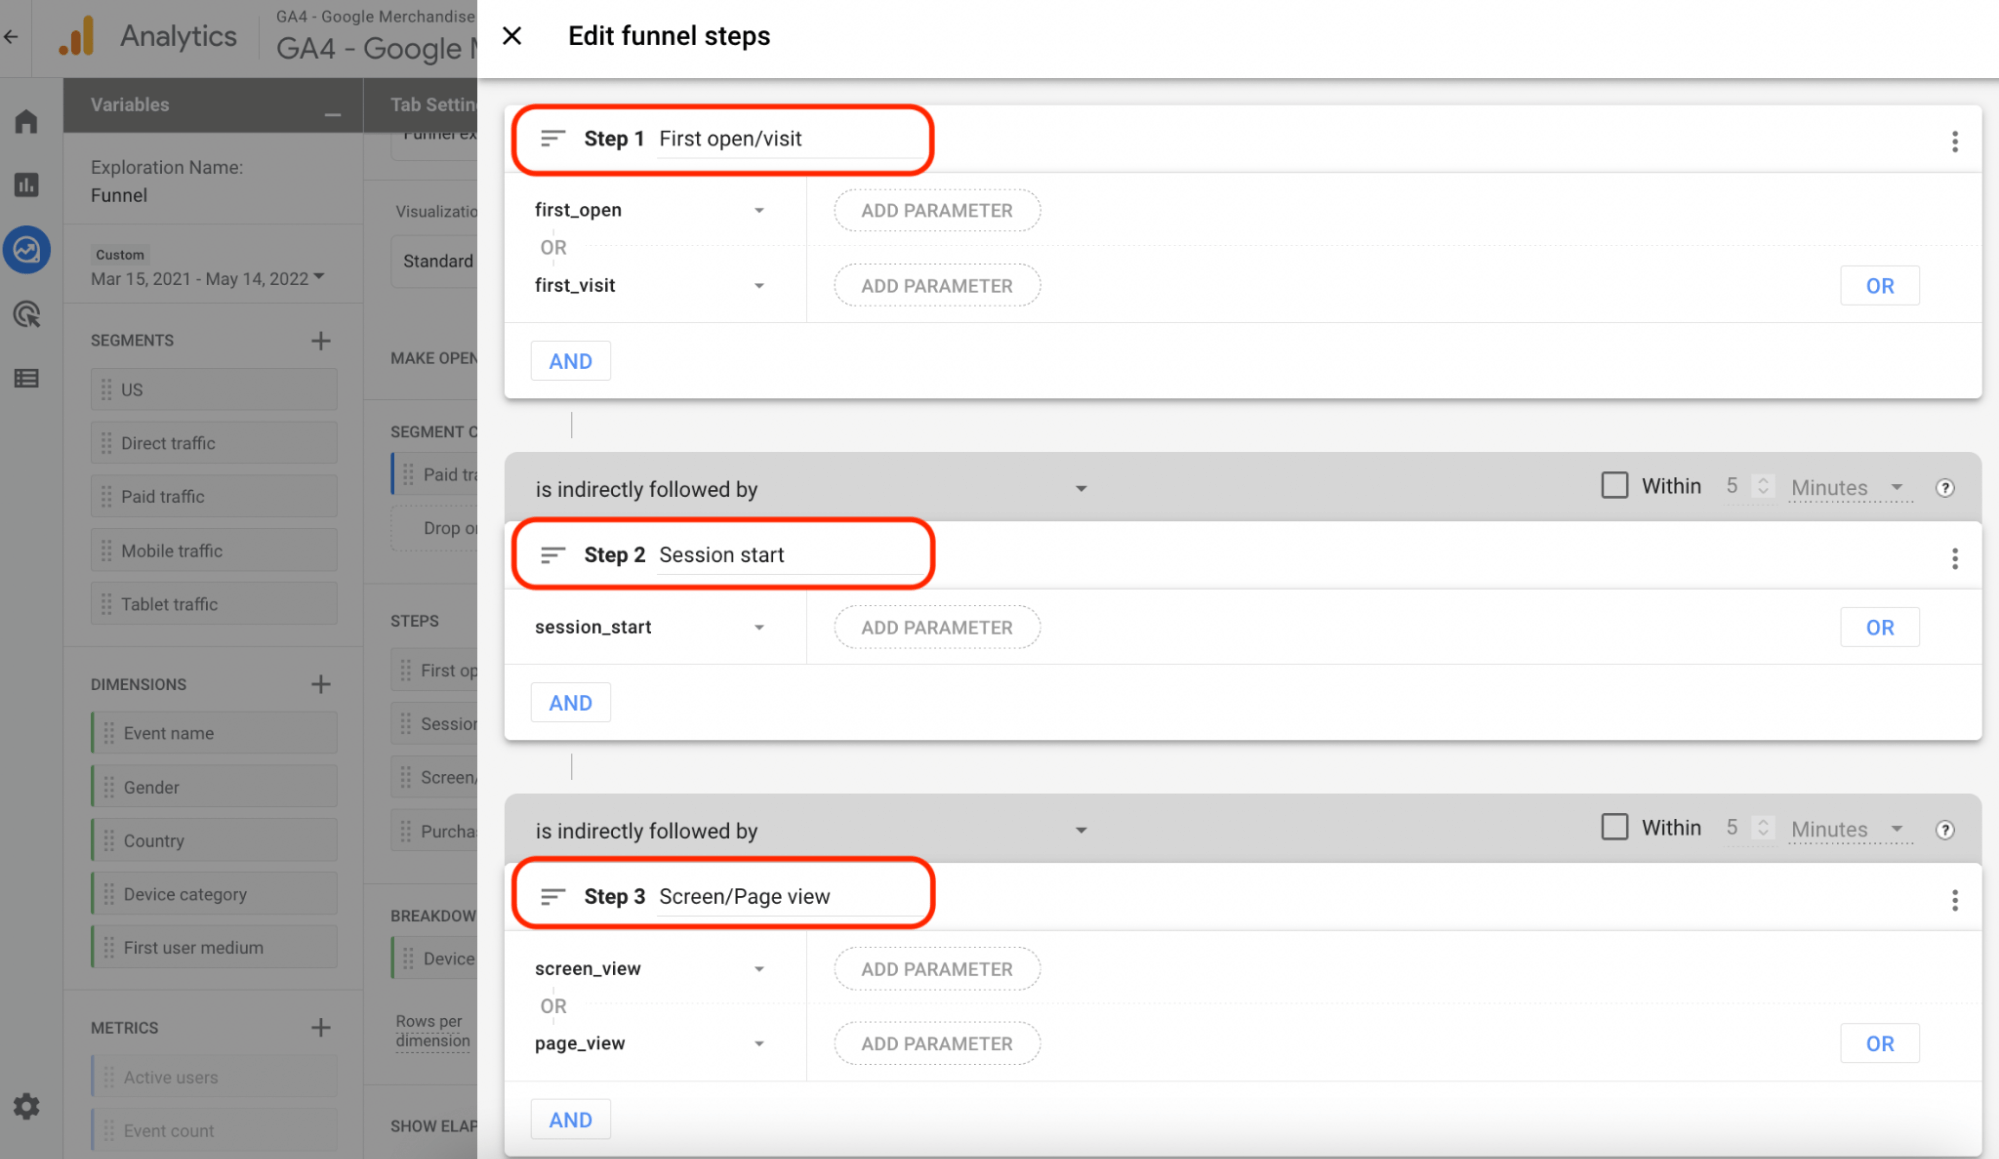
If you haven’t built a funnel yet, you’ll need to start from scratch. To do so, click on “Free form” and select the “Funnel exploration” technique.
Then, add steps in your funnel in the order you believe your users follow.
Since everything in GA4 is tracked as an event, the different funnel steps are typically made up of events — pageviews (i.e., URL visits), session starts, video plays, etc.
It’s worth noting that not all user interactions are automatically tracked by GA4. For example, GA4 doesn’t automatically track clicks that don’t lead away from the domain as events. If you want an inbound click (e.g., a click that leads users to your pricing or product page) to be a step in your funnel, you’d have to create a custom event and wait for enough data to roll in.
Once you’ve added the steps that make up your funnel, you’ll see a visualization similar to the one below.
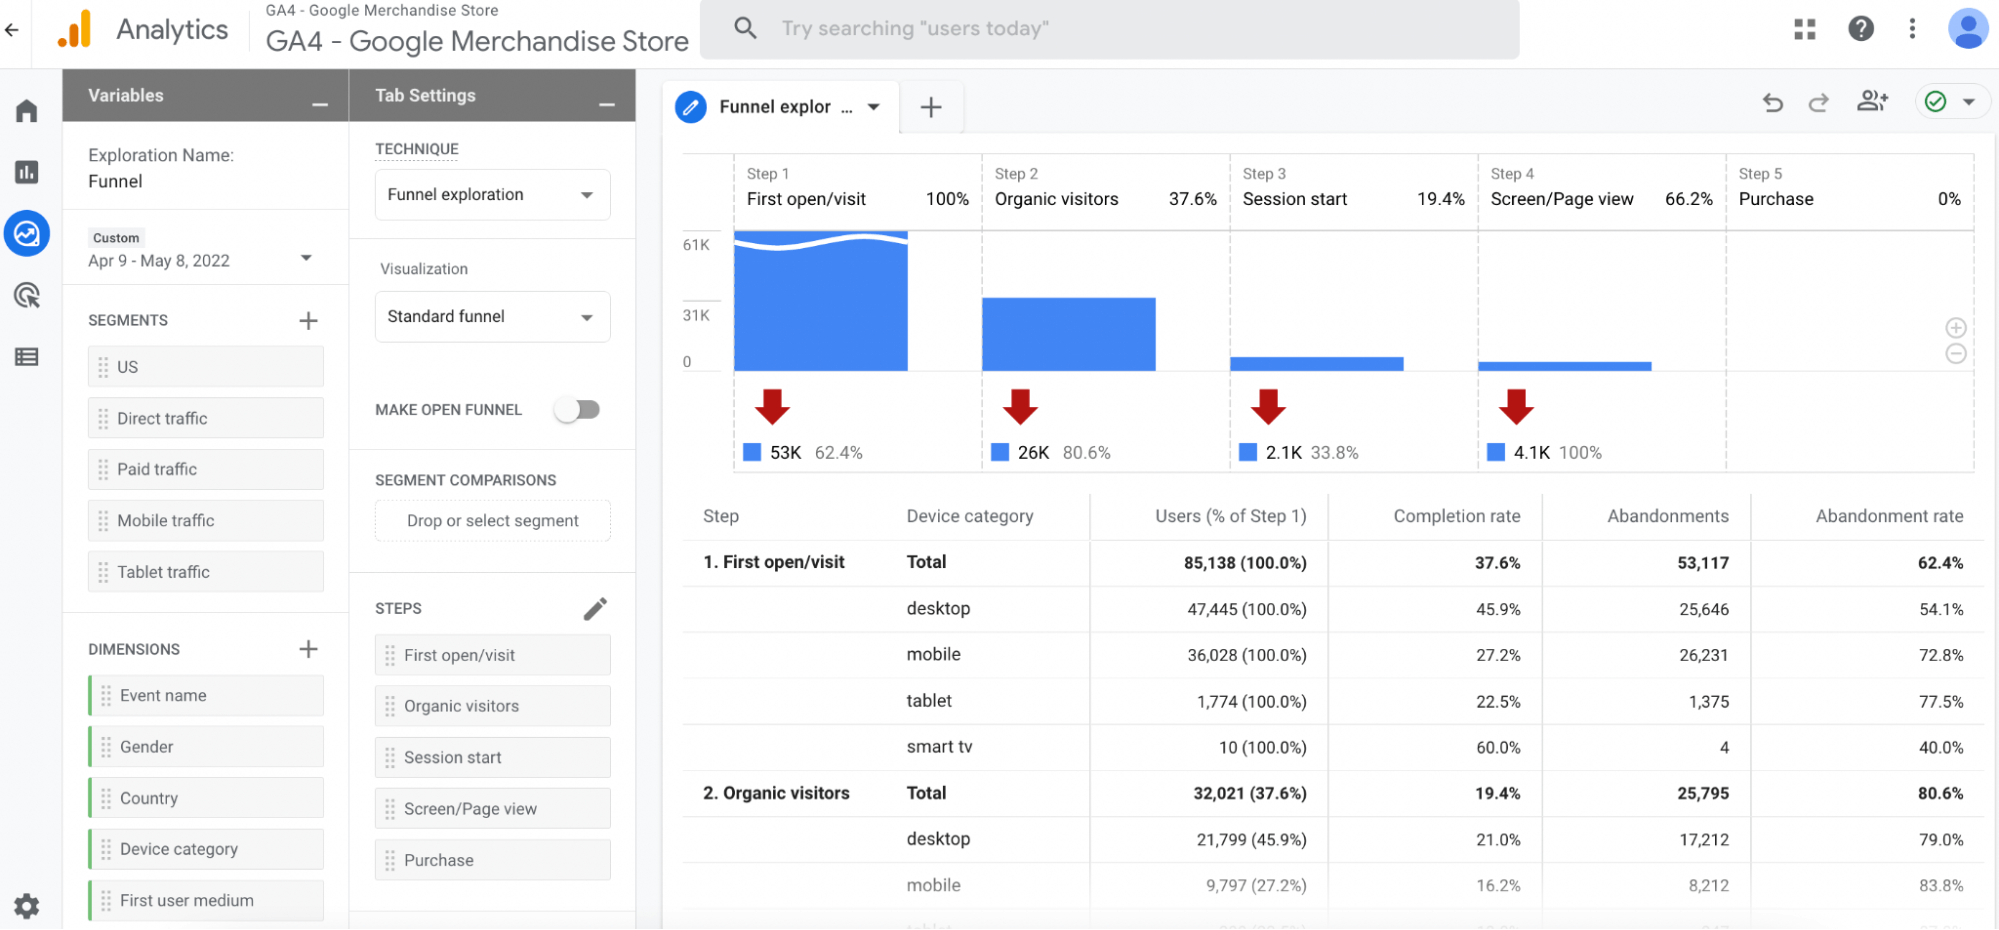
Let’s quickly break down what’s happening here:
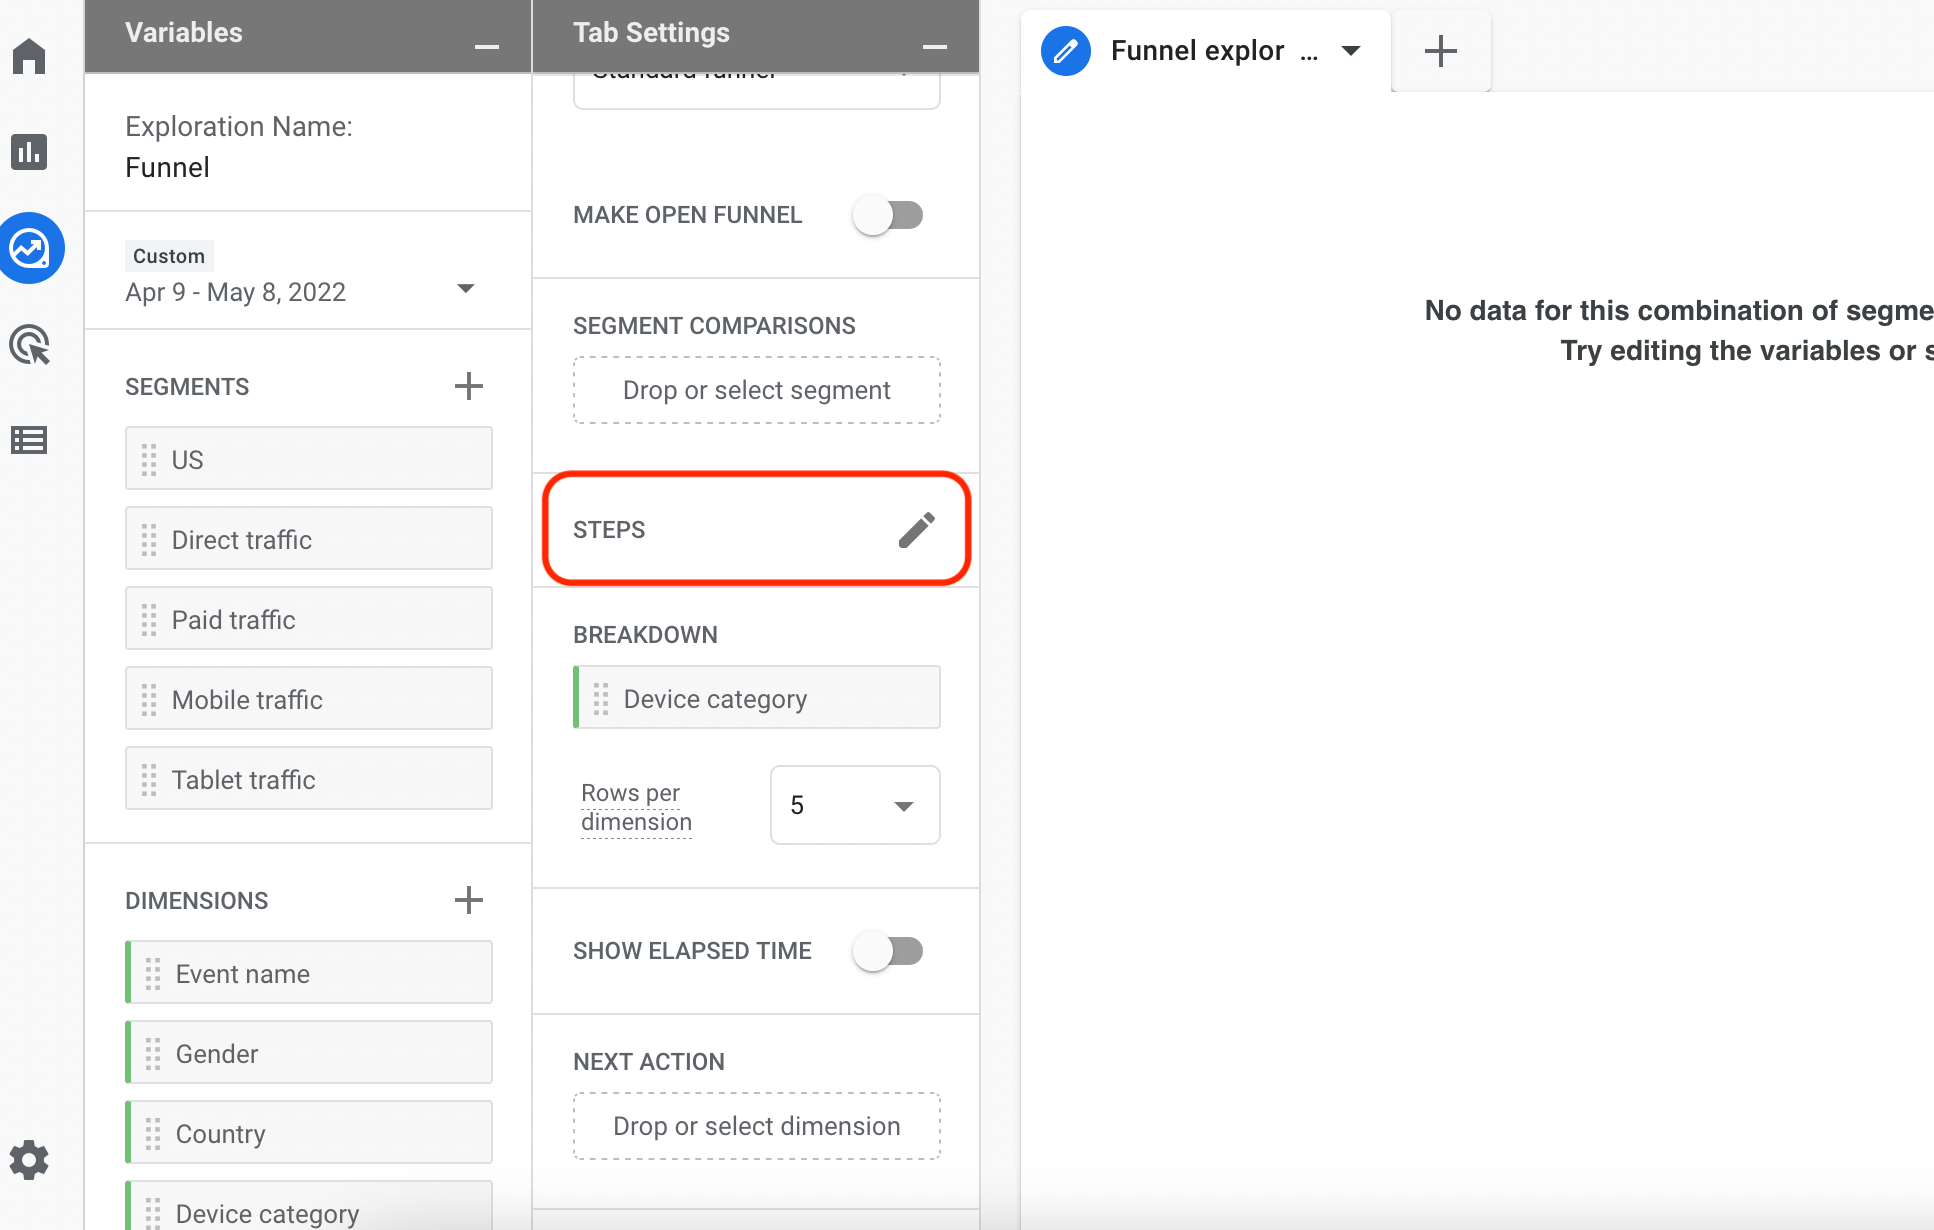
To the left (under “Variables”), you can see the date range, segments, and dimensions. Segment comparisons can show you how different categories of users behave in your funnel. For example, you can compare direct and paid traffic, as in the screenshot below.
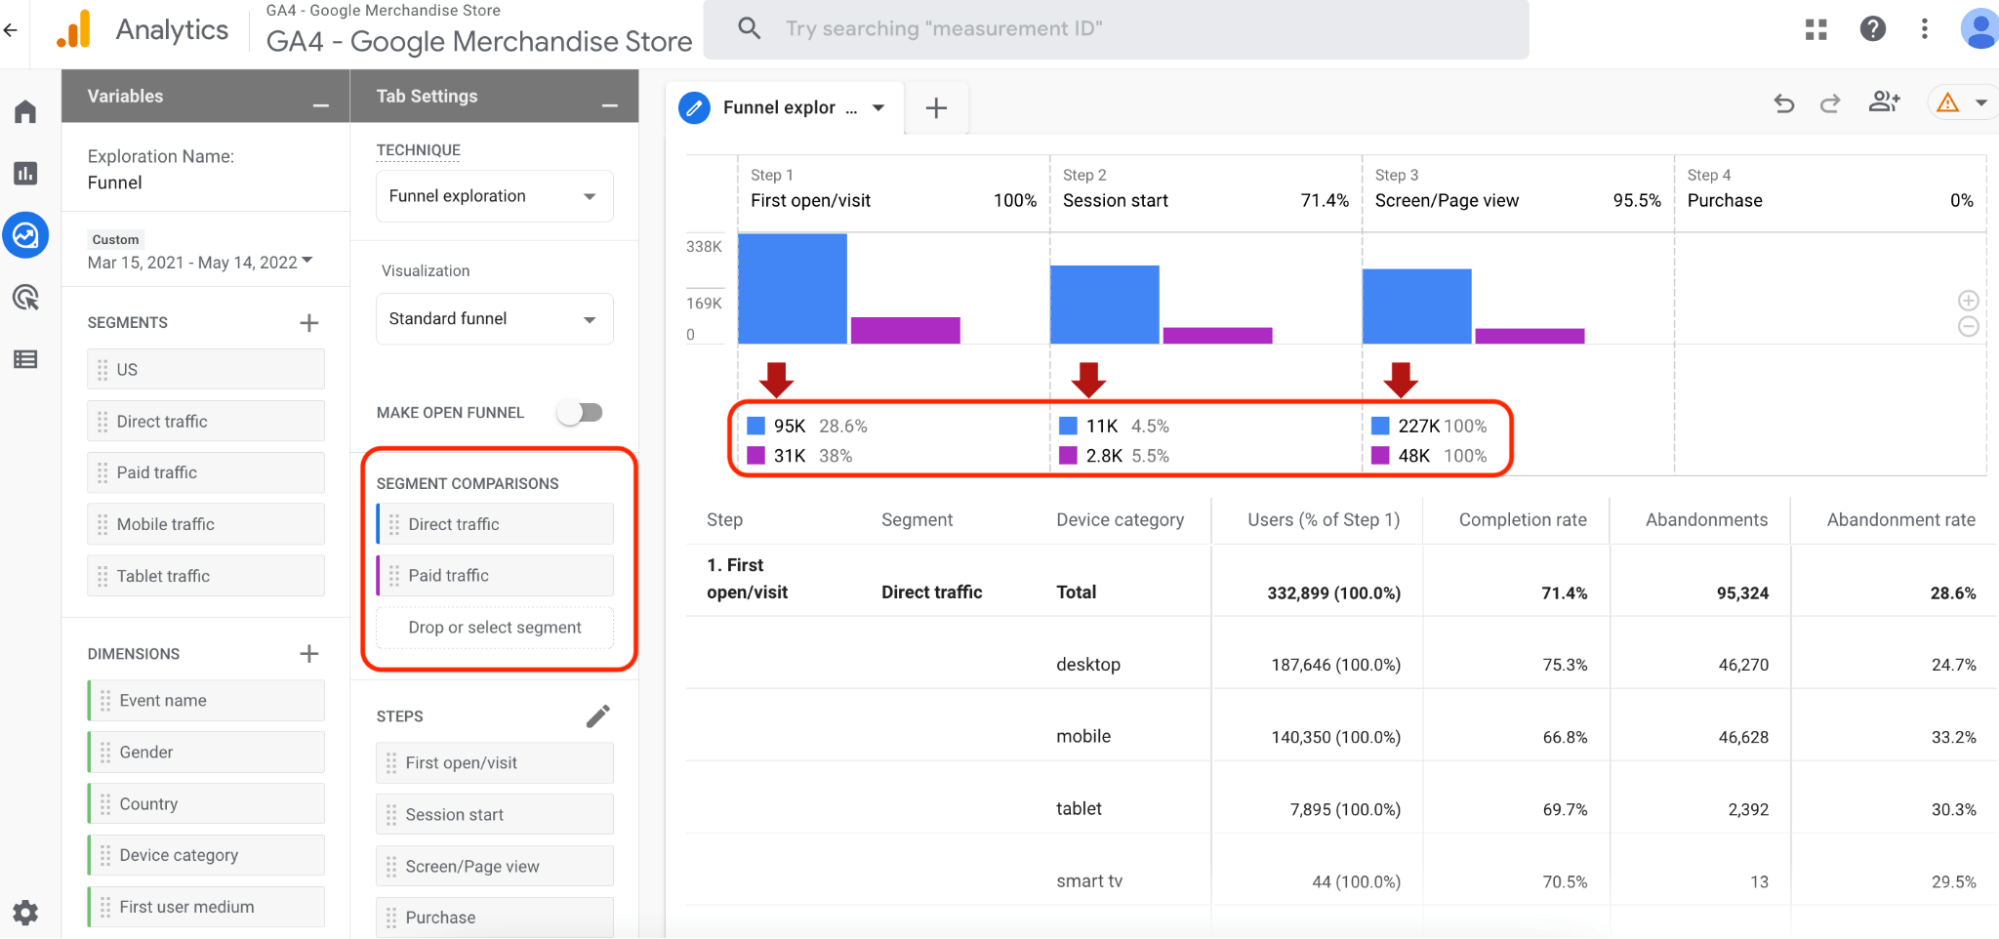
Dimensions allow you to further customize your analysis by including attributes that describe something (e.g., an event, user, product, etc.)
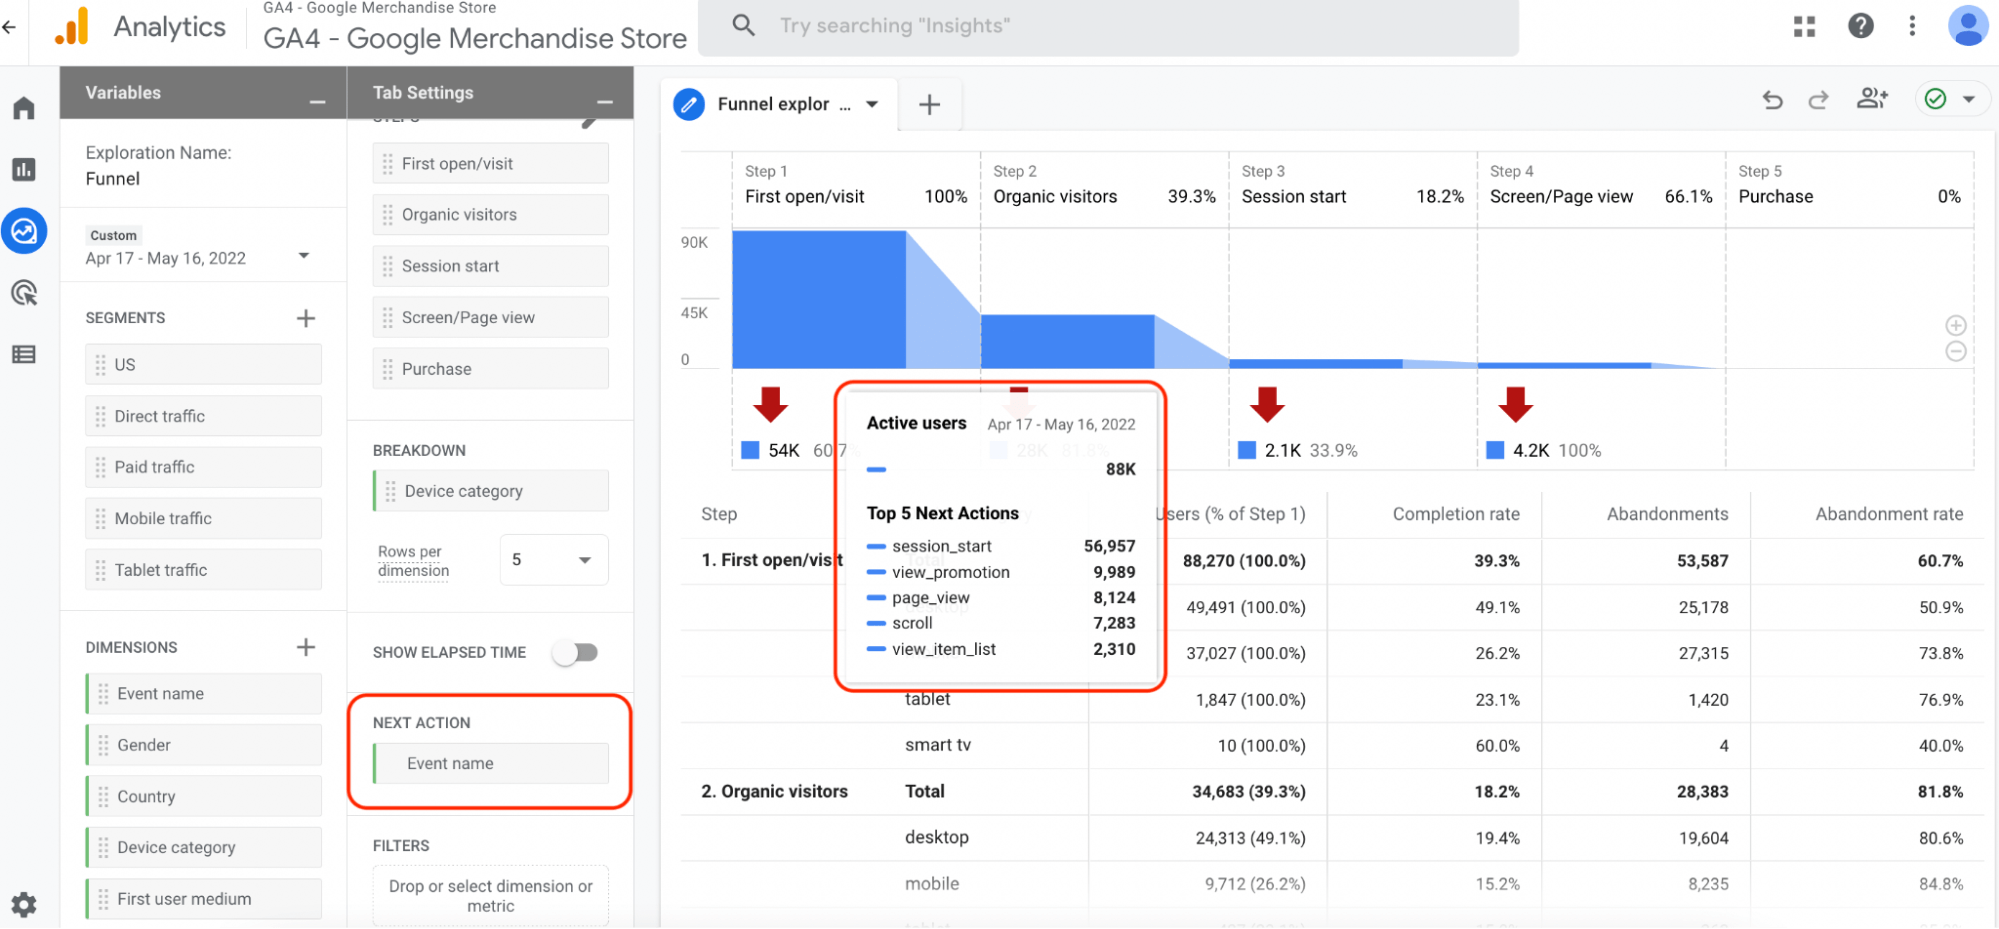
Most of the screen is taken up by the actual funnel visualization. As you can see in the image below, the visualization is pretty intuitive — you have the number of users who completed each step, the conversion and drop-off rates between steps, and a chart with additional data and metrics below.

Now, besides this standard view, GA4 can also display the funnel data as a trended visualization.
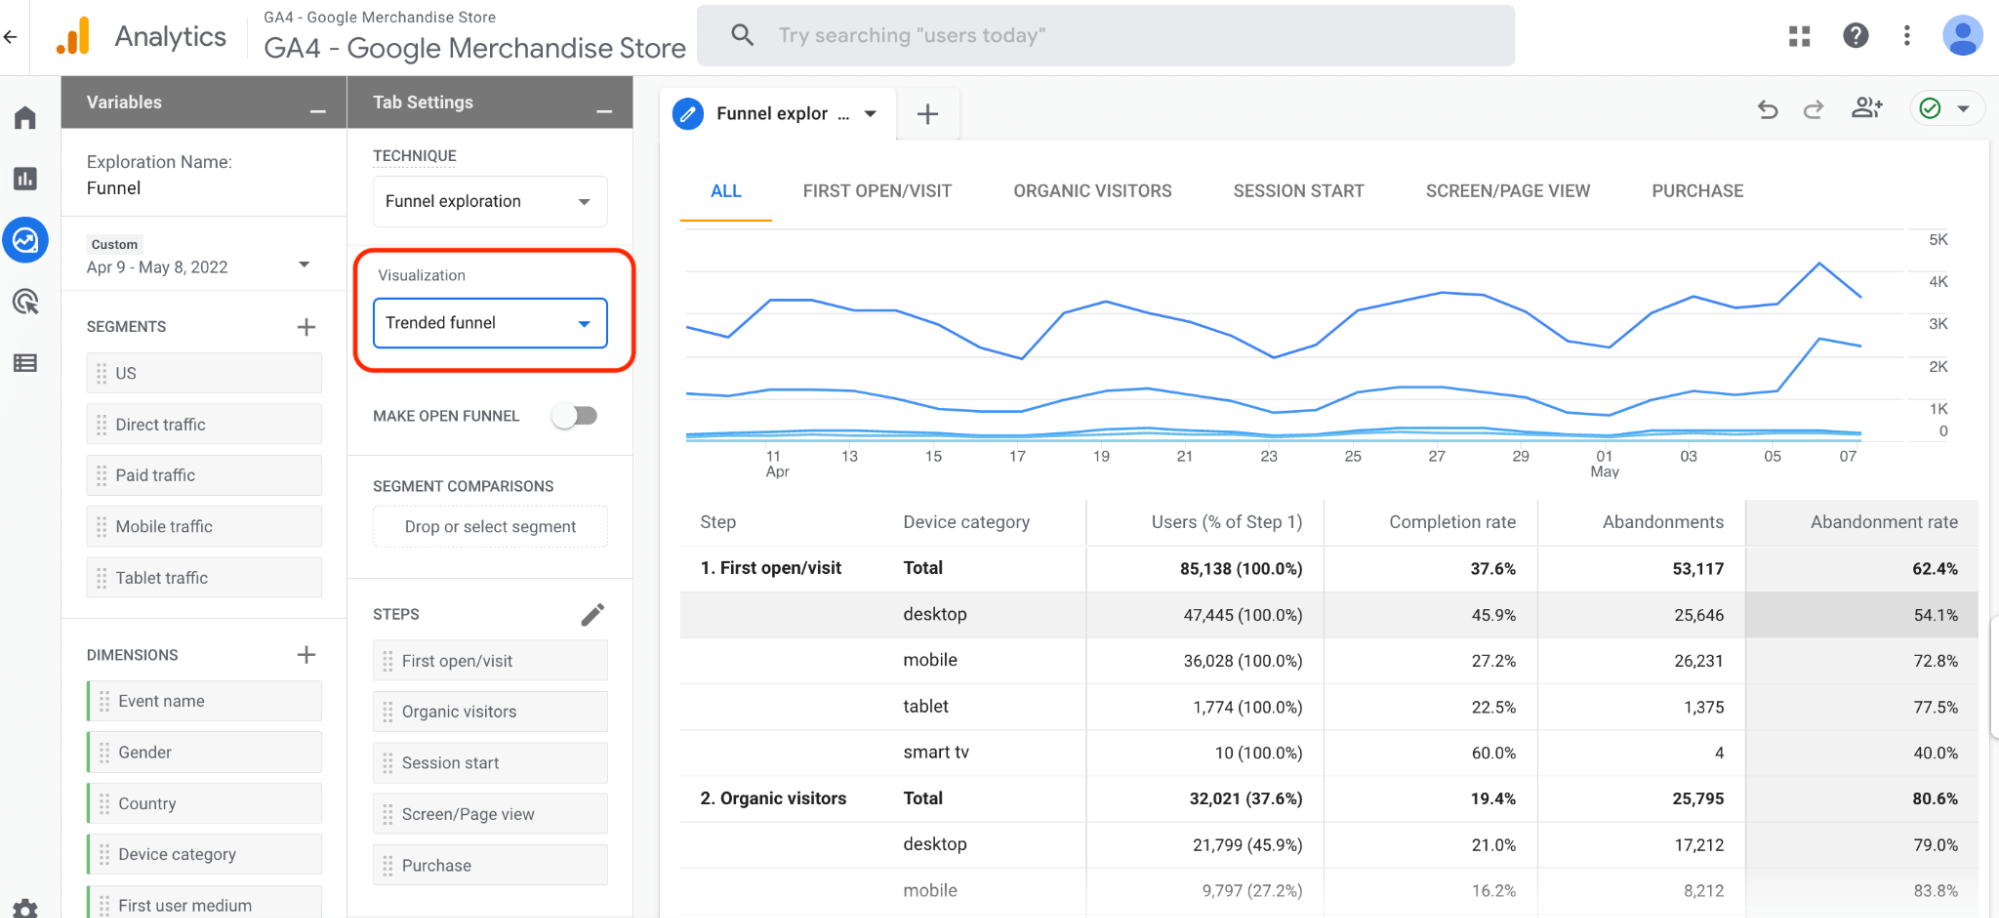
With trended funnels, each step gets its own line chart, instead of being bundled together. This makes it easier to see and compare the occurrence of each step over time.
Another important option is to choose whether your funnel should be open or closed by using the “Make open funnel” toggle (in the “Tab Settings” field).
By default, GA4 creates closed funnels, meaning users must enter the funnel in the first step. If they enter at any other step, they won’t be counted. In open funnels, users can enter at any step and will be counted.
Lastly, the new funnel exploration tool can show you the top five actions users perform after completing a specific step. Click on the “Next Action” option and “Event name” as the dimension. Then, when you click on a funnel step, GA4 will show you the top five actions that users perform after that step.
You can learn even more about the new funnel exploration tool in GA4 and how to set them up in the video below:
The limitations of doing funnel analysis in Google Analytics
As we said at the start, working with Google Analytics funnels comes with a huge limitation — you can only see where users drop off but not why. This makes it hard to understand the problems that hurt your conversion rates or how to fix them.
For example, the GA4 funnel below shows that only 23% of the users who added an item to their shopping cart actually completed their purchase.
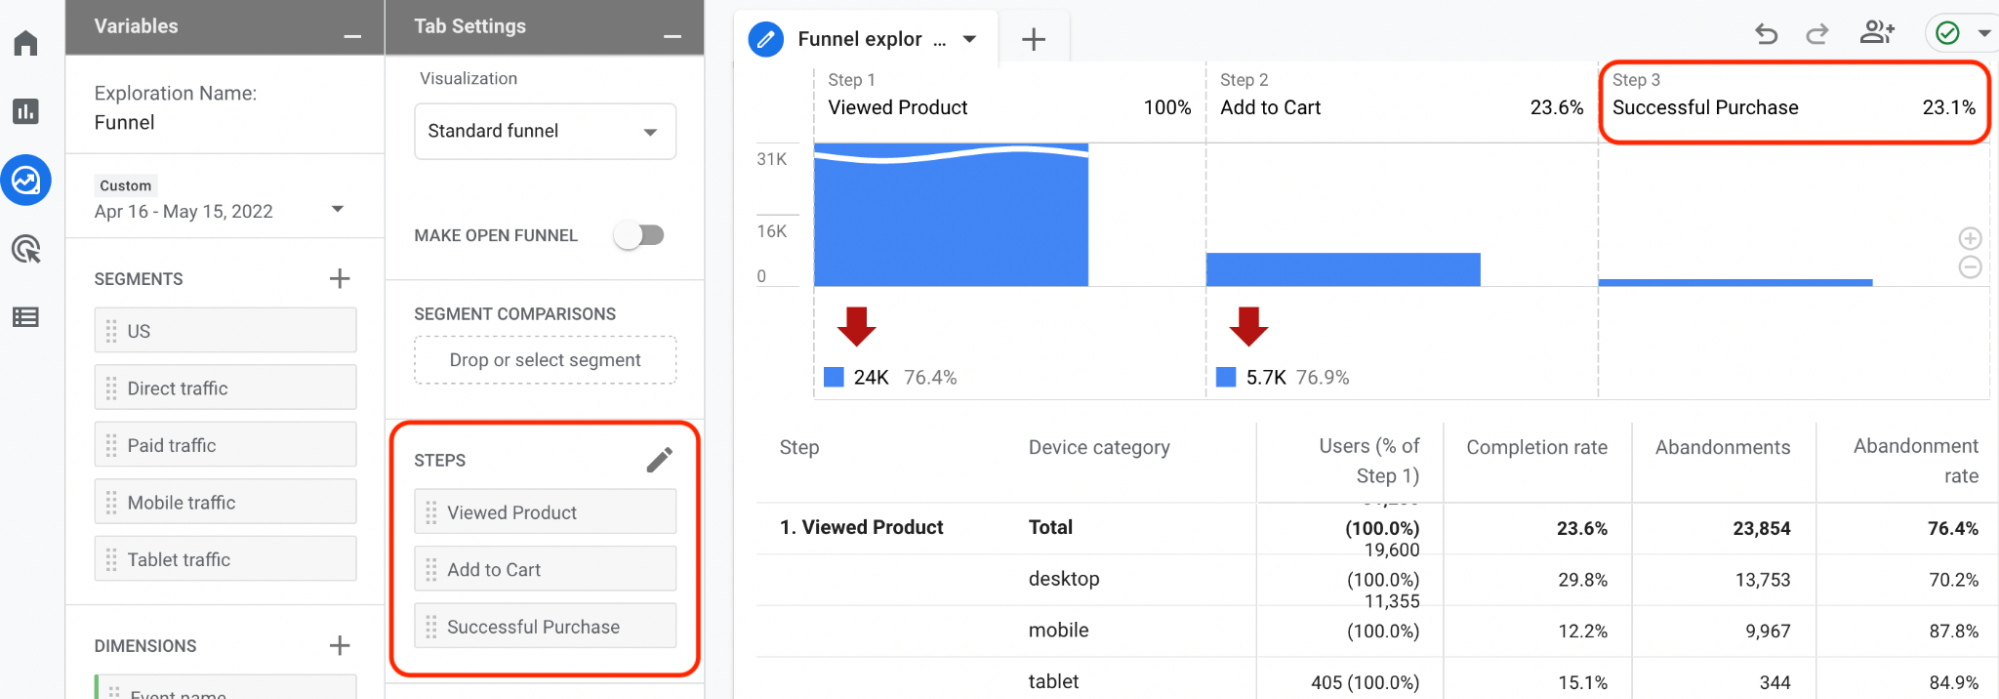
The problem is, you have no way of knowing why the other 77% didn’t. You can try to go through the purchase process, make a list of hypotheses, and run A/B tests to see if the abandonments drop. However, if you guess wrong, you lose time and resources, while problems that affect your conversions remain undetected.
Additionally, if some steps in your funnels are based on events that aren’t tracked automatically, you’ll have to create custom events and start waiting for data collection.
The event tracking setup in Google Analytics usually requires a developer and the use of an extra tool (Google Tag Manager). And, since Google Analytics starts collecting data for a specific event after you set up tracking for that element, you may have to wait days or weeks for data to accumulate. During that time, drop-offs that affect your revenue can’t be addressed.
Fortunately, Smartlook helps you overcome both problems by:
- Allowing you to combine funnel analysis with session recordings to find out why users drop off, and
- Automatically recording all user interactions and letting you build event-based funnels without coding or needing a third-party tool.
In the following sections, we’ll show you how to take advantage of these capabilities.
How to find why users drop off and stop losing conversions by combining funnel analysis with session recordings
With Smartlook, you can analyze funnels with the help of session recordings (sometimes called session replays). Session recordings show you users’ real-time behavior during every traceable step of their online session. Using them in combination with your funnel analysis helps you find out why users drop off.
Here’s how.
The image below shows a three-step checkout funnel. We’ll show you how to build this funnel without coding in the next section, but for now, let’s focus on the drop-offs.
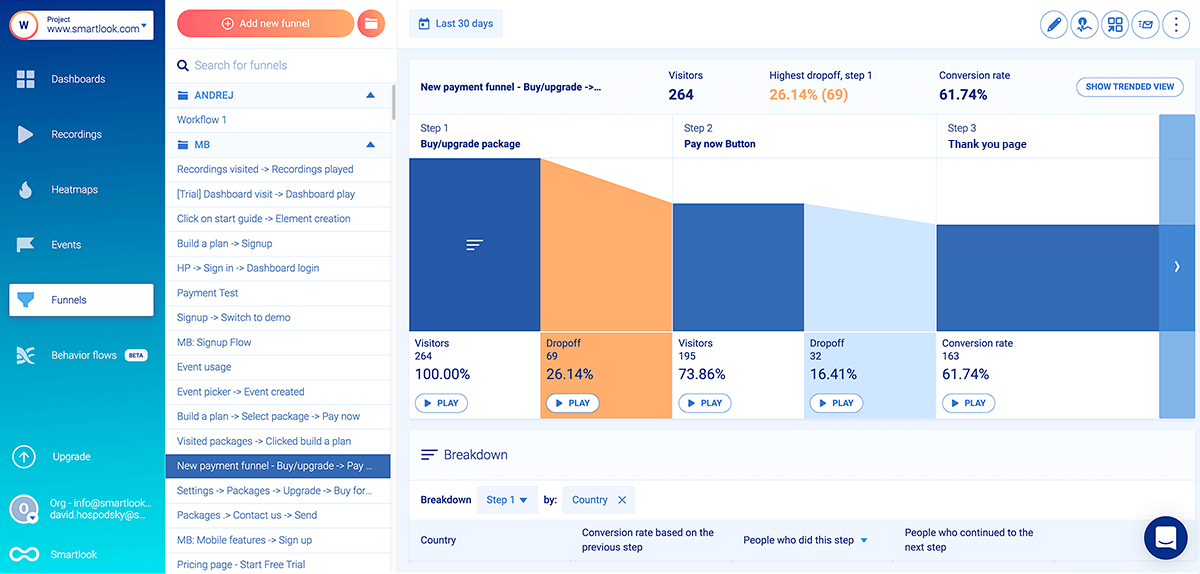
As you can see, 32 (16.41%) of users dropped off between clicking “Pay now” and arriving on the “Thank you” page. This shouldn’t be happening — if users selected a product, entered their info, and clicked on “Pay now”, they want to buy.
Now, if you were using Google Analytics, you’d have to start guessing what went wrong. This means going through the process yourself to try and find the issue or contacting a developer to check if there’s something wrong with the setup.
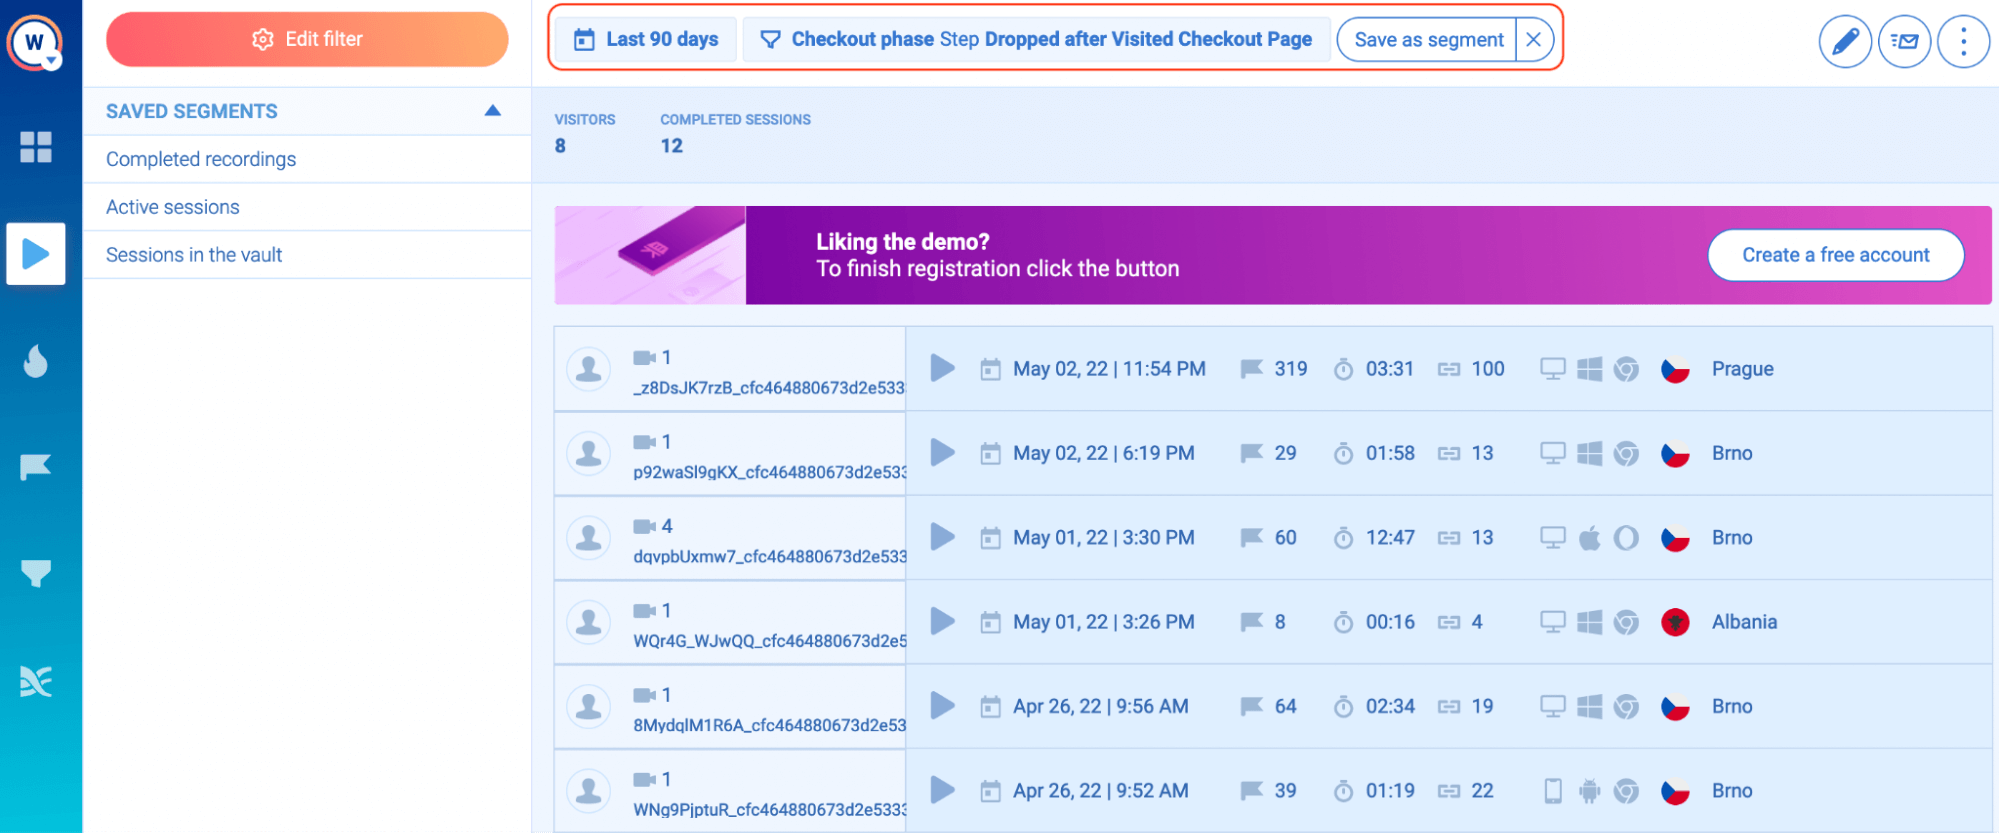
However, with Smartlook, you can watch the session recordings of users that dropped off and see their entire experience.
As you can see in the screenshot above, there’s a play button under each step of the funnel, including the drop-off stages. Clicking it takes you directly to the session replays of all users who abandoned the funnel at that stage.
As a result:
- You can see the user experience and behavior of the 16.41% of people who dropped off. This is essential, as it can help you understand why they abandoned the process, so you can make the necessary changes.
- You don’t have to sift through all other recordings of users who went through the same funnel. Being able to jump directly into relevant recordings saves you time from watching all other sessions of users who successfully passed through the funnel.
AstroPay, a fintech startup and Smartlook customer, used this capability to analyze their cryptocurrency purchase funnel and increase its conversions by 56%.
First, their team built a funnel to map the customer journeys of people who started buying cryptocurrency but didn’t complete the purchase.
Once they knew where users dropped off, they started watching those sessions.
Session replays revealed that some users had to go through too many steps when they didn’t have a local currency in the e-wallet. Also, after completing a purchase, some users spent minutes searching for their newly purchased cryptocurrency inside their wallet, not realizing the transaction was pending. This resulted in a reluctance to buy cryptocurrency via the AstroPay app in the future.
Armed with these insights, AstroPay’s team removed unnecessary steps and added a “Purchase pending” banner, and after making those changes, they saw a 56% lift in conversions.
Build and analyze event-based funnels without coding
In Smartlook, all funnels are sequences of events, i.e., actions that users take on your site or app. These can be URL visits, button or link clicks, text inputs, and more.
Once Smartlook is set up, it automatically starts recording all user interactions via session replays. You can then decide which interactions (i.e., events) you want to analyze over time by defining events. There are three ways to do this without coding:
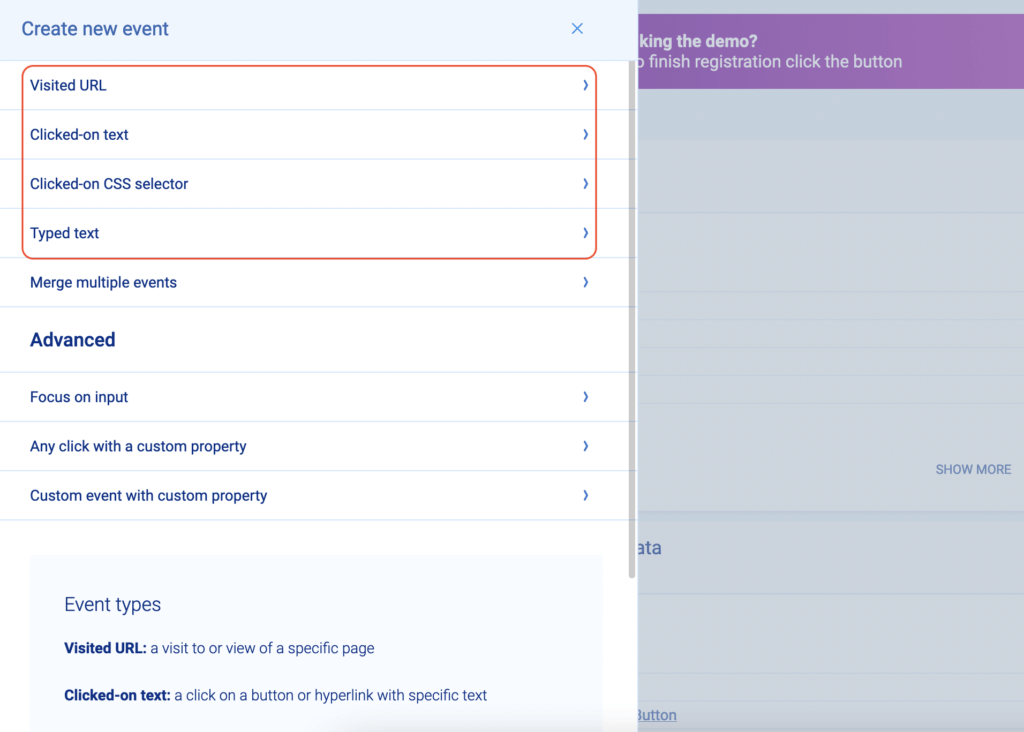
1. Choose from a list of standard events, including clicked on URL, clicked on text, typed text, clicked-on CSS selector (allowing you to select any element on the page).
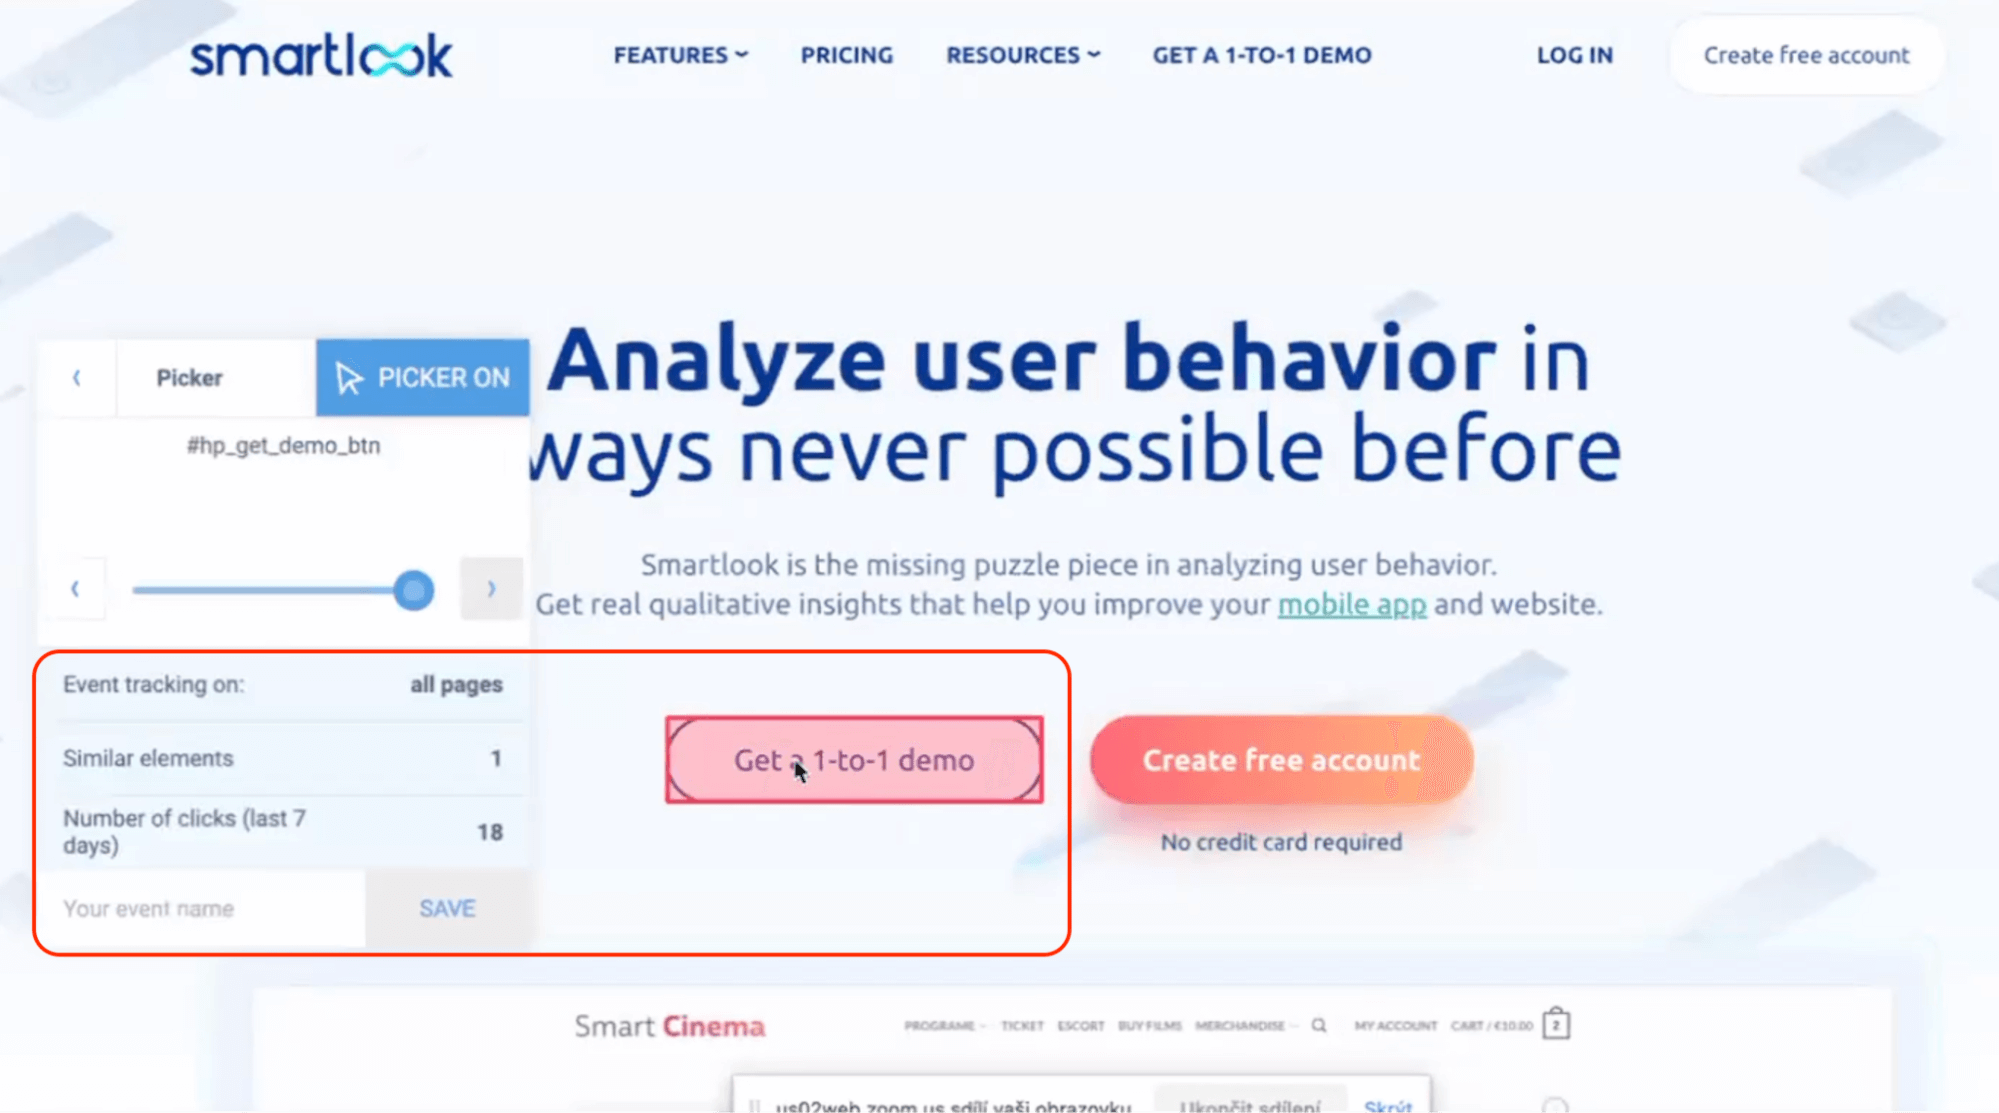
2. Use the no-code event picker. When you click on the “Pick event on page” button, you’ll be taken to your page. There, you can define an event by clicking on elements in your site or app’s UI (like the “Add to cart” button). Since the user interaction data is already collected, you can see the number of clicks on that element over the last seven days just by hovering over it.
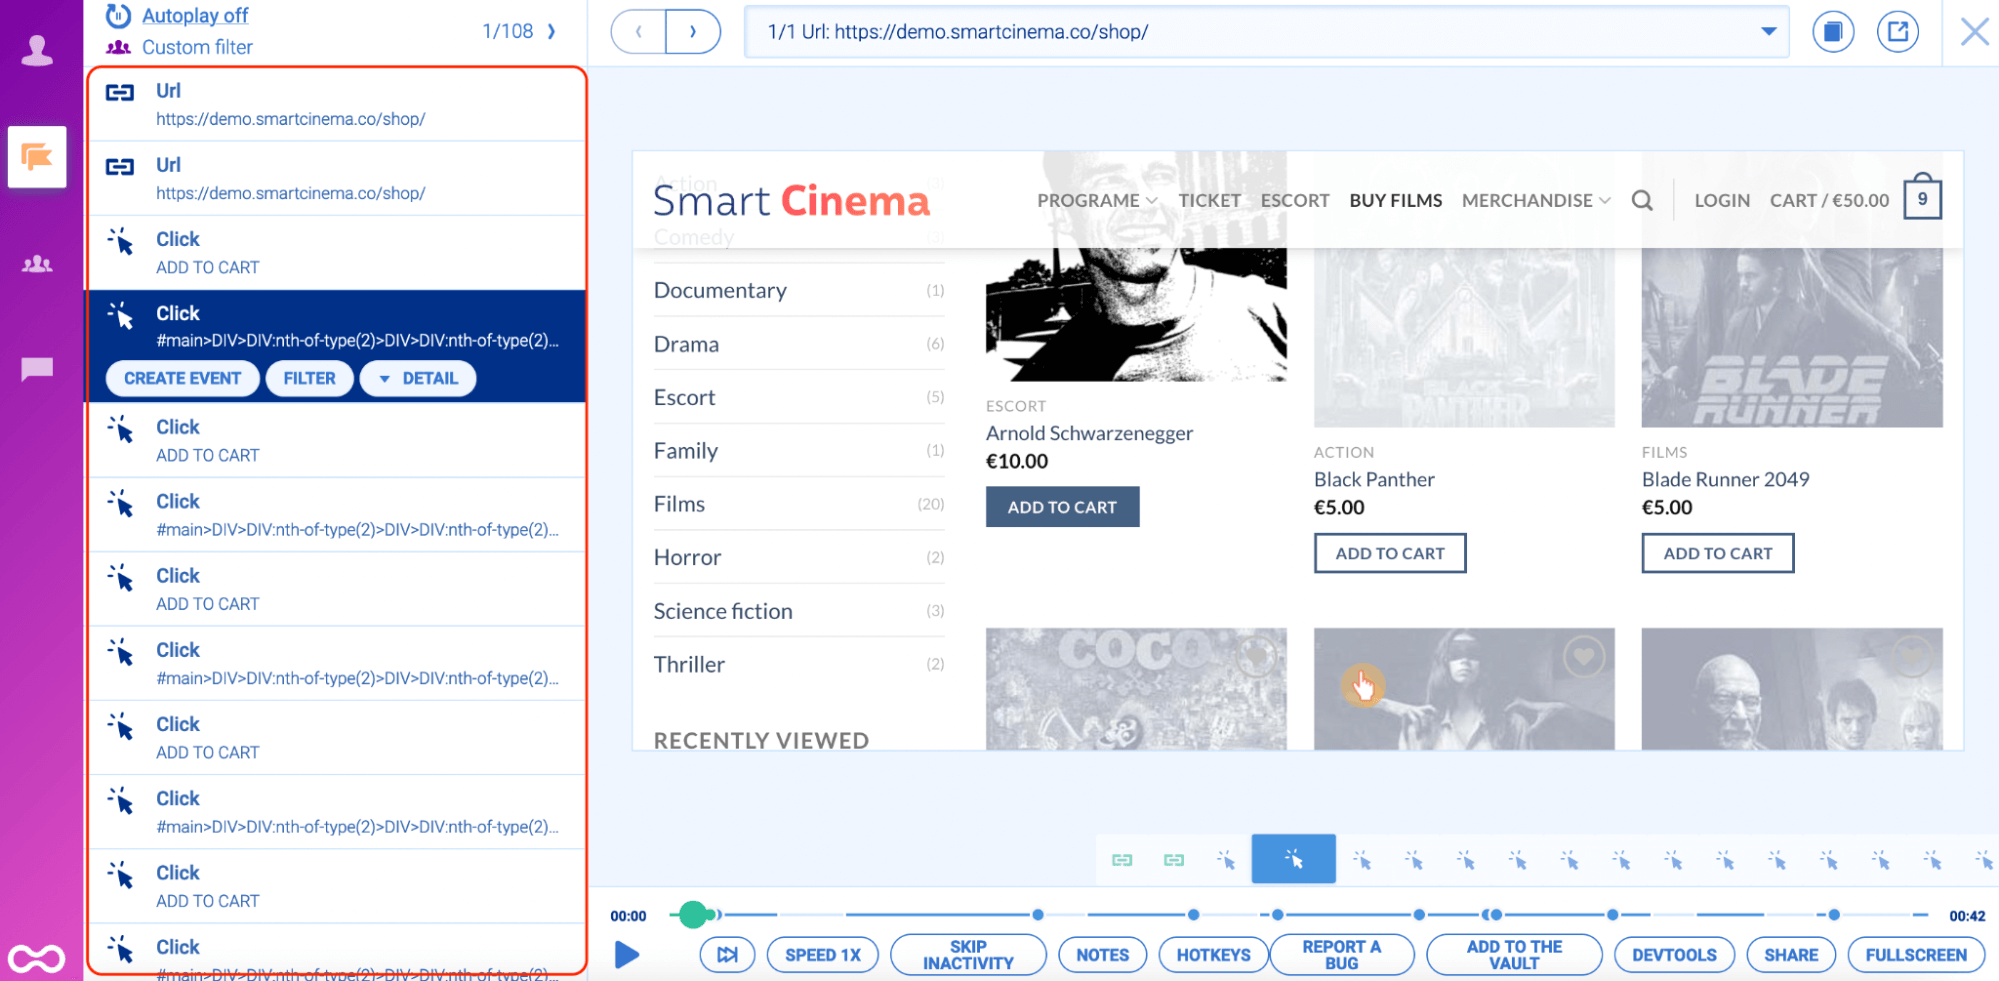
3. Define an event from a recording. While you’re watching a session replay you may see some actions that you’d like to track. In that case, you can pause the recording, click on the “Session events” tab, and make that action into an event without leaving the replay.
Once you define an event, Smartlook instantly identifies every instance of that event, going back to the moment you added the snippet or as far as your data retention plan goes. The event tracking visualization appears instantly, like in the GIF below.

This means you don’t have to wait for data collection every time you set up a new event like you would in Google Analytics.
You can also create custom events via JavaScript to track pretty much anything else outside of the standard events. For mobile apps and games, most user actions are typically tracked via custom events.
When you have your events, put them in the order you believe your users follow and click on “Add new funnel.” The funnel visualization will appear instantly, as in the GIF below.
You can try Smartlook’s event tracking and funnel analysis features in our live public demo (no registration or credit card required).
Let’s go back to our previous example of a three-step checkout funnel and build it from scratch.
Each of the events (or steps) of this funnel can be defined without coding.
- Step 1: Users click on “Buy/upgrade package.” You can use our no-code event picker and click on the button to define the event.
- Step 2: Users click on the “Pay now button.” Again, use the no-code event picker to define the event.
- Step 3: Users arrive on the “Thank you” page. Select the “Visited URL” standard event and enter the “Thank you” page URL.
You can add other interactions to this funnel to get an even more accurate view of your users’ journey.
For example, between steps one and two, users may have to fill out a form with their email, shipping information, etc. You can use the typed text standard event to track when users start filling out each field. This can show you if users abandon the process when reaching a specific form field.
Find drop-offs in new funnels without waiting for data to accumulate
One problem with many funnel analysis tools is that it may take weeks to get enough funnel traffic to make statistically significant conclusions. During that time, issues that affect your conversions usually remain undetected.
To avoid this problem, Smartlook’s funnels use your historical event data. As a result, when you define a new funnel, it automatically gets populated with data, going back to the moment you set up Smartlook (or as far back as your data retention plan goes).
For example, the GIF below shows a newly created funnel that gets populated with historical data and visualized immediately.
This means you can locate drop-off points and start optimizing your funnel right away, without waiting for new traffic.
Also, this process works even if you hadn’t defined a specific event beforehand. Say you want to build a funnel to analyze your users’ purchase journey from the moment they land on your site to the moment they reach the “Thank you” page after buying a product. Here’s an example of what this funnel might look like:
- Event 1: A website visitor clicks on the shop icon on the homepage.
- Event 2: The visitor searches for an item.
- Event 3: The visitor clicks “Add to cart.”
- Event 4: They click on the “Pay Now” button.
- Event 5: They land on the “Thank you” page.
But what if you haven’t been tracking user clicks on the “Add to cart” and “Buy now” buttons as events? No problem — since Smartlook tracks all user interactions automatically, you can define these events using our no-code picker and they’ll instantly get populated with data. Then, you simply add them to a funnel and analyze it immediately.
In contrast, with Google Analytics you’d have to first define a custom event if the action you wanted to analyze isn’t automatically tracked. Then you’d have to wait for enough data to accumulate before you can add the event to a funnel and start analyzing your users’ behavior. Depending on your site’s traffic, this may take days or even weeks.
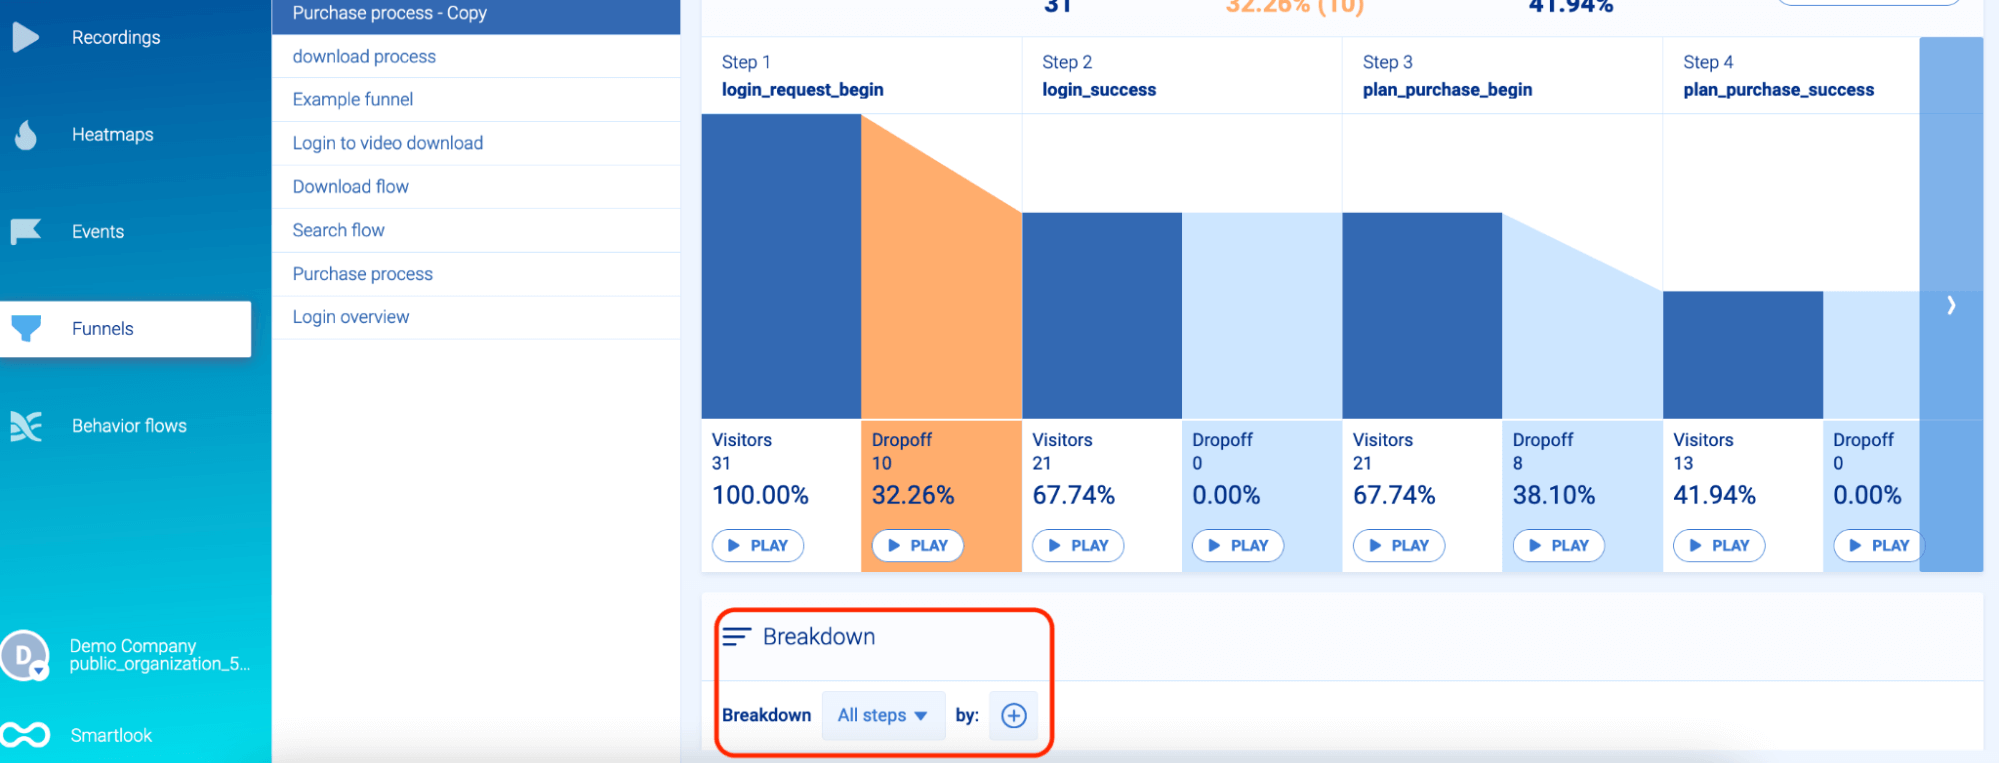
Break down funnels to uncover insights about different categories of visitors
When analyzing funnels with Smartlook, you can break down each step or the entire funnel by different criteria like country, device, browser, and more.
Open the funnel you want to analyze, scroll down, choose which steps you’d like to break down and click on the “+” symbol to select your criteria.
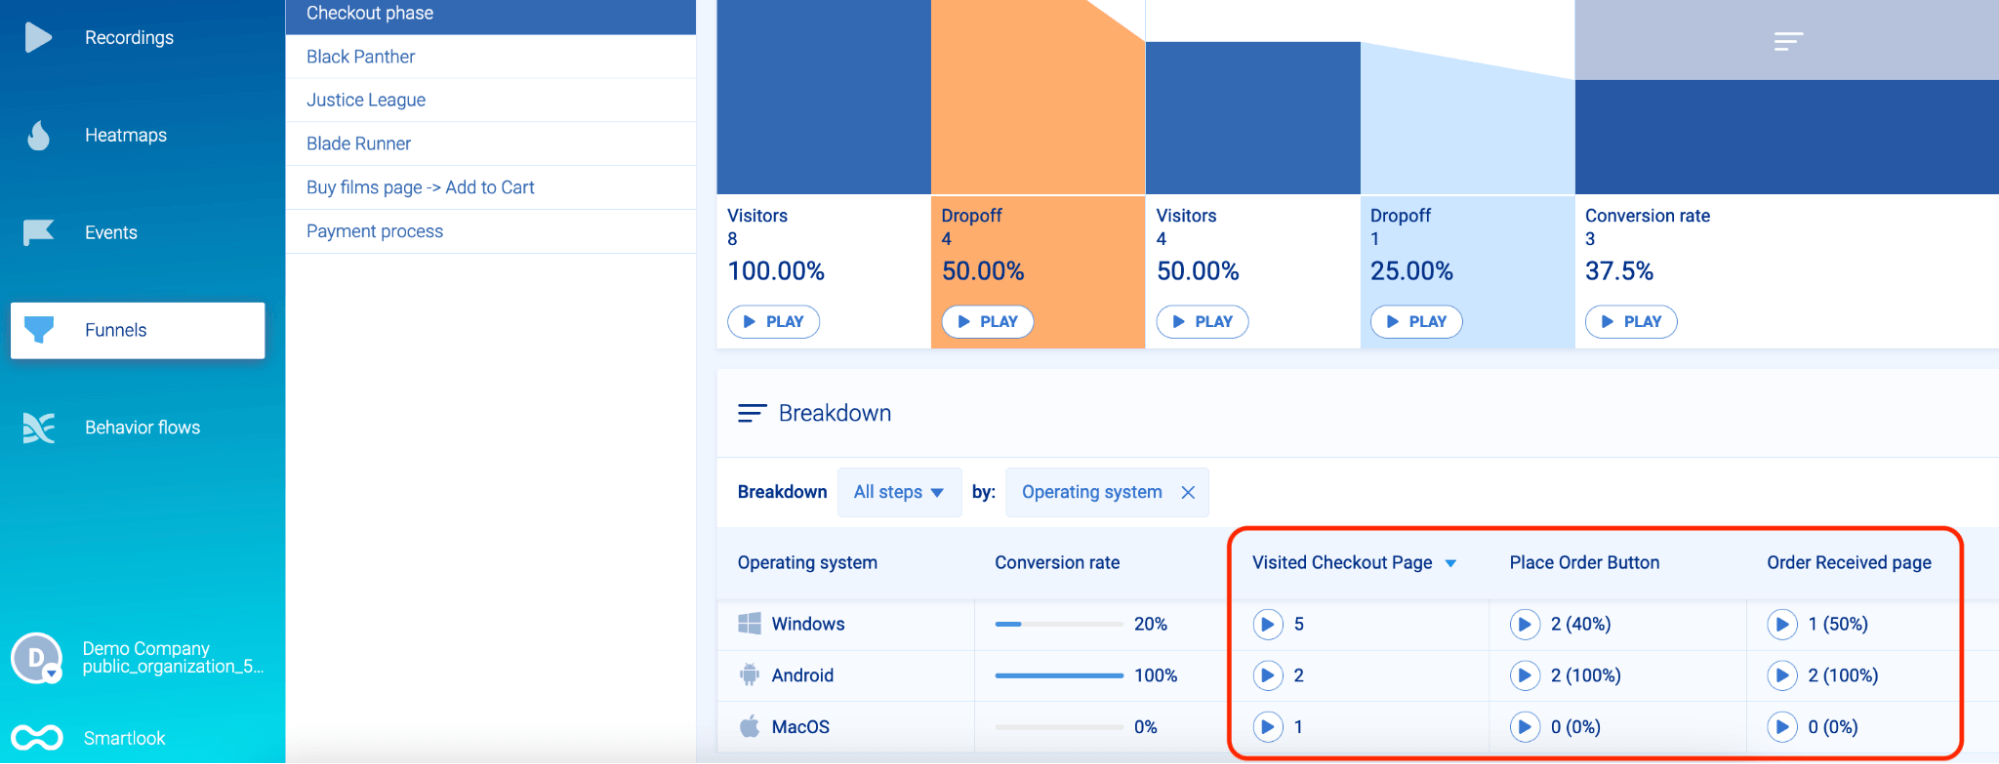
Funnel breakdowns can help you find valuable insights about different categories of visitors. For example, a breakdown can show that users with the Safari browser are converting at a much lower rate than others, which may indicate a browser compatibility issue.
Again, you can easily jump straight into relevant session recordings to try to find the root cause of a problem.
You can further customize your analysis to your needs by creating your own custom properties, which let you log specific data for every event.
Get notifications about sharp conversion rate drop-offs or increases in your funnels
You should always monitor your essential funnels and quickly learn if sharp drop-offs and increases in their conversion rates occur.
For an e-commerce store, the checkout funnel we looked at earlier has to be monitored carefully, as it directly impacts revenue.
For mobile apps or SaaS tools, a funnel that tracks users’ onboarding journey should be constantly observed, as good onboarding means you can retain and convert more users from free to paid.
However, if you have a lot of funnels, it’s impractical to constantly check each one to ensure everything’s fine. That’s why Smartlook can alert you about sharp conversion rate drop-offs or increases in your funnels with anomalies.
Here’s how.
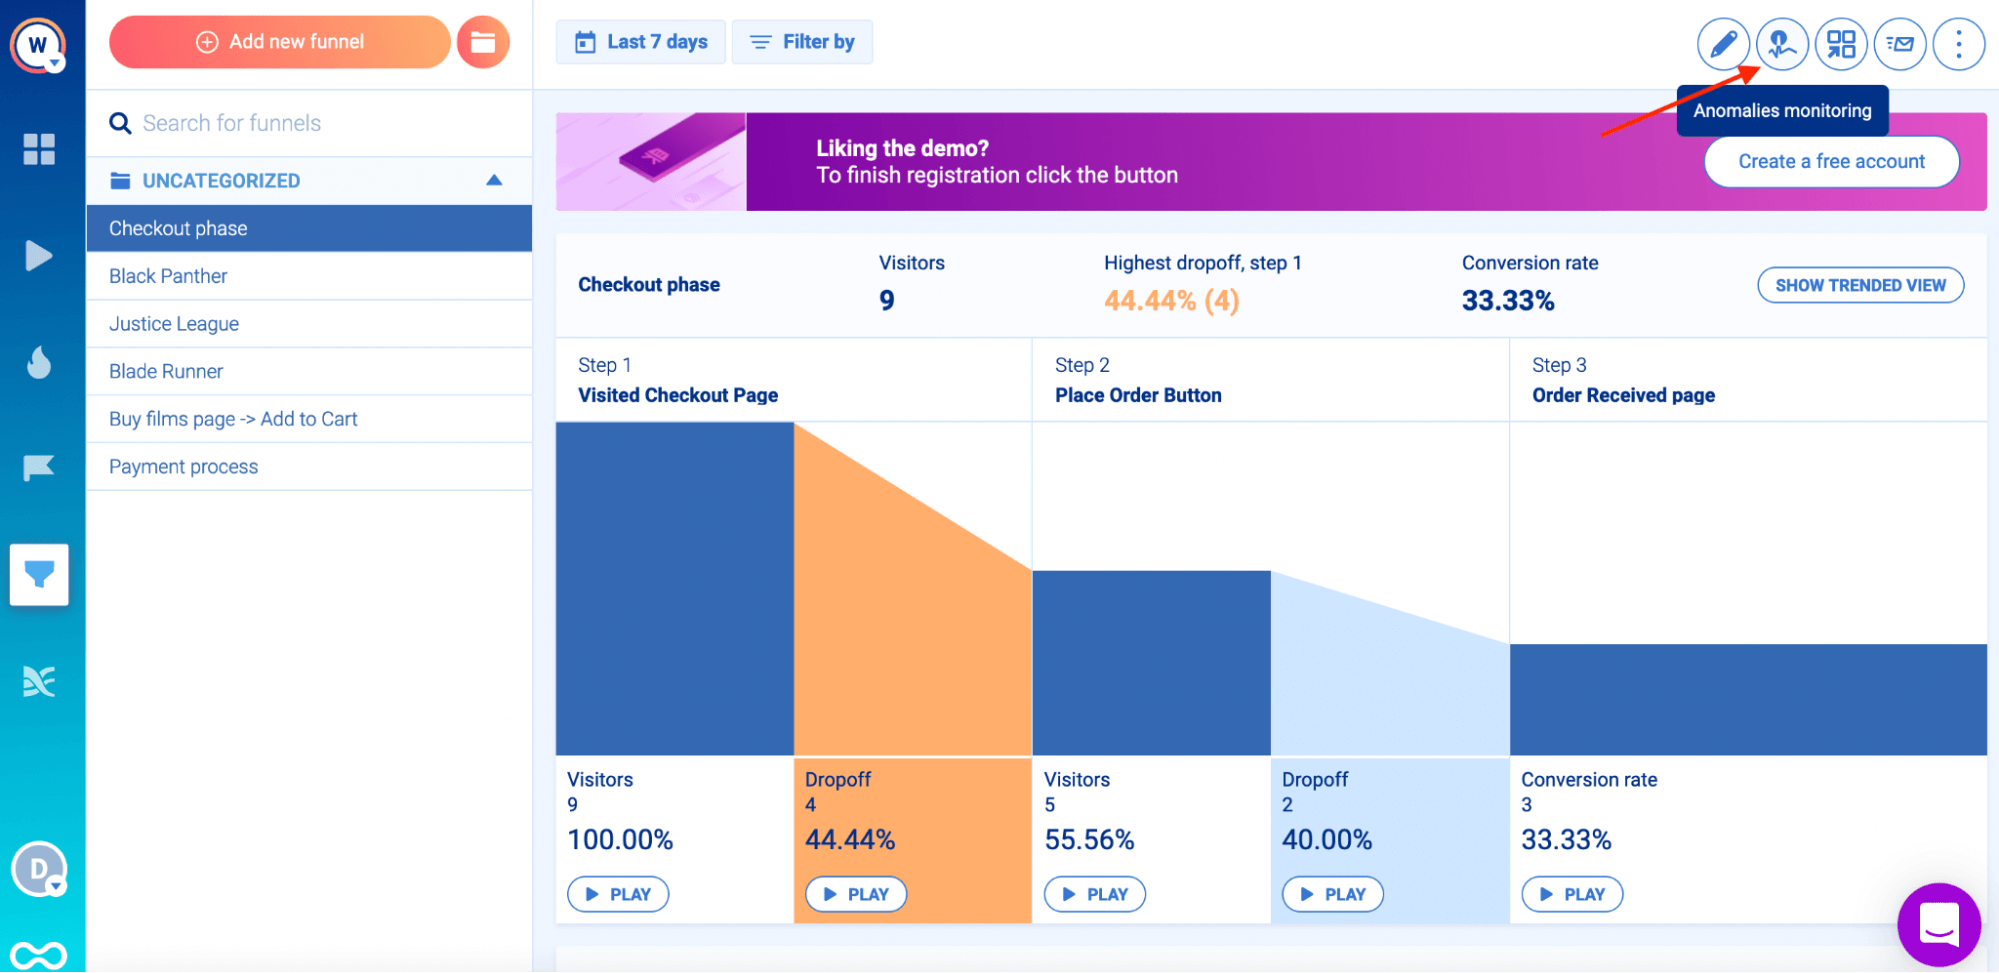
Open a funnel and click on “Anomalies monitoring.”
This will open up a new window where you can choose to get alerted for drop-offs or surges. You can also select how the anomaly gets triggered:
- By a conversion rate dropping outside of a defined range, e.g., below 1% or above 3%.
- By a percentage change from your baseline, e.g., 60% lower (or higher) than normal.
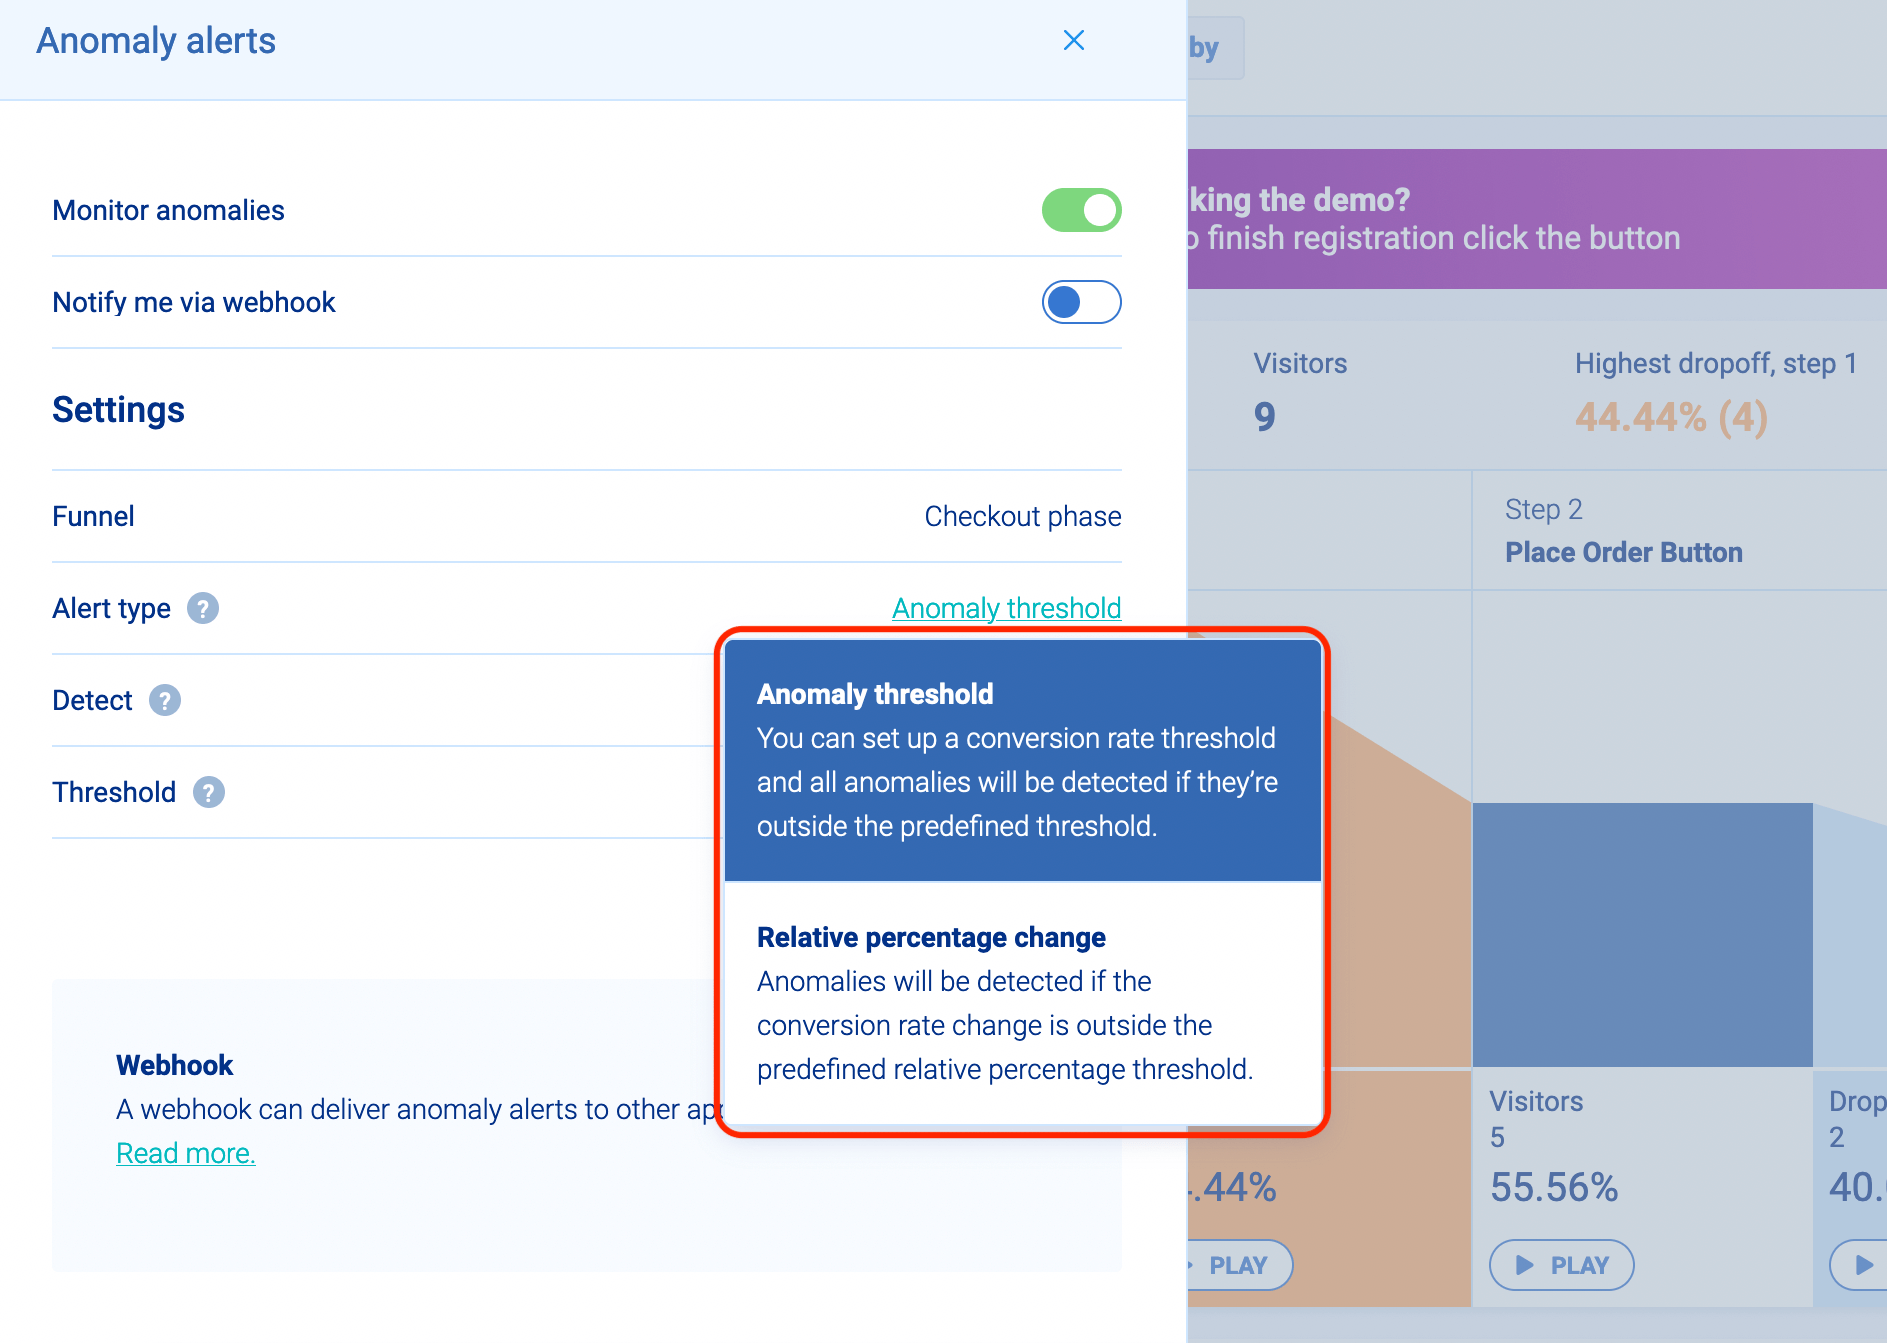
After an anomaly is set up, you’ll be notified inside Smartlook and via email when sharp conversion rate increases or drop-offs occur. You can also set up webhooks to get alerts in other apps, like Slack, for example.
Once you set up anomaly alerts, you can address critical errors, like your checkout being broken, much faster than if you monitor each funnel manually.
Get Smartlook and start building your funnels today
Sign up for a free Smartlook account (no credit card required) and start building event-based funnels without coding today.
As soon as Smartlook is set up, it will automatically start recording all user sessions on your site or app. You can use these session recordings in combination with your funnel analysis to find out why users drop off, so you can improve their experience and optimize your conversion rates.
If you want to see a Smartlook presentation that’s tailored to your business, schedule a demo with our team.