Setting up event tracking in Google Analytics lets you see how many users interact with specific elements of your site or app, like button clicks, text inputs, or form submissions. By monitoring those events over time, you can get valuable insight into your users’ behavior to learn what’s working on your site and what could be improved.
In this article, we’ll show you how to set up event tracking in Google Analytics with the help of Google Tag Manager (GTM). We’ll cover both Universal Analytics and Google Analytics 4 (GA4), as events work differently in each version.
But before we begin, it’s worth noting that tracking events with Google Analytics has some big downsides. Specifically:
- Setting up GA events is difficult and time-consuming. It typically requires programming skills and the use of an extra tool. And even if you use GTM to avoid writing event tracking code, you still need to know how GTM tags, triggers, and variables work so you can set them up.
- Event tracking is not retroactive, so there’s always a delay between realizing you need to track a user interaction and having the data to do so. Google Analytics starts tracking user actions as events only after you set up tracking for that element. As a result, you have to wait days or weeks for enough data to roll in before you can analyze a specific behavior. This also means you have to predict which interactions you’ll want to track in advance. While this used to be the norm in web analytics, there are now several Google Analytics alternatives that offer retroactive tracking.
- The lack of session recordings in Google Analytics makes it hard to understand the context behind events and improve users’ experience.
That’s why, in the second part of this article, we’ll show you how our tool, Smartlook:
- Automatically records all user interactions on your site or mobile app, cutting out the time-consuming setup of tools like Google Analytics.
- Lets you define events retroactively without setting up tracking on each individual element or needing a third-party tool.
- Offers always-on session recordings with more than 30 filters.
Lastly, we’ll also discuss how you can combine events with session recordings and funnel analysis to find opportunities for improving your site or app’s user experience and conversion rates.
If you want to track all user interactions on your site or app automatically, sign up for a free Smartlook account (no credit card required).
How to set up event tracking in Google Analytics
Event tracking works very differently in Universal Analytics or GA4. If you’re not sure which version you’re using, open your Google Analytics account and look at the tracking ID (the numbers under the property name).
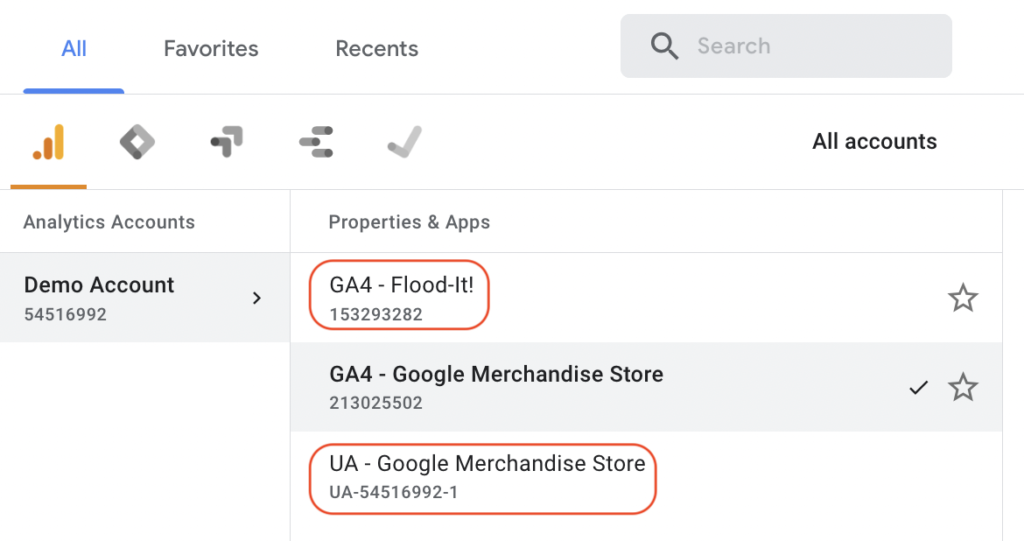
Universal Analytics properties start with “UA”, while GA4 properties have only numbers.
Regardless of the version, you’ll likely need GTM (in addition to Google Analytics), so you can track events without constantly changing your site’s code. If you haven’t set up GTM yet, follow Google’s instructions.
We’re starting our explanation of event tracking with Universal Analytics. Feel free to skip to the GA 4 section if you’re using that version.
Tracking events with Universal Analytics (Older Version)
Universal Analytics events have four components (or parameters) — two required and two optional:
- Category (required): Organizes your events into groups. For example, you may want to track clicks on the links placed in your site’s navigation. In that case, you can create a “Navigation” category.
- Action (required): The specific user interaction which initiated the event. If you’re tracking clicks on navigation links, the event action associated with the “Navigation” category can be called “Click.”
- Label (optional): A description of the element you’re tracking. This can be the name of the specific link, like “Features” or “Pricing.” Label isn’t a mandatory component, but it makes your event reports easier to read and understand.
- Value (optional): An optional parameter, which you can use to assign a non-negative numerical value to a page object. You can use it to assign a specific dollar amount to a user action. For example, if you know that a lead is worth $50 to your business, you can assign that event value to the action users take to become a lead (booking a demo, subscribing to a newsletter, etc.).
Note that some e-commerce and user engagement events have pre-set categories and labels. Refer to Google’s documentation for a list of these events.
When a user interacts with an element, the event tracking code passes the event hit along with these four parameters to Google Analytics. The parameters are then used to organize the event data into reports.
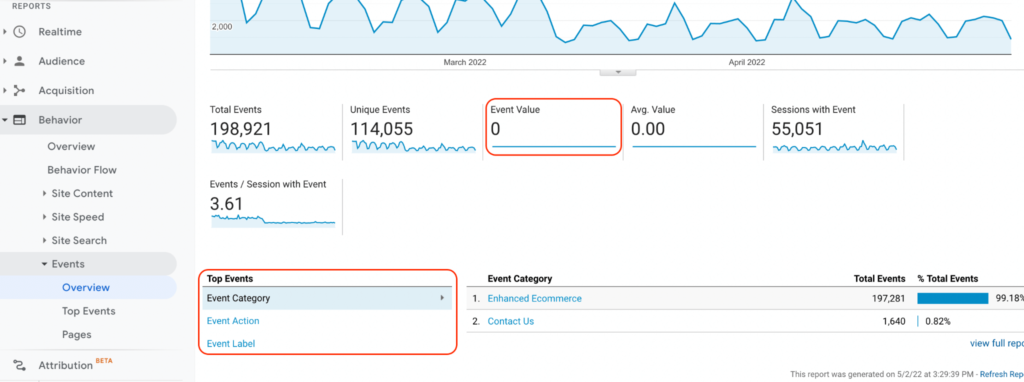
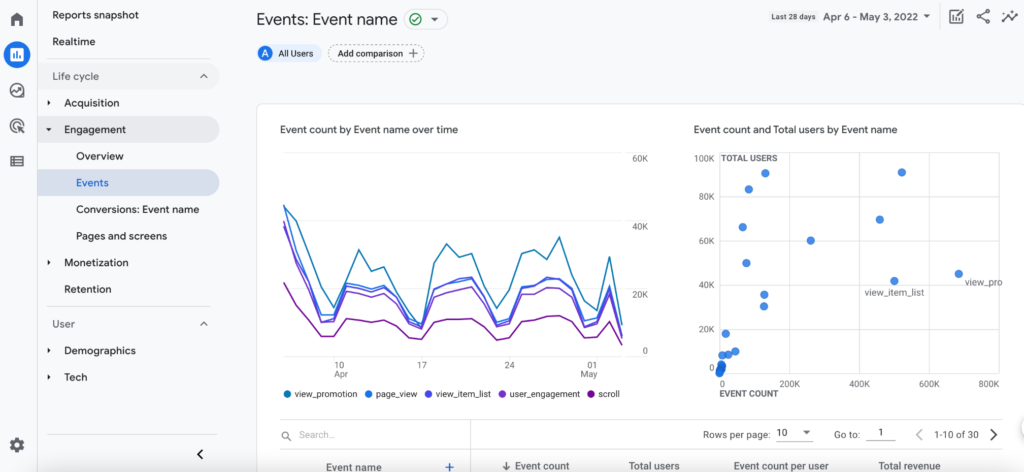
As you can see, you can keep track of all the events you’ve created in the “Behavior” report (Behavior → Events → Overview).
It’s important to adopt a consistent and clear naming convention for event categories, actions, and labels. In many organizations, dozens of people use Google Analytics reports, so it’s common for employees or consultants to see a bunch of events with ambiguous names and have no idea what they measure or when they fire. A consistent and logical naming convention avoids that problem.
Now, if you want to create and add event tracking code manually, you’ll need access to your site’s code and at least a basic understanding of JavaScript. For examples and best practices, refer to Google’s documentation.
As we said, in this article, we’re focusing on GTM.GTM allows you to track events without writing and adding code manually, which makes it a much simpler and scalable alternative.
However, GTM does come with its own learning curve. To start, you need a good understanding of how triggers and tags work.
Triggers listen for user interactions that are likely to occur on a page, like button clicks or pageviews. Their job is to tell the tag to fire when an event is detected.
There are different types of triggers which you can choose from, like page view triggers, click triggers, form submission triggers, and more.
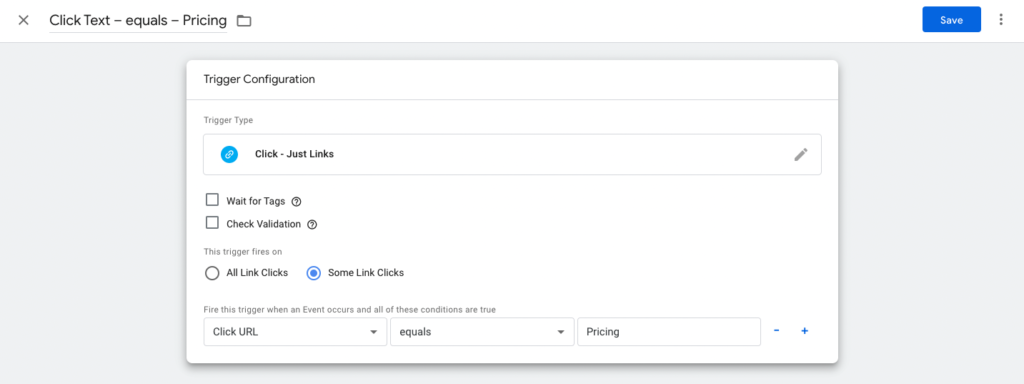
Say you want to track clicks on the “Pricing” link in your site’s navigation. In that case, you’d need a trigger type of “Click — All Elements.” Then, you’d need to set the trigger to fire only on some clicks. If we select “All clicks,” the trigger would fire on every click on the page. Lastly, we have to set the firing conditions. In this case, “Click Text – equals – Pricing.”
Once you set a new trigger, you need to create a corresponding event tag. To create a new tag, go to “Tags”, click on “New” and select Google Analytics: Universal Analytics as the tag type. Then, select “Event” as the track type and configure the category, action, and label, as we discussed above.
For example, the category might be “Navigation”, the action: “Click”, and the event label: “Pricing”.
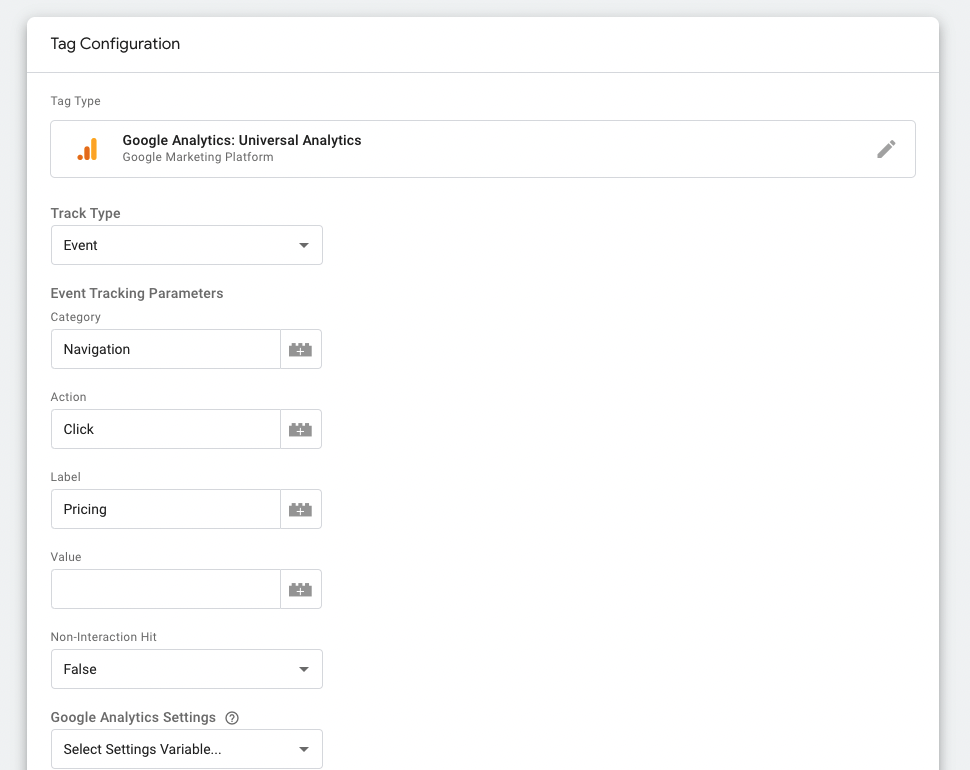
You also have the option to set the “Non-Interaction Hit” field to true or false. Scrolls are usually designated as non-interaction events, so they don’t affect a page’s bounce rate. If you’re interested, you can learn more about non-interaction events, but they aren’t that important for what we’re trying to do here.
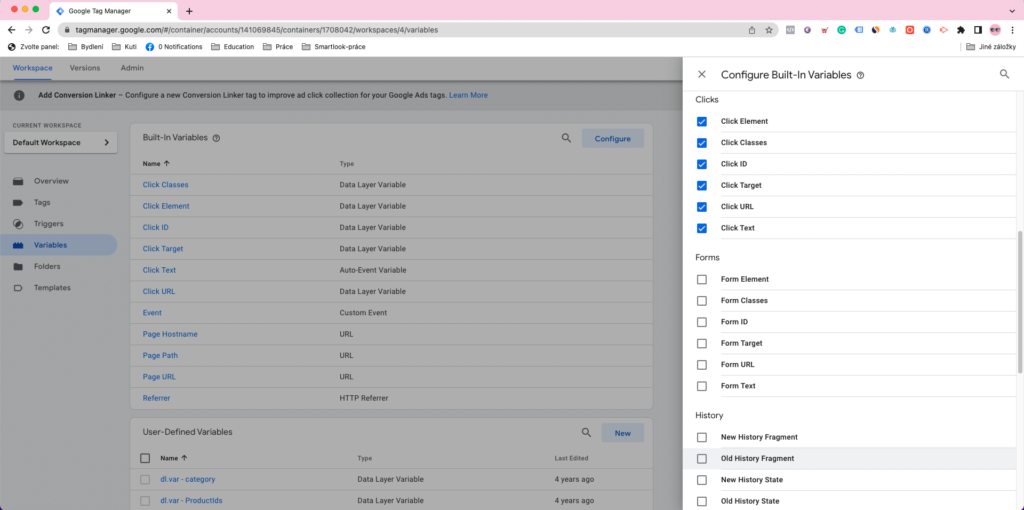
Note: For this process to work, the “Click” variables have to be enabled. If they aren’t, open the “Variables” tab and enable them. This instructs GTM to capture clicked URL data.
Also, it’s a good idea to double-check if everything is set up correctly with GTM’s preview mode. To do so, click on the “Preview” button on the top-right (see below).
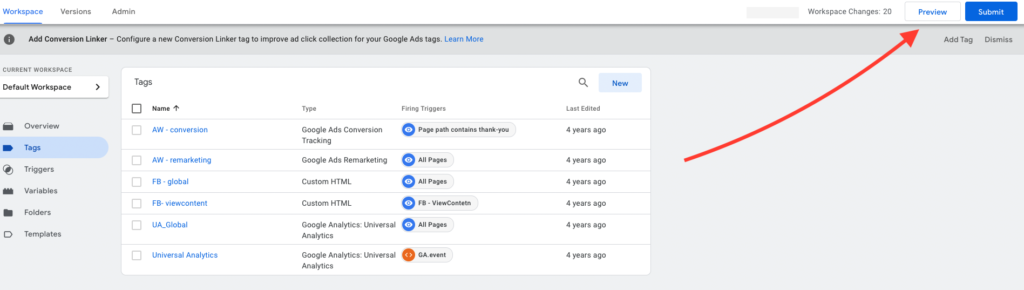
Preview your site’s homepage and click on the “Pricing” link to see if the event tag fired correctly. If it isn’t firing correctly, there may be an issue with the trigger or tag configuration, so you’ll need to go back through the steps we outlined above again.
To see other examples and best practices of event tracking with GTM, refer to Google’s documentation.
Tracking events with Google Analytics 4 (New Version)
There are three main types of events in GA4:
- Automatically collected events. These events are collected by default, without you having to do anything beyond setting up GA4. Some of the automatically tracked events are ad clicks, file downloads, and video plays. You can find a complete list here.
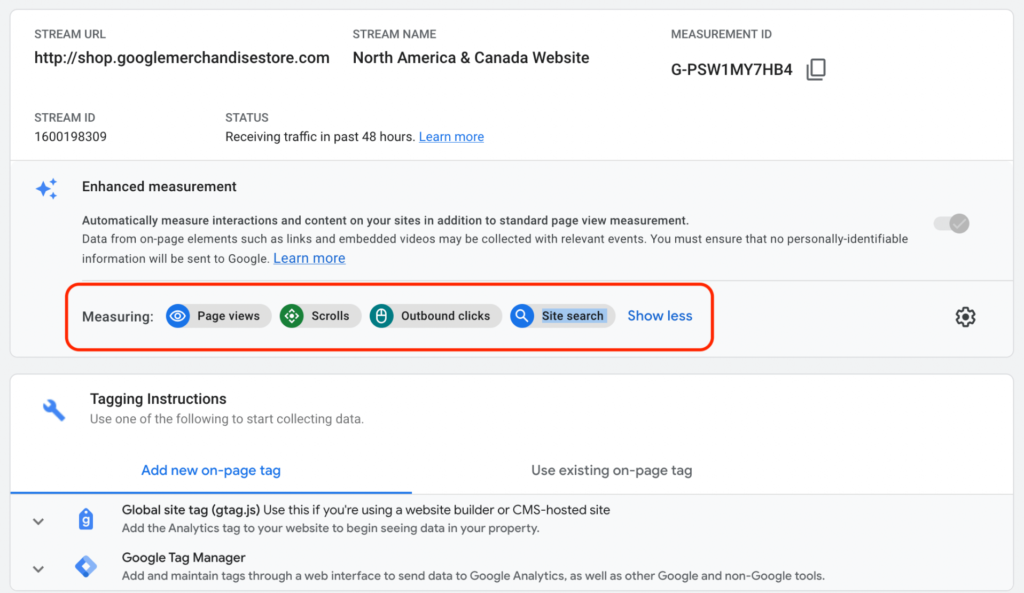
- Enhanced measurement events. The enhanced measurement option allows you to select additional events for GA4 to track automatically, like when users click on outbound links. You can enable it by clicking on “Admin” and going to “Data Streams.” When enhanced measurement is enabled, these additional events are also tracked automatically — no need to make code changes or use GTM.
- Recommended events. These events aren’t tracked automatically, but Google still recommends tracking them manually via code changes or GTM. Some of the recommended events include adding items to a cart and writing down shipping info. In their documentation, Google also includes recommended event names for these actions and sample code snippets for implementing them.
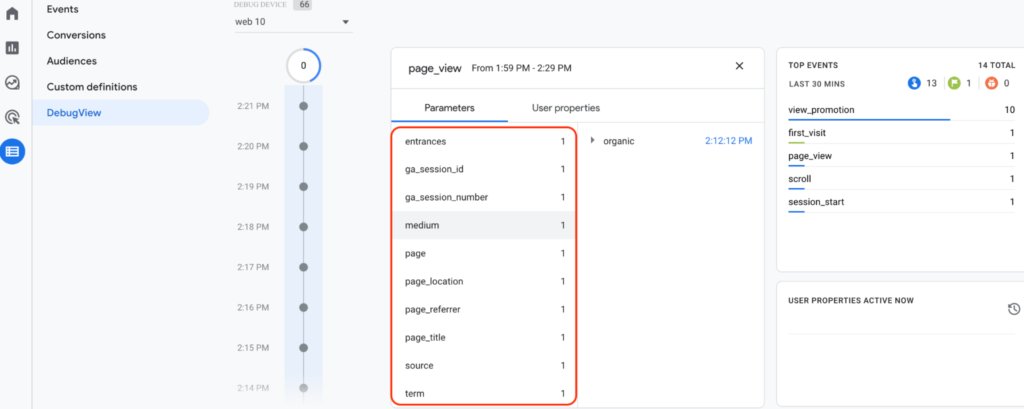
You can find more information about these three categories of events, as well as any others you create, by going to Reports → Engagement → Events.
Regardless of the specific type, all GA4 events have a name and parameters (instead of a category, action, and label like Universal Analytics events). Parameters allow you to send additional information about the event. For example, a pageview event will have parameters like source, medium, and page referrer.
Now, if an action you want to track isn’t automatically collected or part of the recommended events, you’ll have to create a custom event with a new name and parameters.
For example, GA4 automatically tracks outbound clicks, but not clicks that don’t lead away from the domain. If we wanted to track clicks on the “Pricing” link in our navigation, we’d need a custom event.
We can do that with GTM by following the process of creating tags and triggers, which we showed in the previous section. However, note that the tags would be created with names and parameters, instead of categories, actions, or labels.
For an in-depth look at how to track custom events in GA4, check out this tutorial:
As you can see, Google Analytics event tracking requires a lot of manual work. Even with GA4 tracking more events automatically, you’ll likely still need to set up some manually via GTM. And while GTM removes the need to change your site’s code, it’s still a separate tool that you have to set up, learn, and manage.
Use Smartlook to automatically collect all user interactions on your site (or mobile app) and track events
In contrast to both Google Analytics 4 and Universal Analytics, Smartlook automates the entire process of recording user interactions.
Smartlook does this by capturing the sessions of every user on your site or app once our code snippet is installed (for websites) or the SDK is set up (for mobile apps).
Later on in this guide, we’ll show you how Smartlook captures each user interaction with the help of session recordings. If you’re interested, skip ahead to that section.
For now, let’s focus on using the automatically collected user interaction data to define events and track them over time.
The process of turning a specific user interaction into an event is called defining an event. There are three ways to define events without writing code or using third-party tools:
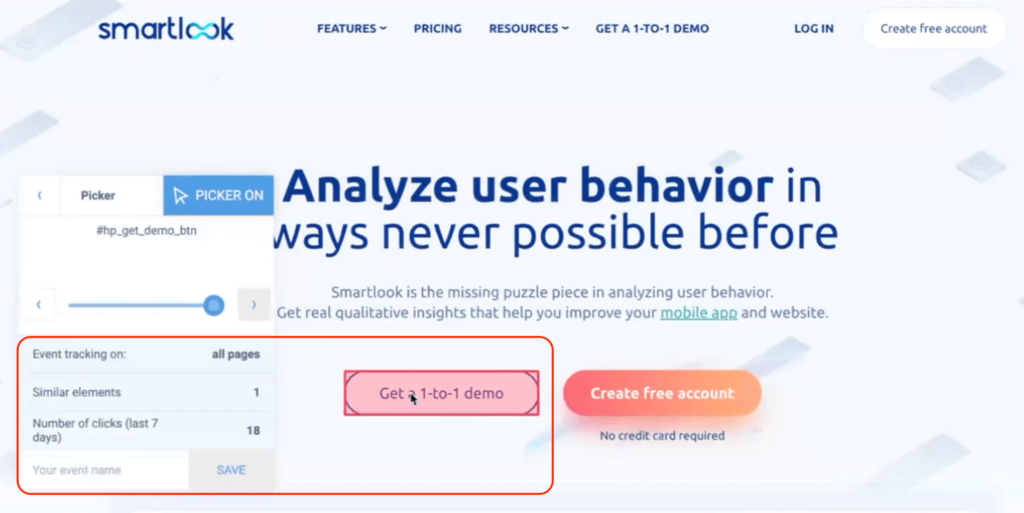
1. Use the no-code event picker. When defining a new Smartlook event, there’s a “Pick event on page” button. Clicking it takes you to your web page, where you can define an event by clicking on elements in your site or app’s UI, as you can see in the screenshot below. Since the user interaction data is already collected, the number of clicks on that element over the last seven days appears instantly when you hover over it.
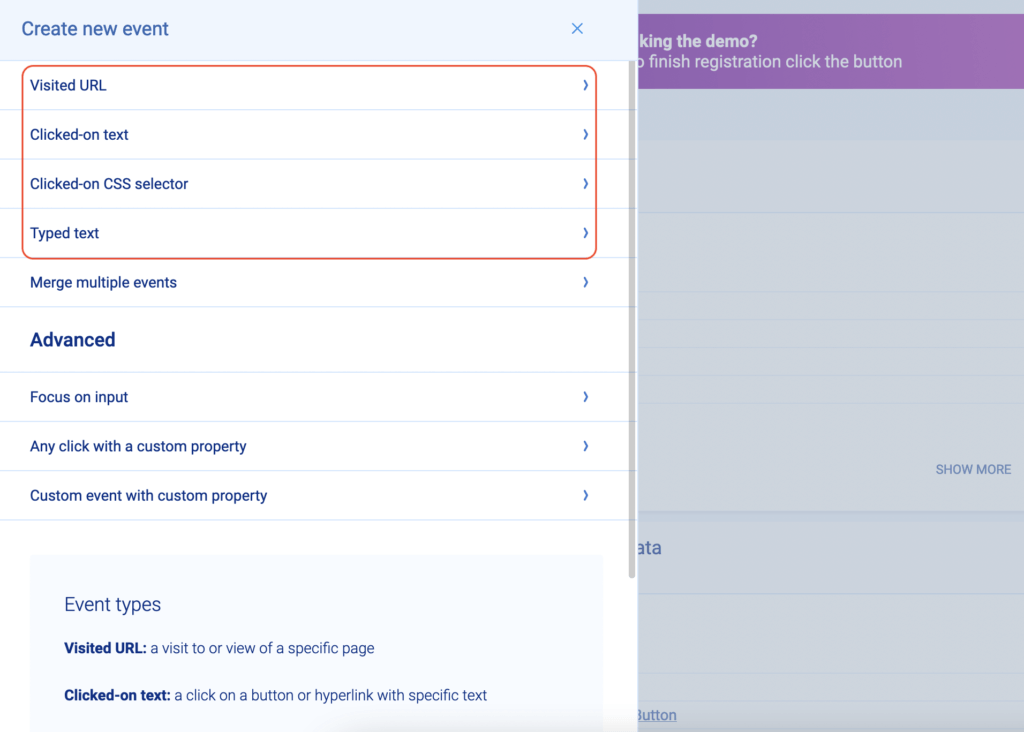
2. Choose from a template list of standard events, including clicked on URL, clicked on text, typed text, clicked-on CSS selector (allowing you to select any element on the page).
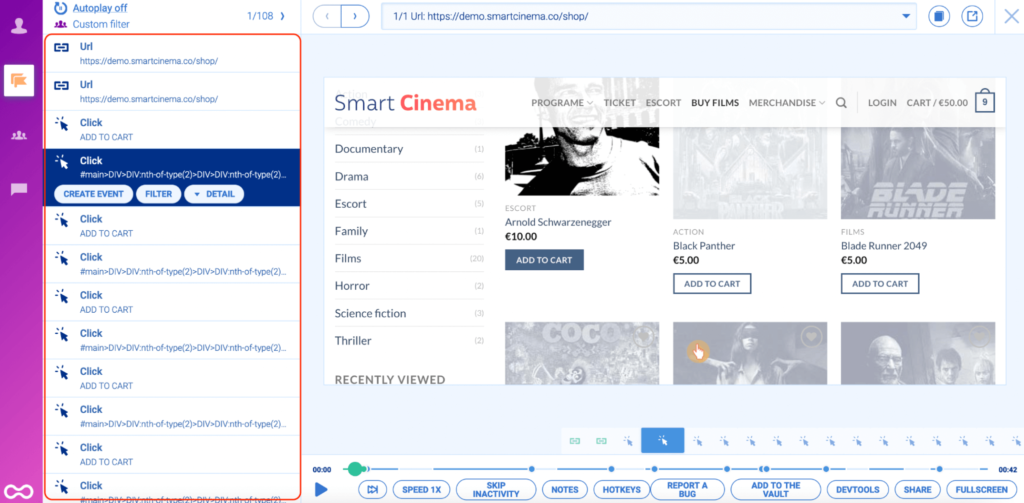
3. Define an event from a recording. While you’re watching a session replay (we’ll cover those in the next section) you may see some actions that you’d like to track. In that case, you can pause the recording, click on the “Session events” tab, and make that action into an event without leaving the replay by clicking on “Create Event”.
These three options allow you to track events, without waiting for your dev team to implement tracking on each element you want to analyze.
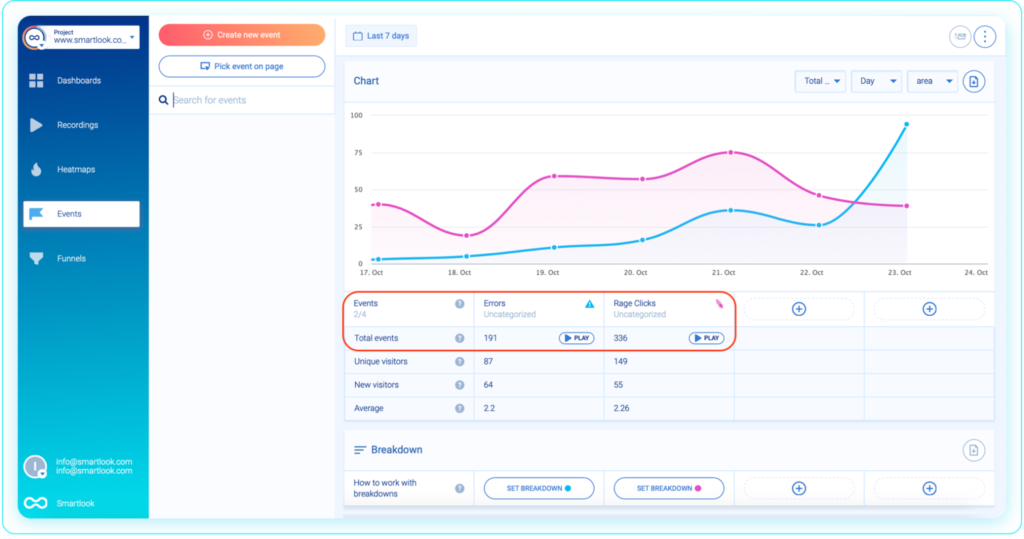
Once you define an event, Smartlook immediately identifies every instance of that event, going back to the moment you added the snippet or as far as your data retention plan goes. The event tracking visualization appears instantly, like in the GIF below.
This means you don’t have to wait for data collection every time you set up a new event like you would in Google Analytics. As a result, you can start analyzing important user interactions immediately, instead of waiting days or weeks for data accumulation.
Let’s go back to our example of tracking clicks on links in the navigation. As we saw, with Google Analytics you have to create a new event and use GTM to set up the correct tags and trigger.
With Smartlook, the user interactions (in this case — link clicks) are collected automatically. Then, all you have to do is define the event, which you can do without coding. As soon as you define the event, it will get populated with data.
You can try this process yourself with our free public demo (no registration or credit card required).
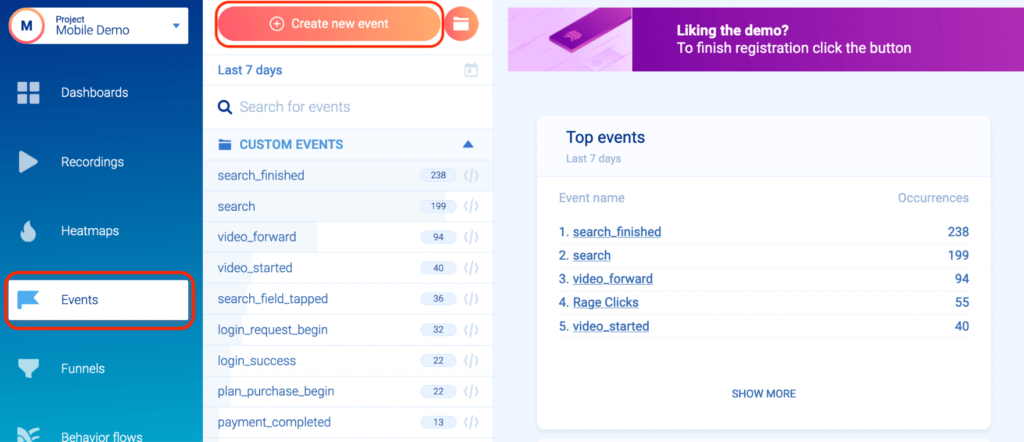
Inside the demo, click on the “Events” tab. There, you can see a list of already created events and click on “Create new event” to experiment with defining new ones.
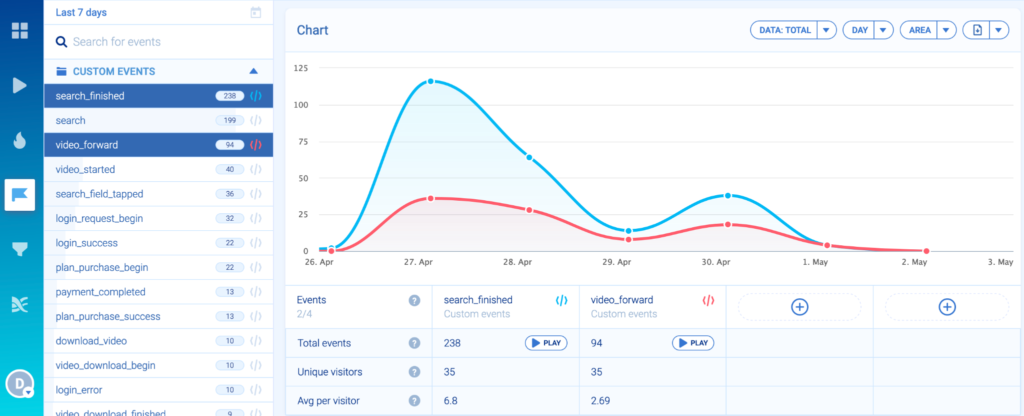
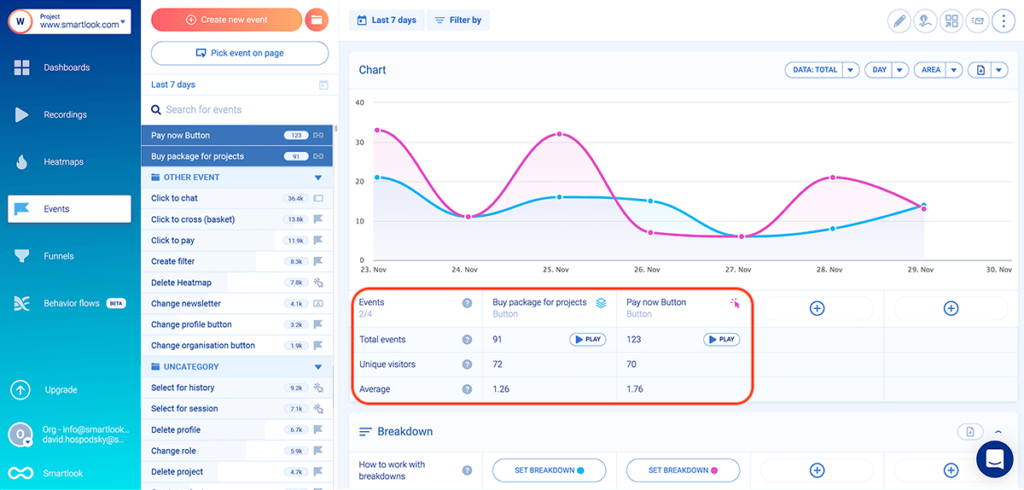
If you want to compare two or more events on the same screen, you can do so by opening one event and clicking on the other while holding down Cmd/Ctrl.
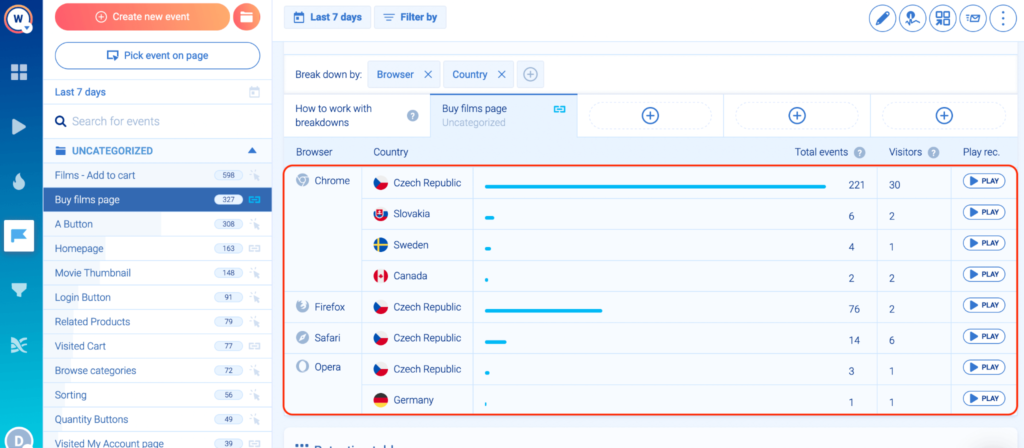
Smartlook can also break down each event by one or more criteria like location, device, or browser. Just open the event you want to break down, click on “Set breakdown” and select your criteria.
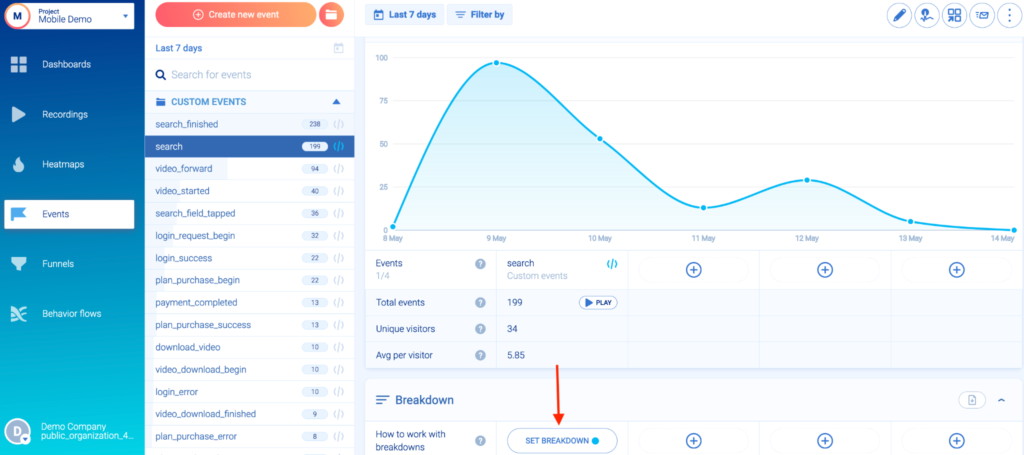
As soon as you do that, a breakdown table will appear at the bottom of the page.
You (or your development team) can further customize this analysis to your needs by creating your own custom properties, which let you log specific data for every event.
Lastly, note that Smartlook allows you to create custom events via JavaScript to track pretty much anything else outside of the standard events. For mobile game and mobile app analytics, most interactions are typically tracked via custom events.
Get notifications about sharp surges or drops in the occurrence of important events
Once you create events, you can open your Smartlook dashboard and monitor their occurrence at any time. But that’s not always practical. For sites and apps with hundreds of events, people can’t be expected to regularly keep an eye on each one.
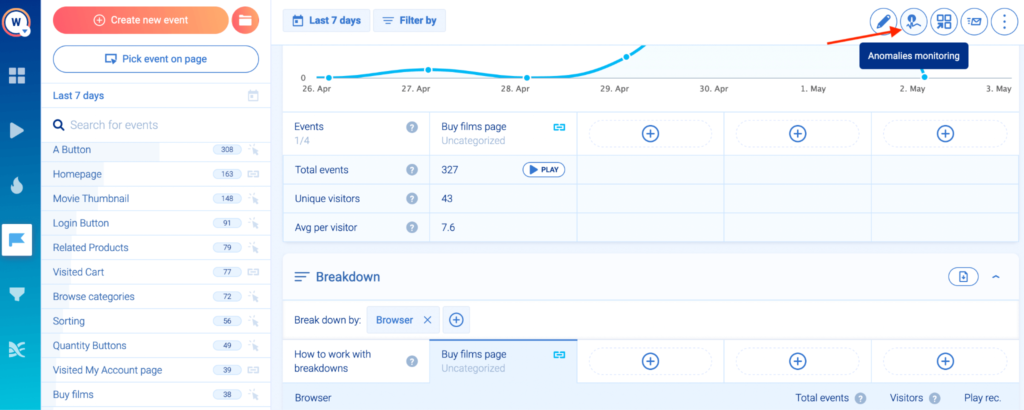
That’s why Smartlook has a special feature called anomalies, which alerts you when a sharp surge or drop in the occurrence of an event happens. To set up an anomaly, open an event and click on “Anomalies monitoring”, as shown in the screenshot below.
You can choose between three different alert types:
- Automatic detection: Automatic anomaly detection will notify you when the event occurrence is outside the average range.
- Anomaly threshold: You can set up an event occurrence threshold and all anomalies will be detected if they’re outside the predefined threshold.
- Relative percentage change: Anomalies will be detected if the event occurrence change is outside the predefined relative percentage threshold.
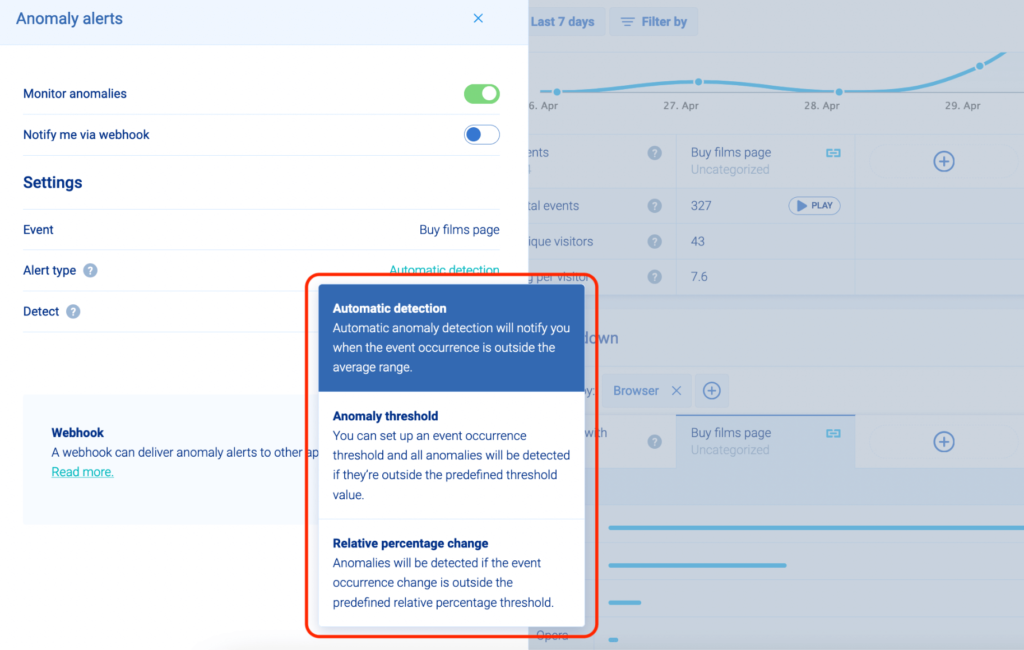
In all cases, you will be notified via email when an anomaly occurs. Additionally, you can ask your dev team to set up notifications via webhook, which allows the anomaly alert to be delivered in other applications. For example, you can set up webhooks to send anomaly alerts to a specific Slack channel.
Monitoring anomalies is important for business-critical interactions such as users clicking on your site’s “Request Demo” or “Pricing” buttons. If visitors suddenly stop clicking these buttons, you need to be alerted instantly, so you can see if there’s an issue. Without proactive notifications, it can take days before you realize what’s happening, during which you may be losing potential revenue.
Besides drop-offs, monitoring surges can also show you problems that you might not have noticed otherwise.
For example, say you’re running a sale on older items in your e-commerce store. However, for some reason, the discount for the old items has also been applied to one of the new, premium items. Several people may start buying up that item at a much lower price than you intended, say $50, instead of $250. If you’ve set up an anomaly for an event related to that purchase (e.g., when users add the item to their cart), you’ll be alerted about the issue, giving you a chance to fix it quickly before it costs you too much revenue.
How to find actionable insights by combining event tracking with session recordings, funnel analysis, and retention tables
As we said at the start, tracking events can help you understand and quantify your users’ behavior. However, events, by themselves, have a fundamental limitation: they can’t tell you how to improve users’ experience and optimize your conversion rates.
For that, you need to combine events with other quantitative and qualitative analytics tools, specifically session recordings, funnels, and retention tables. In the following sections, we’ll show you how to do that with Smartlook.
Use events to filter session recordings and see the context behind users’ actions
Session recordings (sometimes called session replays or session playbacks) show you users’ real-time behavior during every traceable step of their online session.
In other words, you can watch session recordings and see users’ entire experience with your site or app, from the moment they open it to the moment they close it.
With Smartlook, session recordings are always on, by default.
You can find each one in the “Recordings” tab of your Smartlook dashboard.
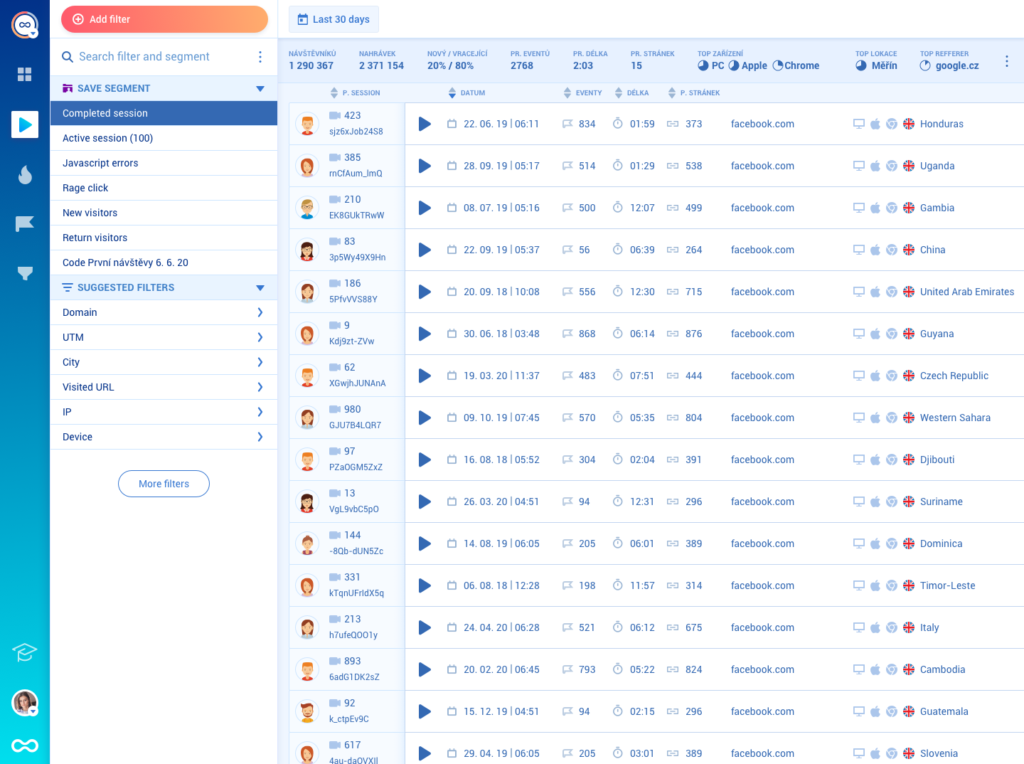
In most cases, it’s impossible to watch all of them chronologically. It’s also impractical because many of the sessions won’t contain valuable insights about users’ behavior, so you’d end up just wasting time.
That’s why Smartlook lets you use 30+ filters to quickly find relevant session recordings.
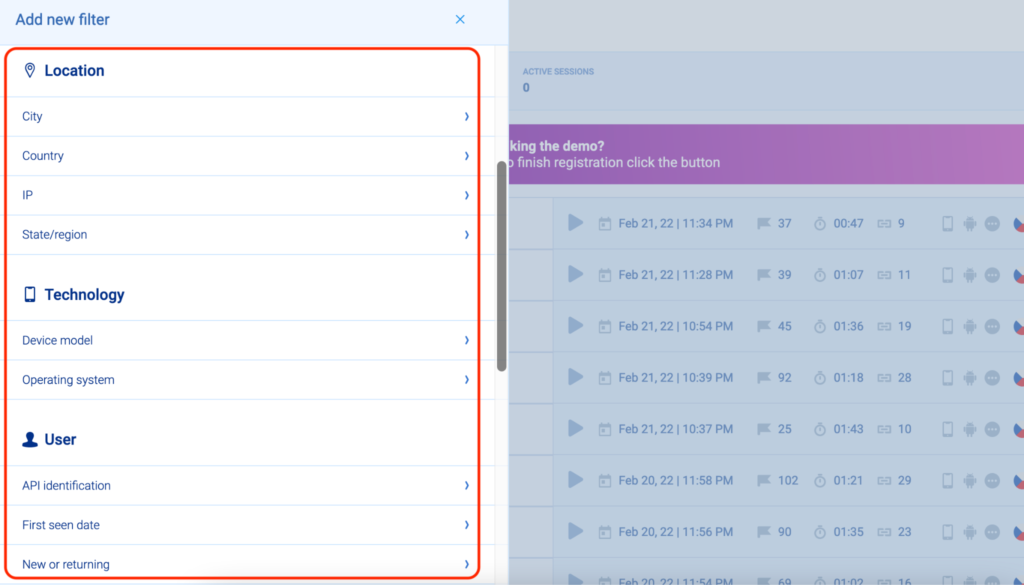
Additionally, you can filter session recordings based on an event that took place. This capability allows you to place that action in the context of the entire user journey, which you can’t do with Google Analytics (or any other tool that doesn’t offer session recordings).
For example, say you have an e-commerce store and you’re tracking user clicks on the “Pay now” button. With Google Analytics, you can see how many users clicked that button and find other purely quantitative insights. However, you won’t be able to get the entire context behind users’ actions (i.e., what they did before and after clicking the button).
In Smartlook, there’s a “Play” button under each event’s name. Clicking that button takes you directly to all session recordings where that event occurred.
In our example, you’d be able to watch all users who clicked the “Pay now” button and see their entire experience.
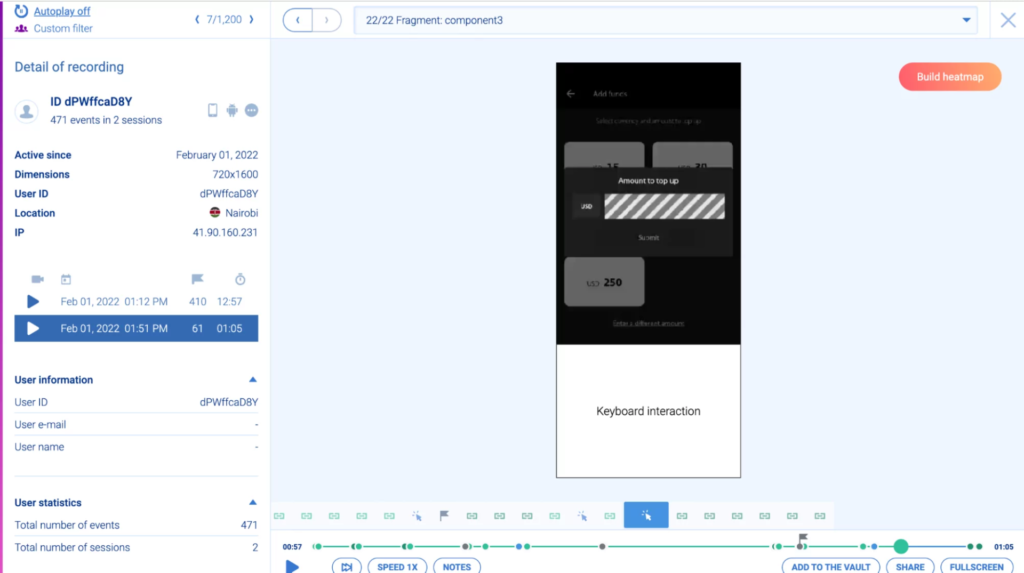
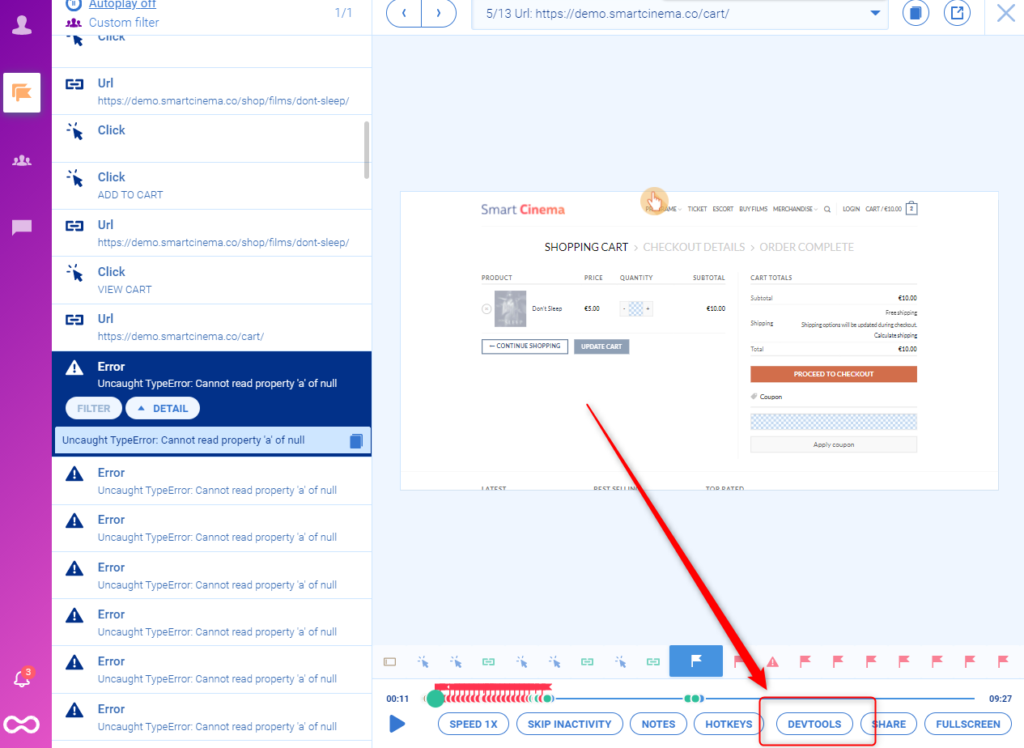
Additionally, Smartlook automatically tracks rage clicks and JavaScript errors as events. This means you can watch sessions where users were frustrated or experienced an error.
In the case of JavaScript errors, you can send the relevant replays to your developers. They can get more information about the error and speed up the debugging process by clicking on the “DEVTOOLS” button.
Build funnels to analyze the user journey through your site (or app) and calculate conversion rates
One of the most important use cases for events is building and analyzing funnels — sequences of steps users take to complete a goal like purchasing a product or signing up for a newsletter.
With funnels, you can analyze users’ behavior across different steps, find out where users drop off and calculate conversion rates.
In Smartlook, you can build a funnel by placing two or more events in the order you believe your users follow. Once you do that, the funnel visualization will appear instantly, like in the GIF below.
As with event tracking, you don’t need to wait for data collection.
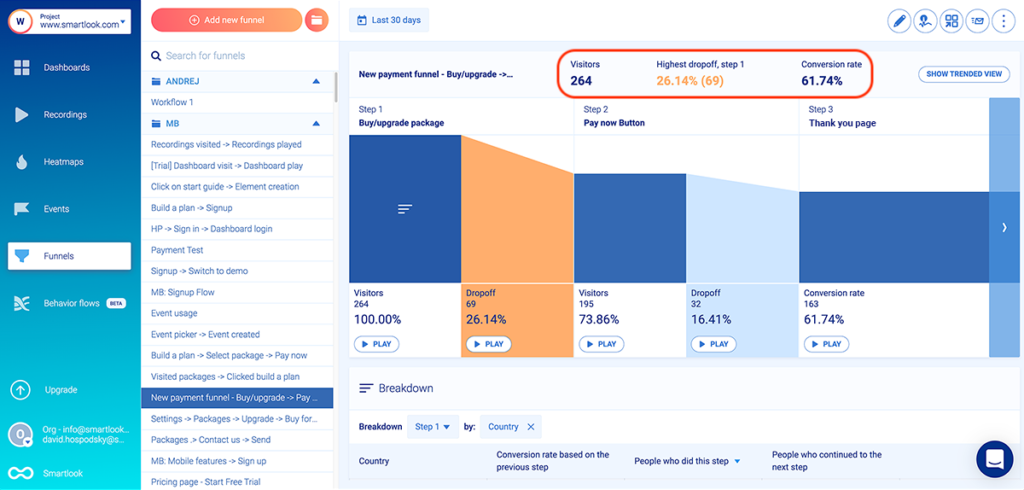
Once you have a funnel, you can see its overall conversion rate, as well as the conversion rates and drop-offs between each step.
And since funnels are just sequences of events, you can build all different kinds, depending on your business goals and users’ behaviors.
For example, an e-commerce store may want to track how many of the users that added an item to their cart completed their purchase. In Smartlook, you can build such a funnel with three events, using our no-code event picker and our drop-down event list:
- Event 1: Users click on “Add to cart” (select the button with our no-code picker to define the event).
- Event 2: They click on the “Pay Now” button (again, select that button with the no-code event picker).
- Event 3: They land on the “Thank you” page (use the “Visited URL” standard event and enter the page URL).
You can get even more granular and add separate events to track text inputs (using the “Typed text” standard event) in the form fields, which users have to fill out.
Building this funnel will provide you with valuable insights into your users’ purchase journeys, including where most of them drop off. However, the funnel itself won’t tell you why they drop off.
That’s why Smartlook also lets you combine funnel analysis with session recordings to find why users drop off.
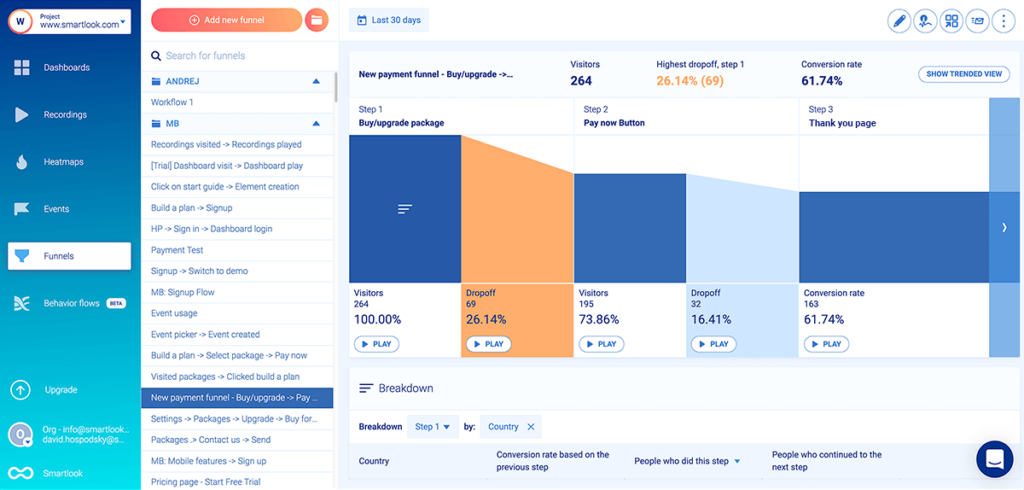
As you can see, the screenshot above shows a funnel where 32 users (16.41%) drop off between clicking “Pay now” and landing on the thank you page.
If you built this funnel in Google Analytics, you’d have to guess why these users dropped off. After all, they clicked on the “Pay now” button, so, in theory, they want to buy and should land on the “Thank you” page. Without being able to see their experience, you’d have no way of knowing what went wrong.
In Smartlook, there’s a “Play” button under each step of the funnel, including the drop-off stages. Clicking that button (in this case between steps two and three) takes you to the session recordings of these 32 users, so you can quickly find out why they dropped off.
For example, you may find that a technical error prevented users from checking out successfully. Or, some of them entered the wrong credit card info and didn’t bother again. In any case, session replays make it easy to find the problem.
You can see how funnel analysis works in more detail with our free public demo (no registration or credit card required).
Use retention tables to analyze user cohorts over time
Many websites and mobile apps rely on users performing specific events regularly to generate revenue.
For example, mobile games typically need high daily usage to generate revenue, so it’s important to track whether people come back to the game each day after first trying it (alongside other crucial metrics like average revenue per daily user).
Smartlook’s Retention Tables allow you to track whether a group of users who performed an event for the first time on a specific date continue to do so over the following days. In our example, retention tables can track how many people log into your game each day after first trying it.
To generate a retention table, you first need to select an event. In the example below, we’re using the account log in event. Once you select the event, scroll down to the “Retention table” section and click on “Generate”
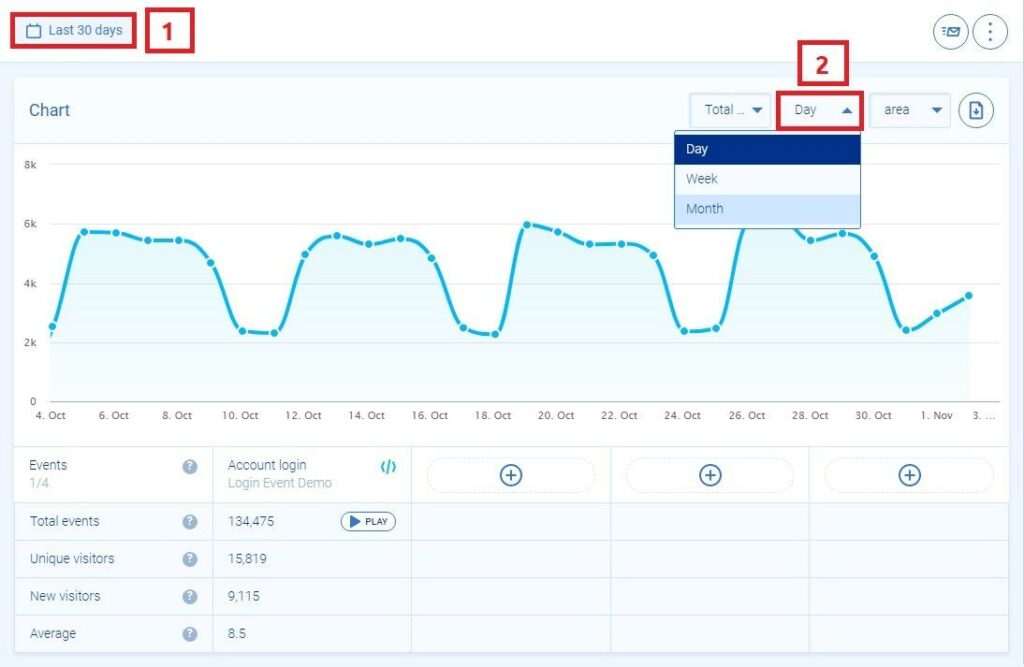
You can select (1) the data range and (2) whether Smartlook should display the data by day, week, or month.
After that, scroll down to the “Retention table” section, click on “Generate”, and you’ll see a retention table similar to this one below.
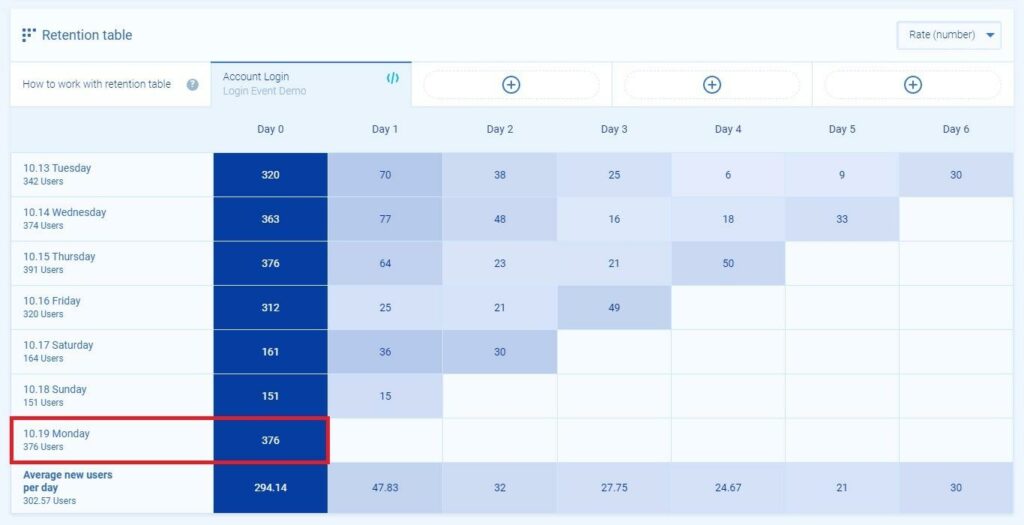
As you can see in the screenshot above, 376 users completed the “Account Login” action on Monday, 10.19, which is our Day 0. This group of users is our cohort, which we’ll track over the next few days.
Here’s the retention data for the next 5 days:
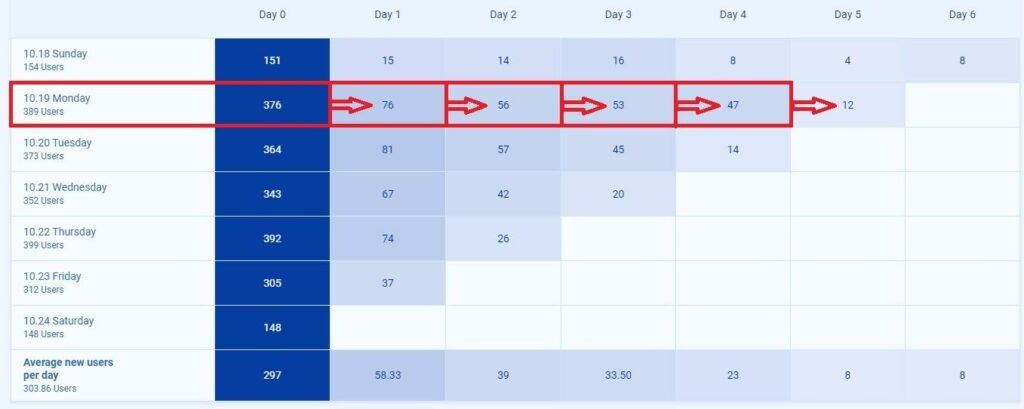
As you can see, on Day 1, 76 (20%) of the 376 users performed the action again.
It’s worth noting that retention tables can be generated for any event you’ve defined.
If you have an e-commerce store, you may want to track how many of the users who buy an item for the first time do so again over the next few weeks.
To do so, you can define an event that tracks when users land on the “Thank you” page after a successful purchase (use the “Visited URL” standard event) and generate a retention table for it.
If you have a website that relies on people reading your content regularly, it might make sense to track how many of the visitors who read an article on your blog for the first time come back the next week. In this case, you’d want to track when users land on a page from the blog (use the “Visited URL” standard event and include all pages containing the word “blog”) and generate a retention table for that event.
Capture all user interactions on your site (or mobile app) automatically with Smartlook
If you’re ready to try the easiest way to track user interactions on your website, you can sign up for a free Smartlook account (no credit card required). Our tool combines the power of quantitative and qualitative analytics, so you can track what users do on your website or mobile app and uncover why they do it.
If you want to see a Smartlook presentation that’s tailored to your business, schedule a demo with our team.