But what exactly are Retention tables?
Retention tables show a group of people that visited your site or used your app for the first time during a certain time frame. They also display the progressive ‘drop-off’ or decline in activity over time for that particular group (a cohort).
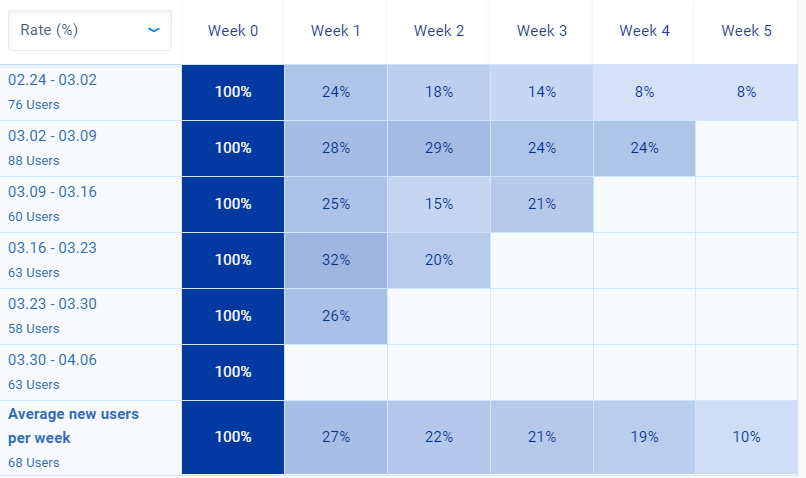
This is what a Retention table looks like.
So why should you use Retention tables?
People who come to your site during a specific time often behave in a similar way. Retention tables help you to look past growth and focus on engagement. If you look at absolute numbers, it’s easy to get a false sense of success. Oftentimes a lot of users might try a function during the first couple of days only to never come back to it.
New users are usually more engaged so when their numbers grow, the averages might be going up even if your retention stays the same. This makes it easy to overlook areas where your efforts could be improved.
And identifying these problems is one of the things Retention tables excel at.
Retention tables are useful for:
- UX designers & Product managers – Retention tables give you detailed information about the adoption and retention of any function.
- Marketers can use Retention tables to analyze the quality of users brought by a marketing campaign and compare it to other sources of traffic.
Imagine you have a project management app:
You could look at how often a cohort from the newest marketing campaign logs in as well as how fast it adopts certain features.
Do they log in more often? And do more of them keep using that new to-do list feature you just introduced? If their statistics tank, maybe it isn’t the best target group.
How to use Retention tables in Smartlook
Retention tables in Smartlook are tied to events.
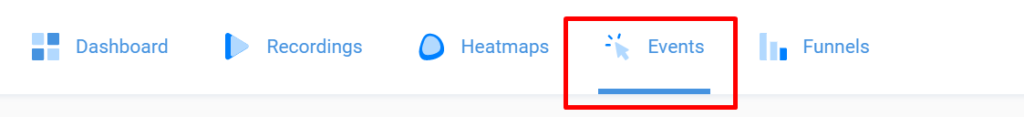
You can find them under the events tab and if you want to tweak what the retention table displays, you can change the settings of the event graph.
There are 2 settings that affect retention tables.
(1) You can choose a date range for the cohort data. A month is a great starting point.
It’s important to note that longer data history in Smartlook makes your cohort analysis more reliable. That’s because data history determines for how long Smartlook can identify the same user as returning.
By default, it’s for 30 days. So anyone who comes back on day 31 will be seen as a new visitor and it will skew your data. That’s why we recommend getting 90 days or a year of data history.
(2) You can choose the precision with which you want to analyze your data. You can switch between days, weeks or months. And different views will be useful in different situations.
We often like to start with data segmented by weeks. This shows significant trends in the way your website or app is used.
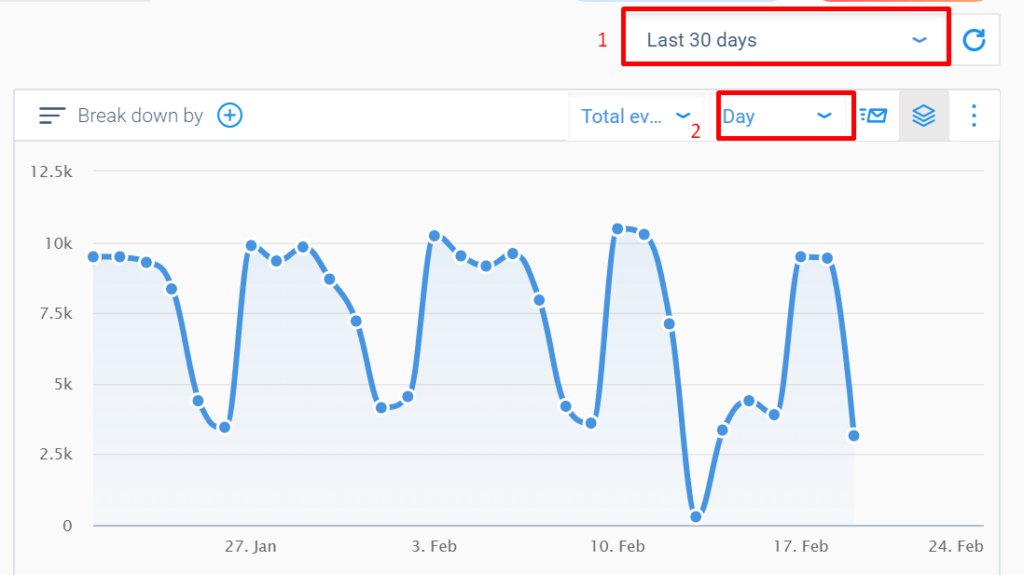
When you’re happy with the settings, scroll below the event graph and statistics and click on the Load Retention table button.

When you click on it, you’ll see a Retention table similar to this one.
How to understand the data
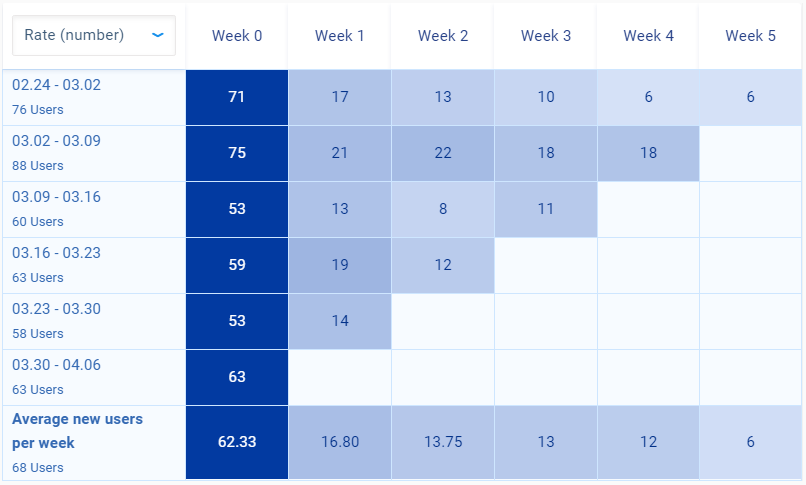
Cohort size (left column)
Cohort size is the number of unique users that triggered an event.
Let’s say you look at a table where cohorts are defined by the week Smartlook has seen them for the first time. You look at a Retention table for the past month displayed for an event tied to visiting a billing page in your app.
So one cohort would be people who started using your app during the first week in February. And their size would be the sum of all people who visited the billing page at any point during the month but started using your app in the first week.
Cell colors
Colors are an important part of any retention table. Events that are triggered more often have darker cells. This lets you see trends in the way events are triggered.
What are the headings of the row labeled week 0,1,2…
The row number 0 might be a little confusing. It’s the first week for a table where each cohort represents a different week.
It’s the first week in a table where cohorts are defined by the week Smartlook has seen them for the first time. And it’s the first month for a retention table where cohorts are defined by months.
So the second day, week or month will be a column with number 1. Some people might already know this from Google Analytics Cohorts and we decided to use the same system to make the switch to Smartlook easy.
Set up Your First Cohort Now
Conclusion
Retention tables are an extremely powerful feature that takes almost no time to use. The data is easily understood thanks to its visual nature and it’s another tool that helps your business thrive. You should definitely try it.