Analyzing historical user data can help you significantly improve the user experience on your website, which can lead to higher conversion rates.
While Google Analytics is one of the best tools available to figure out which digital marketing campaigns are driving traffic to your website, it has a few shortcomings when it comes to analyzing what visitors do on your website.
To analyze user behavior on your website with Google Analytics, a developer has to manually set up tracking for every element you want to analyze (like a button or form field) before the service can start collecting user interaction data (like clicks or text inputs).
Capturing data this way leads to 2 big issues:
- There’s always a delay between realizing you need to track important user interactions and having the data to do so. You may have to wait weeks before your development team implements tracking for an element, especially if they work in sprints. Then, you also have to wait until enough user interaction data is collected.
- You must predict which user interactions you’ll need to track in advance. If you don’t foresee all of these interactions or forget to set up tracking for just one (which is easy with so many possible interactions), you’ll be missing vital user behavior data. If that happens, you’ll have to go through the tracking setup again and wait for new data to accumulate.
As a result, using Google Analytics (and similar digital analytics tools) to find user experience issues can take months between planning, tracking implementation, and waiting for enough data to roll in so that you can analyze it.
What you need instead is a tool that’s built to do retroactive website analytics by default: A tool that automatically collects user interaction data with a single snippet and lets you analyze that data when you need to.
In this post, you’ll learn how our tool, Smartlook, tracks all user interactions across your website or mobile app with one code snippet. We’ll also show you how to use historical data to find and fix user experience issues and find opportunities to improve your conversion rates.
Track all user interactions on your website or mobile app with a single code snippet
With Smartlook, you only need to install one code snippet to start tracking all user interactions.
After you sign up for a free trial, the instructions in our Help Center will help you add the snippet into your site’s HTML (directly or via Google Tag Manager) or integrate it into your CMS.
As soon as the snippet is added, Smartlook automatically starts recording all user interactions via always-on screen recordings. This removes the need to predict what data you’ll need in the future, as user interactions are tracked by default.
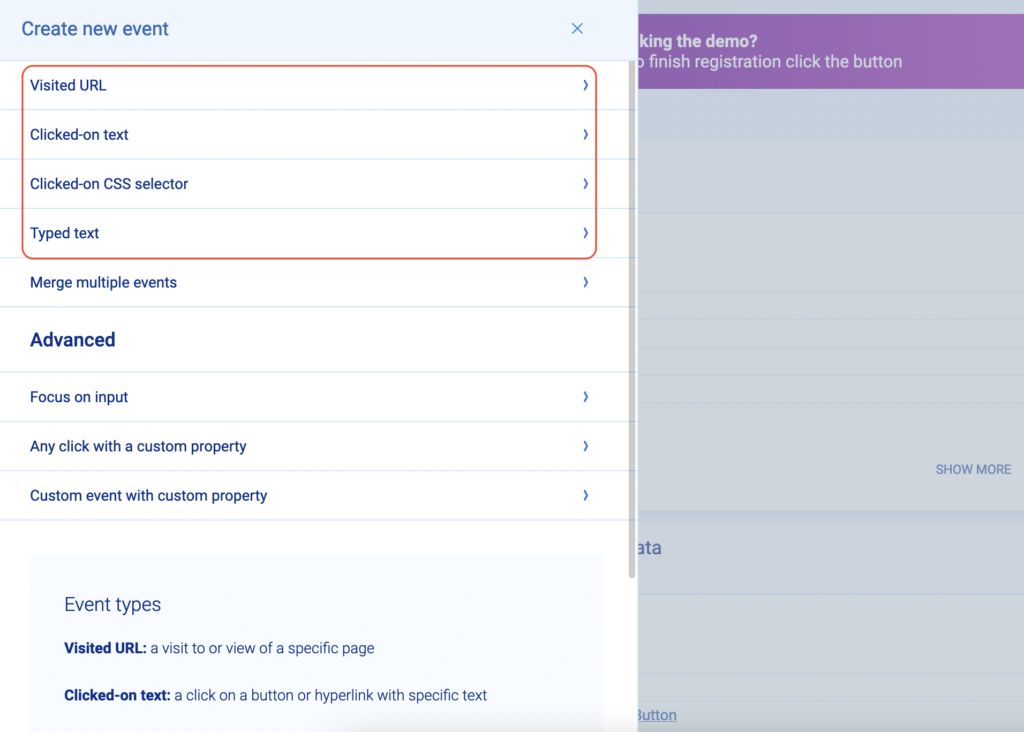
Once the interactions are collected, you can choose which ones you want to appear in your dashboard, so you can analyze them. You can do this by defining standard events like URL visits, button clicks, and text inputs without programming or adding different tracking codes on every element. There are 3 ways to define such events:
#1. Choose from a template of pre-selected events: URL visits, button clicks, text input, or clicked on a CSS selector (allowing you to select any element on the page).
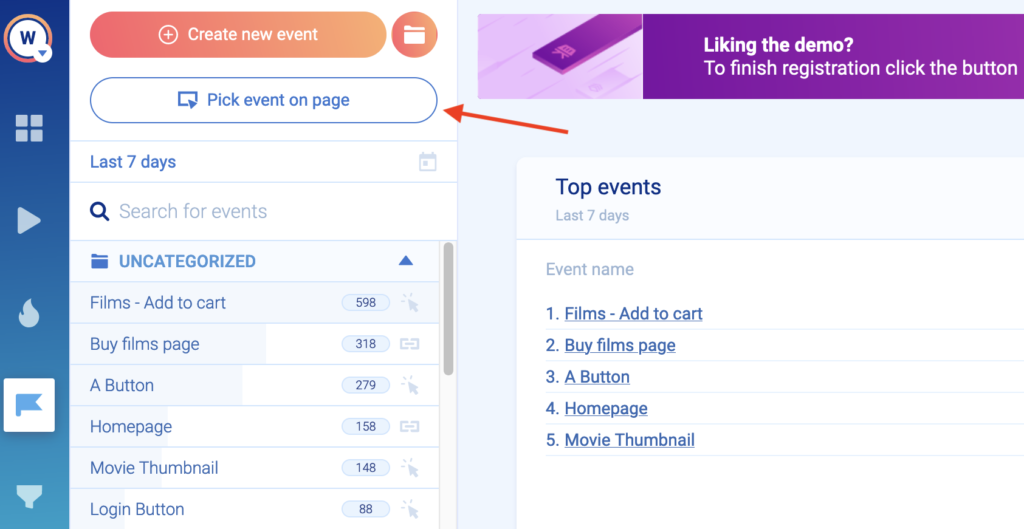
#2. Use the no-code event picker: This allows you to define an event by clicking on your website or mobile app’s UI.
#3. Define events from user session recordings: While watching a recording, you can pause and turn an important user action into an event, without leaving the recording.
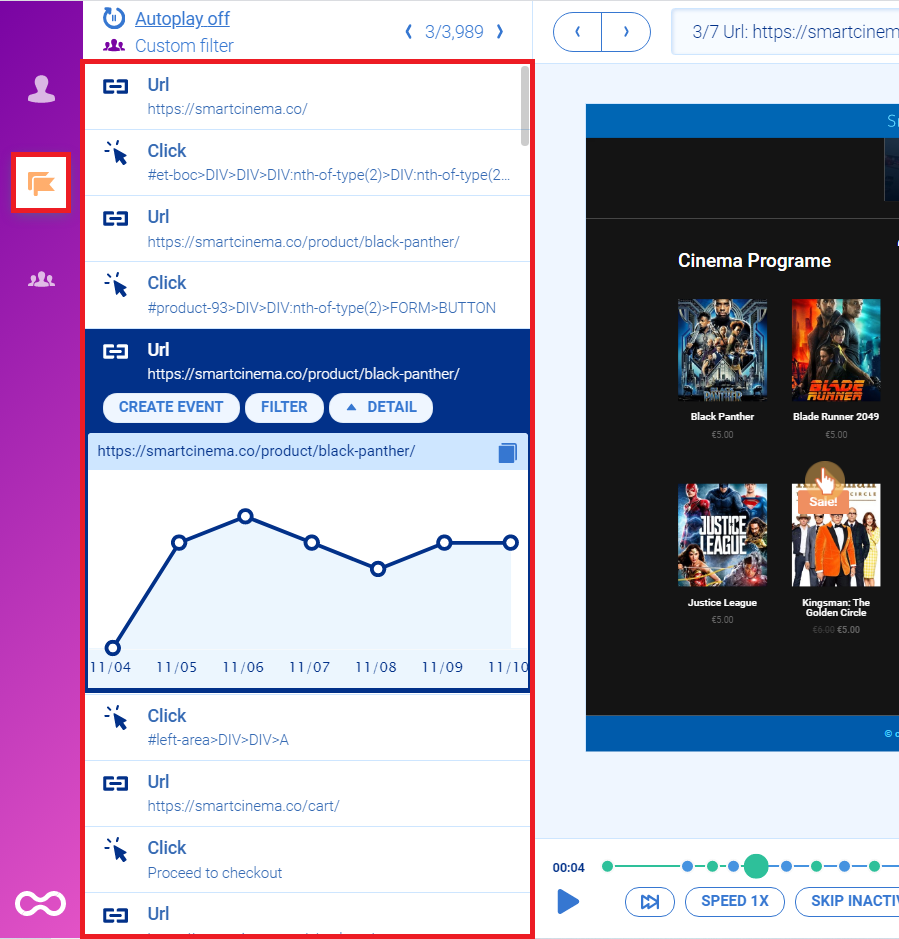
As soon as you create an event, it automatically gets populated with historical data, going back to the moment you added the Smartlook snippet (or as far back as your data retention plan goes).
As a result, you can use historical data to find insights fast, without waiting weeks or months to gather new data.
You can see how event tracking works in detail with Smartlook’s live public demo — no registration or credit card required. Inside the demo, open the “Events” tab on the left, and you’ll be able to analyze events and define new ones by clicking on “Create new event”.
Lastly, you can define custom events to track pretty much anything else outside of the standard interactions. Setting up custom events requires a programmer, as they’re created via JavaScript.
Build and visualize funnels instantly from historical data
Funnels help you visualize the user journey across your website and find out where users drop off.
In Smartlook, you can create a funnel by placing 2 or more events in the order you believe your users follow. For example, you can create the following funnel to track the entire checkout process of an e-commerce store:
- Event 1: A homepage visitor clicks on the shop (select the button with our no-code picker to define the event).
- Event 2: The visitor searches for an item (typed text).
- Event 3: The visitor clicks “Add to cart” (clicked on a CSS selector).
- Event 4: They click on the “Pay Now” button (clicked on text).
- Event 5: They land on the “Thank you” page (visited URL).
You can also build funnels to calculate and analyze other important KPIs like the conversion rate on a blog page or your shopping cart abandonments.
Since they’re a collection of events, funnels also get populated with historical data in real-time, as you can see in the GIF below. This lets you find conversion bottlenecks quickly, instead of waiting for data collection.
Also, since Smartlook captures user interactions automatically, you can add new events to a pre-existing funnel and analyze it immediately, without waiting for new data to roll in.
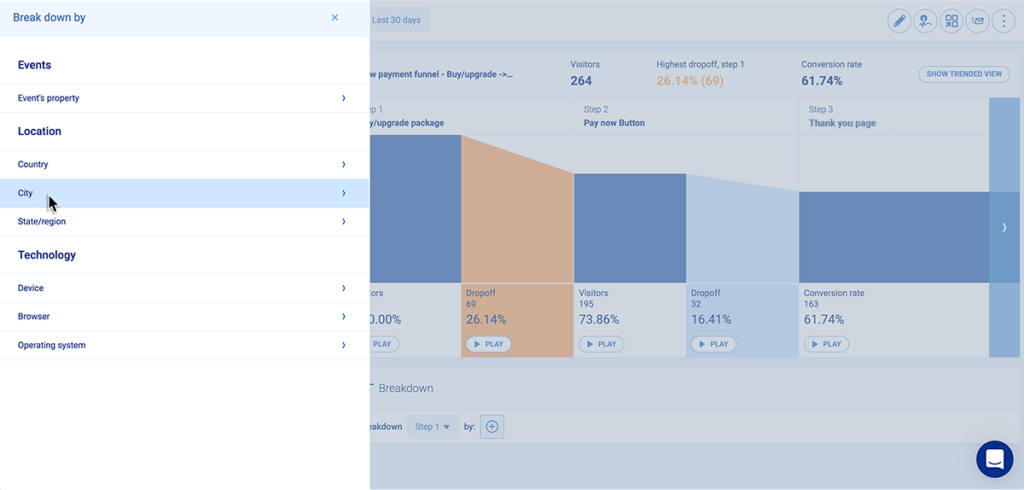
When doing funnel analysis, you can see a breakdown for each step of the funnel by device, browser, country, and other criteria.
Additionally, if your website collects user details (like username or email), you can connect to Smartlook’s API, so these details appear in users’ session recordings.
That way, if you’re watching a session replay, and you see a user experiencing a technical issue, you can have your support team reach out to them via email while your development team investigates the problem.
You can also use our anomalies detection feature to receive notifications (in the app or via email) whenever sharp conversion increases or drop-offs occur in your funnels. As a result, you’re instantly alerted about critical errors, and you can address them much faster than if you were to wait for customers to complain about them.
Again, you can build a funnel yourself or analyze a few pre-made ones with our free public demo.
Watch session recordings to find out why users didn’t convert
Events and funnels are powerful tools, but they don’t tell you why users didn’t convert. That’s why Smartlook also captures screen recordings of all users on your website by default.
You can find those in the “Recordings” tab on the left.
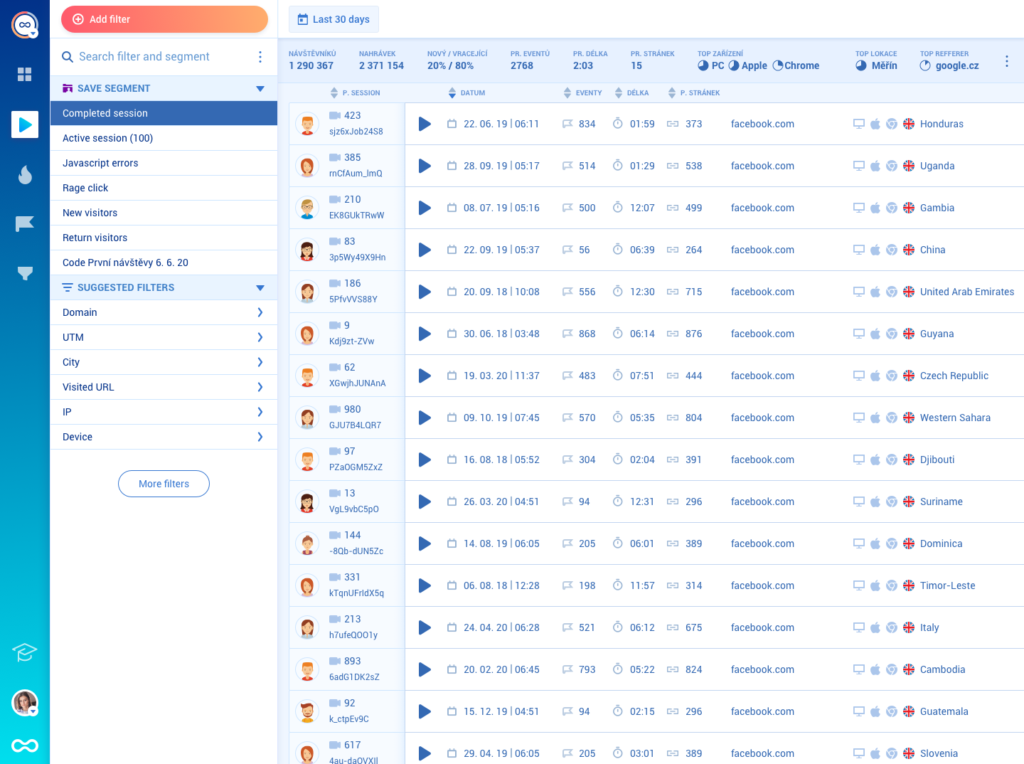
You can use over 30 filters to quickly find the recordings you need. For instance, you can filter based on specific user behaviors (i.e., events) or things like session duration, country, device, and more.
In addition, our tool lets you combine events and funnels with screen recordings, so you can find and fix even more issues on your website.
Here’s how:
When you’re analyzing a funnel, you may find a large drop-off between 2 steps. For example, one of our clients (AstroPay) found a 67% drop between the first 2 steps of their most important sales funnel.
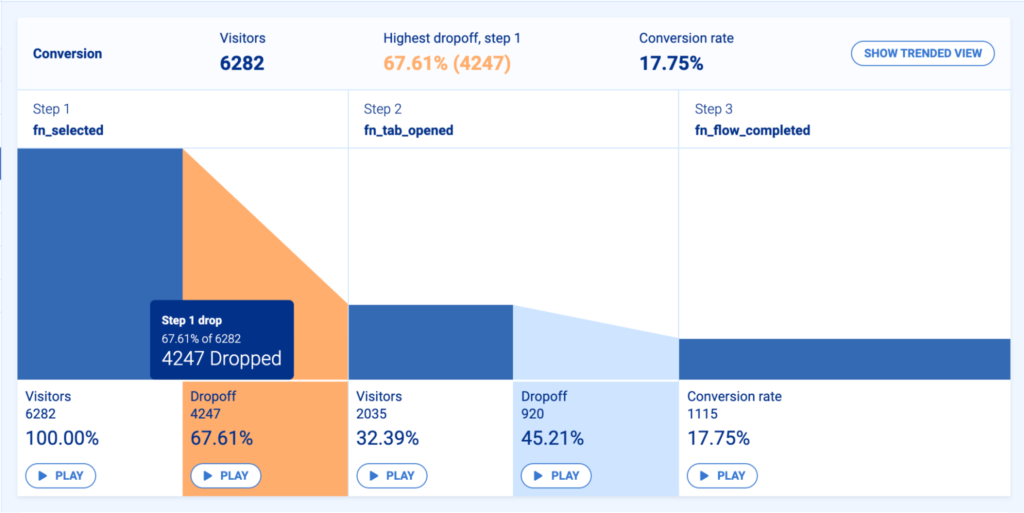
As you can see in the screenshot above, there’s a “Play” button under each step of the funnel. Clicking on the play button takes you to the screen recordings of all users who dropped off at that stage. As a result, you can watch only the recordings of people who didn’t convert, instead of sifting through hundreds of other ones.
By watching the relevant screen recordings, AstroPay’s team was able to attribute the drop in their funnel to a specific user experience issue. The subsequent optimizations to their funnel lead to a 56% lift in conversions.
Create heatmaps from historical data to compare pages after design changes
Besides events and funnels, with Smartlook you can also use historical data to create heatmaps instantly.
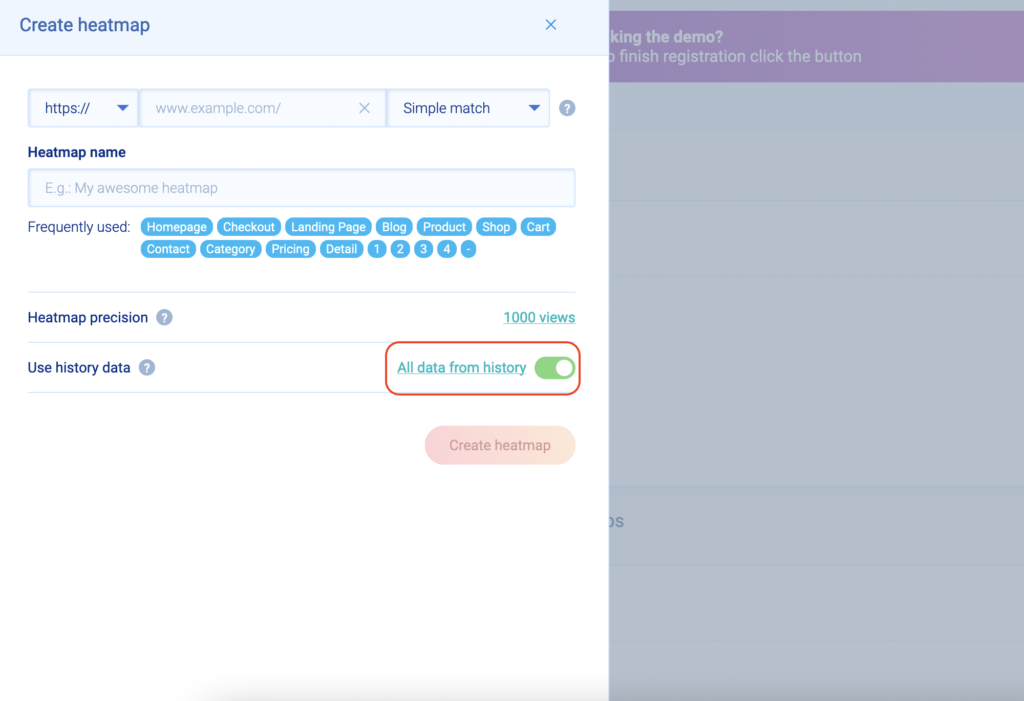
When creating a new heatmap, make sure to enable the “Use history data” toggle (as shown in the screenshot below) and Smartlook will populate the heatmap with historical data.
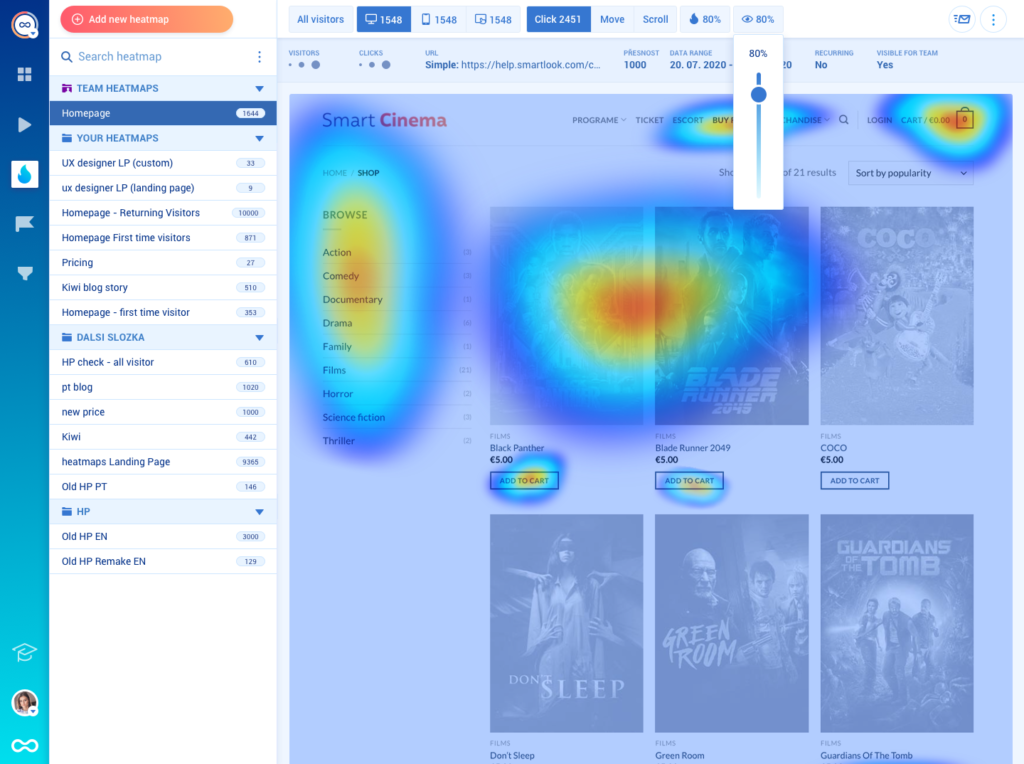
Having access to historical heatmap data (scrolls, clicks, and mouse movements) is useful for comparing metrics before and after making design changes.
By comparing heatmaps of a page’s old version versus its new one, you can quickly see how the user behavior changed. For example, it’s easy to see if more people started clicking an important button or scrolling further down the page after the design change.
Even if you forgot to make a heatmap before a design change, you can generate it retroactively by changing the dates in Smartlook to the time period before the design change. Put simply, you’ll always have relevant data at your fingertips.
Get Smartlook today and never miss another important user interaction on your website or mobile app
If you want to analyze user behavior on your website or mobile app as soon as possible, sign up for a free Smartlook plan or get one of our premium pricing plans (all plans start with a 30-day free trial and don’t require a credit card).
You can understand what your users do and why they do it in 3 simple steps:
- Install the Smartlook code snippet by following our instructions. Once that’s done, Smartlook will automatically start tracking user interactions on your website or mobile app, so you won’t be missing any data when it’s time to analyze your users’ behavior. User interaction data is stored and can be used to define events, build funnels, create heatmaps, and watch session recordings.
- Define standard events without programming. Again, you can track things like URL visits, button clicks, and text inputs without any coding.
- Build and analyze funnels with the help of screen recordings. Once your events are defined, you can use them to create funnels and analyze the entire user journey.
If you want to see a Smartlook presentation that’s tailored to your business, schedule a demo with our team.