As things often are though, it’s easier said than done, and many businesses struggle with finding the golden mean.
Is the same also true in your case? Worry not.
We’ll guide you through evaluating your engagement. Here, you’ll learn where bottlenecks may be located and how to spot them. We’ll also talk about some of the traps you might encounter along the way and, finally, give you some ideas for possible improvements.
So, let’s start with an important question:
Do your users engage with your website?
This may well be the key question when evaluating your website’s design and performance. After all, engagement is often connected with business goals, and measuring it can tell you a lot about the value provided to your visitors.
And here comes a followup question: how can you figure out if users engage with your website?
Running your eyes over an analytics dashboard can give you some information for starters, but you need to dig a little deeper in order to have an accurate understanding. The first step is to establish what you should actually expect and what kind of user behavior is the target.
Later on, choosing the right tools and metrics to suit your questions will streamline your analytics process. This is especially important when assessing the changes you implement, as they will tell you what works best in your case.
After getting this done, it’s time to start working on your website so that you can see improvements in your users’ engagement.
Before we kick off – some points to remember
There are two important factors to consider that are crucial when evaluating your users’ engagement with your website. The first one is the goal that users have in mind when visiting your site, and the second is your website architecture. Sometimes, a high bounce rate can actually mean that your users are achieving their goals.
Why should you keep that in mind? When blindly following general advice (for example, to reduce your bounce rate and maximize time spent on your page), you can jeopardize your efforts. Choosing appropriate user engagement metrics and setting the right goals will help you with using your resources where they’re most needed.
Now we have that covered, let’s get into details!
Your users’ goals
You will often hear that a high bounce rate means your website needs to be optimized. Keep in mind that’s just a rule of thumb though, and you should think about your users’ goals before you apply it.
What should you take into account?
Aspects that are valuable for your users
Let’s take a look at the example mentioned by Sarah Richards in her book called Content Design. Richards was the leader of an award-winning content team for the design of the UK government website. They prepared a page listing down UK bank holidays. As users simply want to know when the next bank holiday will be, they usually won’t spend a lot of time on the page nor go and check out others.
In this particular case, Richards stated: “if people spend less than 5 seconds on this page, that’s seen as an achievement, not a failure”.
Context of your site
Understanding your users’ goals and their expected behavior will help you with setting the right goals. Let’s take the expected time spent on a page. Usually, you’d think that the more time users spend on it, the more engaged they are. However, as mentioned earlier, it all depends on the context. Spending several minutes watching a video or reading a blog post is acceptable. On the other hand, if your users just visit to perform a simple, quick action then a long time spent on the page screams that something needs to be fixed.
New and returning users’ behavior
Similarly, new users will behave differently to returning ones. The former group visits to figure out what your business is about and whether it suits their needs. The second group already knows your site and probably where to find content that’s interesting for them, so they won’t spend as long looking for information.
All of that will be reflected in your statistics.
Your website goals
Apart from serving your users, your website will have several other goals to meet. They may vary from providing your visitors with information to convincing them to book sales demos, and they will modify how you define your goals accordingly.
Let’s consider the example of a landing page. Its primary purpose is to encourage your visitors to sign up for an online course, so you should evaluate the engagement by the action of clicking on that button rather than whether or not they browse through various other pages.
However, when it comes to evaluating that online course you will most likely set different goals again. What counts here is the percentage of parts that get completed and users who finish the course.
User and website goals will often overlap, but that’s only another rule of thumb – website goals will generally be more extensive. Content marketing is the most tangible example here. Apart from providing visitors with the valuable information that they’re looking for, it also aims to encourage them to take specific actions.
That is why it’s essential to think about your website goals separately and adjust the definition of engagement accordingly.
How to evaluate your visitors’ engagement?
Before we jump into optimization and boosting your visitors’ engagement, it’s good to know where you stand so that you can prioritize your work and evaluate your efforts. Let’s talk a bit about ways to assess your website engagement.
The first method is using metrics – if you use Google Analytics, you’ll find the numbers right there. Measuring your visitors’ engagement with this or another similar tool is essential for assessing your effectiveness. Google Analytics is free, and you can find a lot of material on how to set it up.
The second method is connected with user behavior analytics. For this, you’ll need a tool that gives you heat maps and funnel analyses. If you don’t already have one in your toolbox, don’t worry. You can always add one to analyze your starting point a bit later. Smartlook will give you a helping hand! What’s more, it integrates with Google Analytics, so you can have a complete overview of your stats.
Bounce rate
Bounce rate tells you how visits to your site ended without any action. It is calculated as the number of times a user visits the site and then leaves it without clicking on a link or anything else, divided by the total number of visits. Do you remember the example of the UK government’s bank holidays website? This page will report a high bounce rate, but it won’t be a failure.
Time spent on page
This is one of the most self-explanatory metrics – you check how much time your users spend on a particular page. It can tell you if the page helps users to achieve their goals, but, as mentioned, the time depends greatly on the context.
Scroll percentage
This metric shows you how far down on a particular page users scroll to. Usually, most of them won’t reach your page footer and will pay the least attention to it even if they do. As proved by Nielsen Norman Group’s research, people spend almost 74% of their viewing time on a page’s first two screenfulls. The lower they go, the less attention they pay to the content.
Click-through rate
If you want to know more about how many people click on a specific element out of all those who view the page, the click-through rate will give you the answer. It can be useful when assessing the engagement of a landing page.
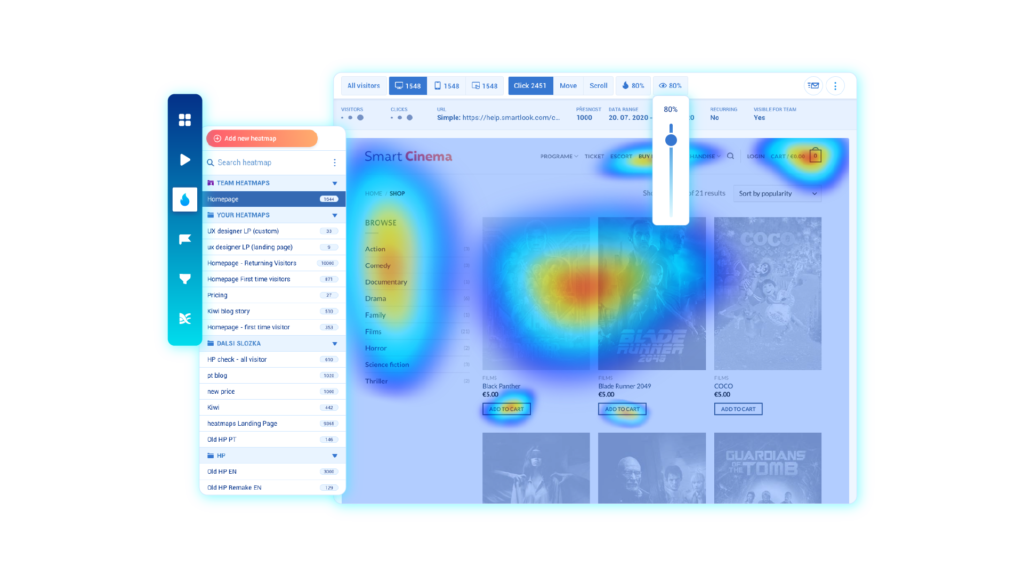
Heat maps
If you ever have come across screenshots of websites with some colorful layers on them, they were probably heat maps. They aim to show you where people scroll, move their cursors to, or click the most (the “hot” areas), and what parts of your page don’t draw their attention.
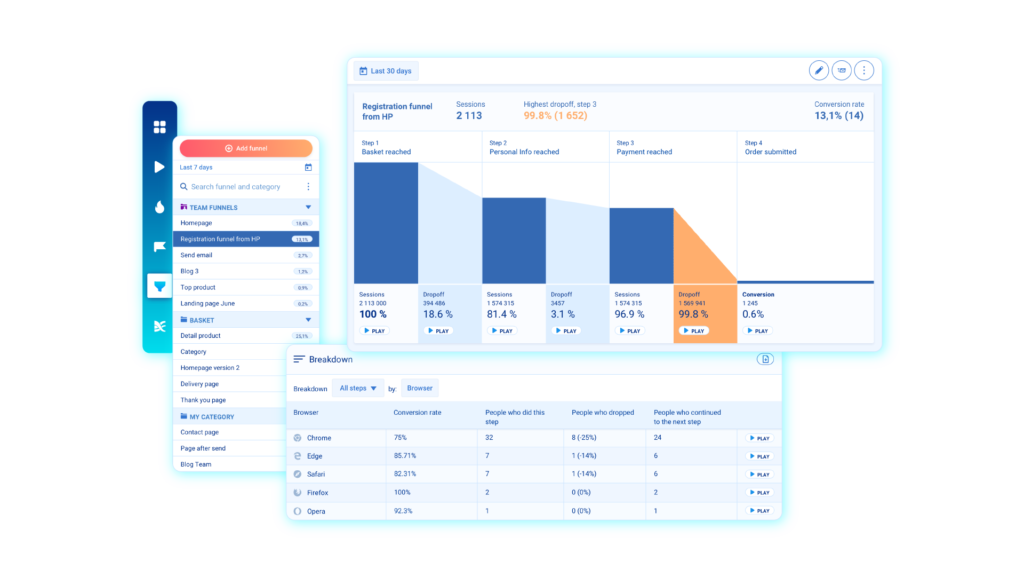
Funnels represent the multiple steps that your users can take on your page. They help you with spotting bottlenecks and noticing if and where a high percentage of users leave your page. Usually, you can see a graphic representation of the steps.
How can you boost visitors’ engagement?
Finally! When you understand where any bottlenecks are and how they affect your visitors’ engagement, it’s time to work on them. We suggest three main areas where you can look for solutions.
Design, content, or information architecture – where will you start?
Work on your design
The way your website is built can strongly influence how engaged your visitors are. Sometimes, they might just not notice the content you have to show. Changes to your design can enable them to find relevant information and, ultimately, achieve their goals.
For example, have you heard about the illusion of completeness? It happens when your users think there’s nothing to scroll down on your page, which leads to them missing valuable content below the fold line. Take a critical look at your page and look for any hints that might indicate there’s nothing more to see. They could be wide blank spaces, fullscreen hero content, or interruptions in the content flow.
Your design should make it clear that there’s something more to see, either with shapes in the background or content peeking from below the fold line.
Polish your content
Sometimes, a lack of engaging content can be the main reason why your users leave your page (too) quickly. It’s a wide topic, which gives you a lot of possibilities to test, but it can also take a lot of resources.
When you suspect content might be the reason for low engagement, you should start by evaluating that which is already on your site and improving it. You can add new pieces of content, covering different topics or changing the format of publication later.
Use internal linking and related content
This is just one of the many elements of information architecture that is crucial for engaging your audience. When you add new content to your site – landing pages, blog articles, or use cases – make sure to update your internal linking. Adding a few internal links to each content piece will allow users to navigate easily and boost your SEO.
Another way of avoiding dead ends is by adding a “related content” section. These usually appear after a blog post or feature page and show other interesting pieces of content. This way you can increase your users’ engagement and deliver them more value, so it’s a win-win situation.
How can you spot dead ends? Start by analyzing your exit pages. For sure, you’ll find some pages from which your users left simply because they didn’t know what to do next. Remember that your goal isn’t to force your visitors to stay – just give them options.
Use tools
For any of the areas where you want to improve your user engagement, tools are a must-have for streamlining your processes. Heat maps and funnels show you areas where you excel and help to assess your progress.
Heat maps – or engagement on a given page
Heat maps are a powerful tool for assessing engagement on a single page. You won’t learn where users are coming from, but it’s the best way to understand what is important from their perspective. Sometimes, you might be surprised by how easily they miss a Call-to-Action button or other crucial elements of your page, and how differently they perceive your design.
Which type of heat map should you use?
Depending on their intended purpose, you can use several different types of heat maps. They are usually divided according to what type of action they represent – clicks, scrolls, or hovers. All of them will give you complete information about how the majority of your visitors behave on a single website.
When analyzing your heat maps, there are three main points you should pay attention to:
Average fold line
The average fold line shows you where the first full screen of a page (usually) ends. Of course, it depends on your users’ screen resolution – both on desktop and mobile versions. Ensure you place all of the crucial information above the fold line and avoid the illusion of completeness.
Call to action placement
Heat maps will tell you whether users notice your call to action or if it rather blends with other elements of the site. Sometimes the most important button appears just below the fold line, and simply because of that it gets less attention. When you suspect that there could be a problem, changing your design and comparing two heat maps afterwards will help you make a quick assessment.
Rage clicks
Sometimes users expect interactive elements where you haven’t put them. For example, an image could be perceived as a button, and therefore people on it to try and make it work. When their frustration grows you can spot it as rage clicks, which are actually one of the few ways to notice your users’ emotional state.
Rage clicks on your heat map indicate what elements should be changed in order to avoid misunderstandings.
Heat maps in Smartlook
A heat map can itself make your life easier, but some additional features will help you make the most out of it. For example, in Smartlook, you can use your cursor to the areas that interest you the most and see the percentage of total clicks made there. You can also share heat maps in a brief moment, which streamlines cooperation between you and your colleagues.
Smartlook also lets you compare different user behaviors, like clicks, scrolls, and cursor movements. You can also create separate heat maps for new vs. returning users, which will help you gain a deeper understanding of what’s going on on your webpage.
In the paid plans, you can create your heat maps based on historical data – going back in time for as long as you have the data for in Smartlook. This is really useful for a quick comparison of different page designs.
Funnels – or engagement through your entire website
When you want to learn more about how your users move through your website – or, in other words, the user journey – funnels are a gold mine. You can notice if a given option improves the engagement or from which page users tend to leave.
When to use funnels?
Funnels are there for you when you want to understand if the path you designed works for your users. They are especially useful when evaluating your checkout process or other, more structured paths. Users will naturally drop out of each step of your funnel, but if you notice a huge disparity then you will know where you should work on improvements to optimize your funnel.
Funnels in Smartlook
Smartlook gives you advanced, yet easily understandable funnel options. You can create funnels based not only on URLs or what pages your users have visited, but also on events like hitting a certain button.
After creating a funnel, you can have a peek at the sessions where your users dropped out. Watching some recordings can help you get an idea of what could be improved. Have you got an idea for another funnel? Unlike Google Analytics, you won’t have to wait for data to be gathered: Smartlook works retrospectively.
Learn as you go
This might be the most important point: when you analyze the engagement and implement changes, you’ll observe what works for your audience. These insights are priceless. As much as guides (like ours) can give you some inspiration and ideas, you won’t find a ready-to-go recipe for instantly increasing engagement on your website.
Working on your engagement should be a continual process. Keep in mind that your audience can change and grow with you, so something that delivered value a year ago might not necessarily work tomorrow.
After all, that’s what business is about.
Key takeaways for boosting your users’ engagement:
Think about the expected user behavior
As we have mentioned, it won’t always be intuitive and clear at first sight. Give it proper thought and don’t fall into the trap of vanity metrics.
Set your goals according to your users’ needs, not Internet hacks
Internet hacks won’t work for everyone. Make sure to be mindful and only implement ideas that respond to your specific needs and situation.
Measure your engagement both on a single page and in funnels
Using different ways to measure user engagement helps you get a complete overview of your situation for prioritizing your work. After all, you won’t fix everything in a day.
Analyze and learn what works for you
Working on your users’ engagement is not a single action. Treat it as an ongoing process, and improve with each iteration.