Firebase Crashlytics is one of the most popular tools for detecting and potentially fixing app crashes. However, Crashlytics (like other traditional crash reporting tools) has a huge limitation: it focuses on diagnosing crashes rather than offering insight into user behavior and interactions.
Furthermore, Crashlytics doesn’t offer a visual playback of user sessions. It lacks the ability to show you exactly how users interact with your app, including gestures, taps, and navigation paths.
While viewing interaction logs preceding an incident (the only context you can access in Crashlytics) is helpful, the ability to visualize real user journeys provides a much deeper understanding of how users engage with your app.
In this article, we’ll show you how Smartlook overcomes these problems by combining crash reporting with mobile app session recordings. Specifically, you’ll learn how to see the exact situations in which bugs and crashes happened, so you can avoid relying on users’ explanations, or trial and error, to reproduce crashes.
Then, we’ll also compare five other Crashlytics alternatives you may want to consider. Here are all the tools we’ll cover below:
Start fixing crashes and improving your mobile app’s experience with Smartlook’s full-featured, 30-day trial — no credit card required.
How to read mobile crash analytics
Before we jump into Crashlytics alternatives, let’s break down the process of reading and interpreting crash reports to help you better understand which features you should look for in your crash analytics toolkit.
Beginners stop the Build → Ship → Monitor → Improve cycle at step 2.
Here’s how professional developers with experience operate:
– They always add analytics to their apps
– They always add crash reporting to apps
– They add remote logging to monitor code health
This allows professionals to monitor and learn from their mistakes.”
Crash analytics should provide you with insight into app issues and the reasons behind crashes — a combination of features rarely found in one tool. When a crash occurs, the following ideal chain of events (if you’ve implemented tools from our recommendations) occurs:
- Receiving an automated alert. This is a basic functionality of any product monitoring app, so this one shouldn’t be a problem
- Looking for the pattern. Is it a one-off bug, or has it occurred multiple times?
- Backtracking the crash. This is where you attempt to recreate the exact sequence of user actions leading to a crash using the information provided in the crash report. This is where having a tool that records each and every user session is a lifesaver
- Determining the type of crash and its nature. Is it specific to the device model or OS version?
- Diving deep into the stack traces provided. Look for patterns or recurring errors in the stack trace that might indicate a common issue across multiple crashes
- Prioritizing crashes based on the impact. It’s clearly not the only crash affecting your mobile app performance, and you’ll need to assess its impact on the user experience (UX) before putting it on your to-do list
- Fixing the issue. Once you know the reason behind the issue, it’s easy to implement necessary code changes
With the right mobile app crash reporting tools in your tech stack, the process is rather straightforward. However, if your app is available on both Android and iOS, there are a few additional considerations:
- Your toolkit should combine crash reporting tools for Android and iOS so you don’t have to switch between different systems for mobile crash reporting
- You should be able to search and segment by error source to easily distinguish between Android and iOS app crashes. In some tools, you can’t do that
- Look for the ability to set up custom alerts by OS. This way, you can ensure the issue is assigned to the most relevant team immediately
Can Crashlytics help you with all these tasks? Definitely. Are there Crashlytics competitors that could help you fix crashes more efficiently? Plenty. When you know what you’re looking for, you can find the best mobile crash reporting software for your needs.
1. Smartlook
- Session Recordings: Yes.
- Free Plan: Records up to 3,000 user sessions/month (no credit card required).
- Paid Plans: Start at $55/month with a free 30-day trial (for our pro plan).
Smartlook is the only combined product analytics and visual user insights platform that won’t take your team forever to set up. Smartlook’s main focus is on helping you understand and improve the user experience on your site or mobile app through a mix of quantitative and qualitative analytics features.
Smartlook vs. Crashlytics
- Smartlook records real user sessions so you can see exactly what a user saw or did before a crash occured
- Alongside session replays, you get access to a wide range of product experience analytics tools, including heatmaps and user paths
- Smartlook is a comprehensive web and mobile app analytics solution, whereas Crashlytics only supports mobile app crash reporting
However, besides these analytics capabilities, Smartlook also has Crash Reports for Android and iOS mobile apps (which will also be available for iOS apps and web projects in the future). In fact, combining crash reporting with one of our key qualitative analytics features — session recordings — helps you get all the visual and contextual info needed to quickly debug crashes.
Here’s how:
Combine crash reporting with session recordings to see exactly how crashes occurred
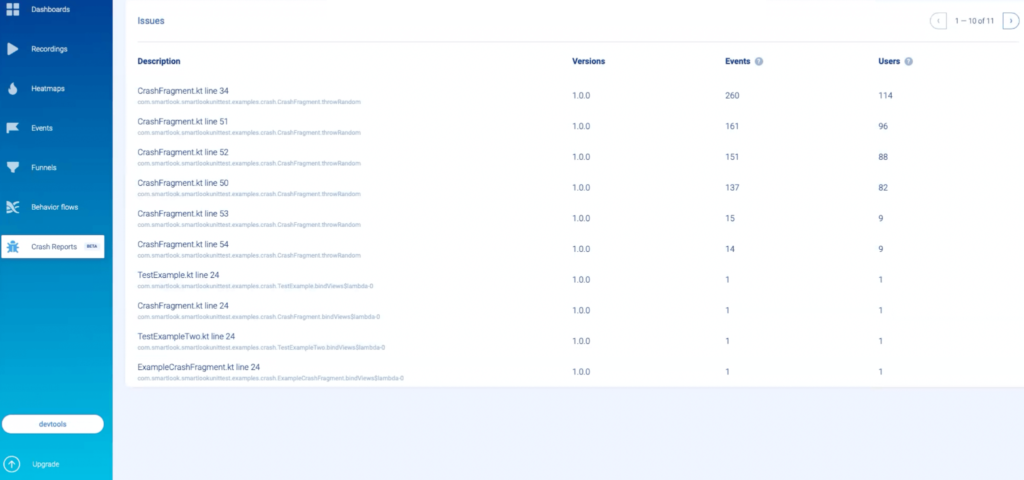
When you open Smartlook’s Crash Reports, you get a list of all crashes, grouped together by the first three lines of the stack trace. You can also see information about the version (or versions) of your app where a crash occurred, as well as the number of users that experienced it.
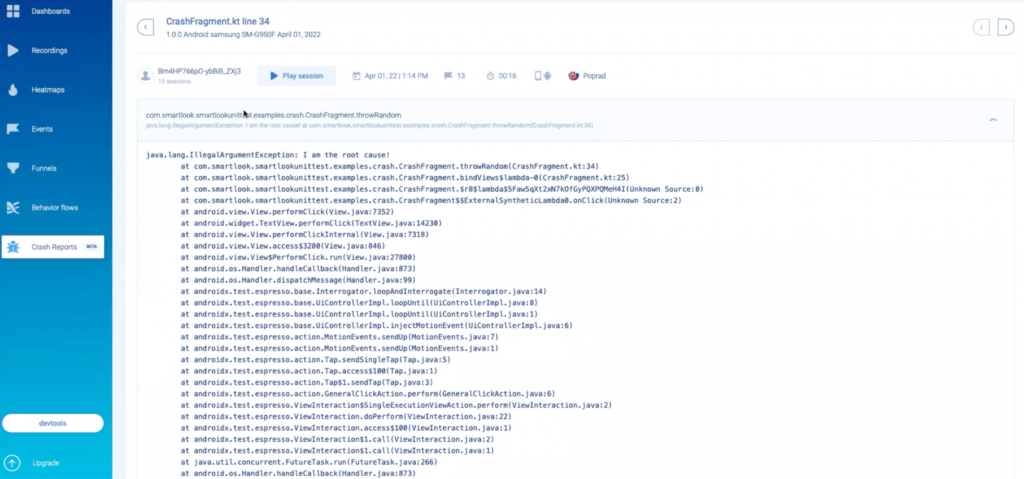
When you click on a specific crash fragment, you’ll be taken to a new screen. There, you can analyze the entire stack trace and see the number of sessions this crash happened in, as well as details like the user’s platform, device, date, and country.
Now, traditional crash reporting tools can provide you with this same information. In some cases, they also throw in a bit more data about users’ devices (memory, CPU, etc.) and a text-based representation of user sessions.
From here, it’s up to your QA and dev teams to diagnose and fix the problem, without actually seeing how it occurred. As we said, this can be incredibly challenging and often unsuccessful, especially for large products with complicated codebases.
With Smartlook, you can click on the “Play session” button above the stack trace and watch all session recordings where this crash happened.
Session recordings show you users’ real-time experience in your app, from the moment they open it to the moment they close it. This means you can see every interaction inside every user session leading up to a crash.
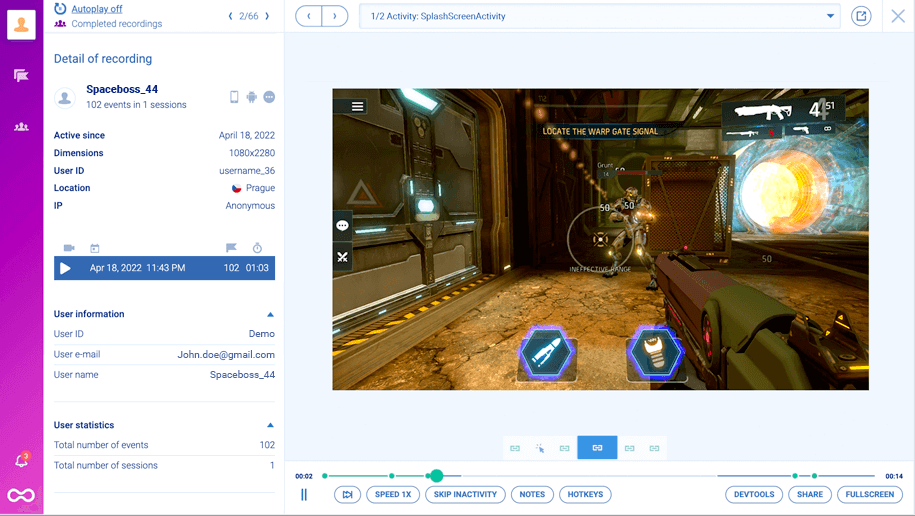
For example, the screenshot above shows a mobile game session recording. As you can see, this isn’t a text-based representation of a session or a list of events, which some crash and bug reporting tools provide. You see everything exactly as your users saw it.
Having access to both the stack trace and relevant session recordings has three vital benefits:
- Faster debugging. Since you can see the exact situation in which a crash occurred, you don’t have to reproduce it blindly. Instead, your dev and QA teams start debugging with lots of useful information, like where the crash occurred (via the stack trace), how it happened (via the session recording), details about the users’ device, and more. This speeds up the debugging process tremendously.
- Fixing bugs you otherwise couldn’t have. As we said, without access to session recordings, devs and QAs often have to reproduce problems via trial and error. When this fails, issues remain unsolved. For example, say you have a banking app that crashes when users open the check deposit feature and try to turn on the camera. A tool like Crashlytics would only show that the crash happened on the line of code where the camera was initialized. If you can’t debug it with this information, it goes into the non-reproducible pile. But with Smartlook’s session recordings, you can see lots of other useful details. For example, you might see that the user didn’t enable permissions for the camera, which the app can’t handle correctly and crashes as a result. These details can help you resolve bugs that you couldn’t have with only a stack trace or a text-based representation of user sessions.
- Allowing more people to participate in the debugging process. Crashlytics and most other crash reporting tools are typically used by developers and some QAs since you need technical knowledge to interpret their information. Conversely, Smartlook has a much lower barrier to entry — anyone can open the Crash Reports, watch relevant session recordings and send them to the dev team along with the stack trace. As a result, product managers, UX professionals, and other non-technical roles can join the debugging process, making the jobs of devs and QAs much easier.
Looking for a session replay tool to complement your Crashlytics reports? Smartlook integrates with Crashlytics and automatically connects recordings to crashes, giving you all the context you need to fix issues with ease.
Use the Identify API to quickly find and fix bugs reported by users
Crashes (and bugs in general) are often reported by users who are already annoyed by them. And if your team doesn’t have access to session recordings, they have to ask users for explanations about what they were doing when the app crashed.
Oftentimes, users can’t remember exactly what they did. Or worse, they get more annoyed from having to answer questions that they stop using the app altogether.
To avoid this issue, Smartlook has an Identify API, which you can set up if your app collects some user identification details like username or email. When the API is set up, the identifier will show up in users’ session recordings (as you can see in the lower left-hand corner.)
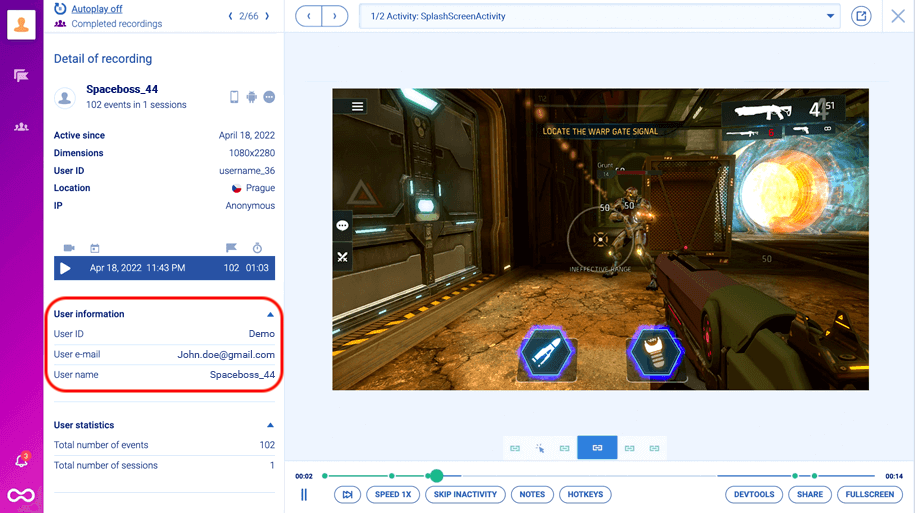
So, when you’ve set up the Identify APIand a user reports a crash, you can look up their session recordings instantly by their identity. As a result:
- You don’t need to ask several questions or rely on users’ explanations.
- Your support team can resolve issues that don’t require dev or QA assistance on the spot.
- You provide a much better experience for users because their issues can be resolved much faster, without them having to answer several questions.
In fact, Vertigo Games’ QA team uses the Identify API and session recordings to quickly reproduce and fix issues reported by users.
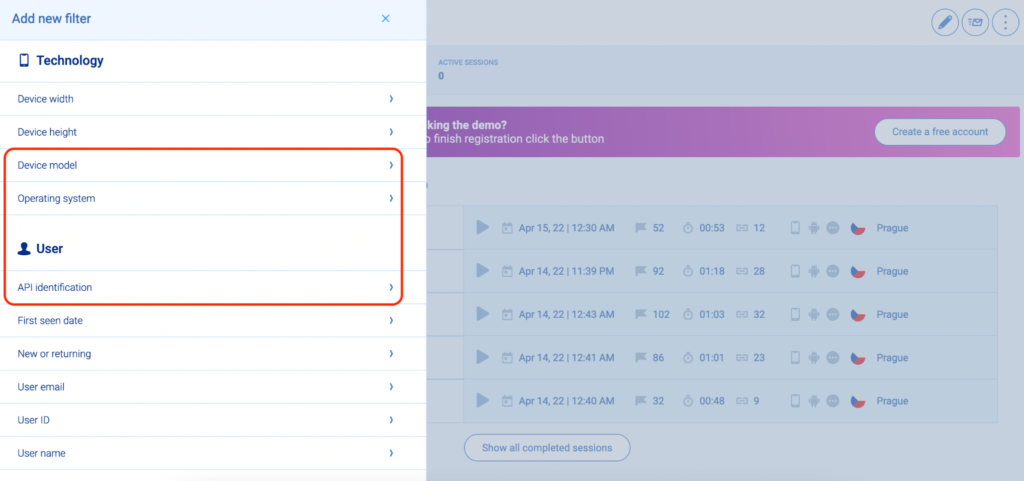
And even without identification, you can still locate the relevant session recordings from a specific date and filter them by operating system and device type. You only have to ask users about their device and the date when the crash occurred.
Wireframe rendering modes: Record sessions without affecting user experience or exposing personal data
In general, session recording tools are underutilized by dev, QA, and product teams as a way of tracking the behavior of mobile app users.
Two potential concerns that may prevent some teams from using session recordings:
- Some session replay tools can be very taxing on users’ devices. In other words, they may lead to fast battery drainage, high CPU usage, additional network traffic, and even app crashes, especially on older devices.
- Some teams may be worried about revealing sensitive data (passwords, emails, credit card info, etc.) in the recordings.
We take these concerns seriously, which is why we created our wireframe rendering modes for Smartlook. These rendering modes (along with a few other features) allow you to automatically capture users’ sessions, without affecting their experience or compromising their personal data.
When one of these rendering modes is turned on, Smartlook draws a representation of the content on a screen, instead of the UI as the user sees it.
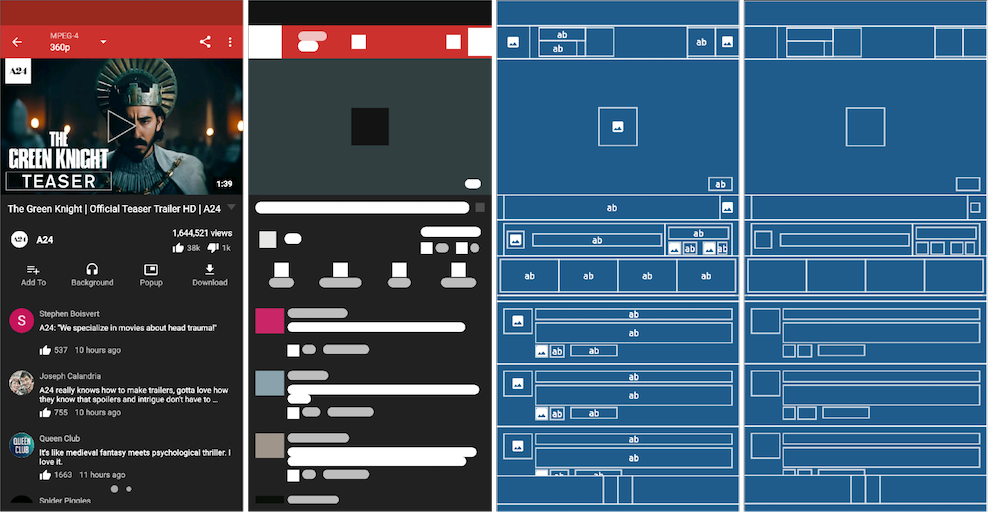
You still see all user interactions, only the UI elements are replaced by an abstract representation.
Recording in a wireframe mode is much less taxing on users’ devices compared to capturing the screen as they see it. It’s also great for protecting personal data automatically, as inputs like emails and passwords are never captured. This is a much easier way to protect personal data compared to blacklisting specific elements (which you can also do with Smartlook.)
To learn more about the mechanisms we use to protect users’ information, check out our detailed documentation on handling sensitive data.
While the wireframe rendering modes are useful for many teams, they’re not ideal for every app. For example, they likely wouldn’t work for a first-person mobile game.
But for many other apps, session recordings in wireframe mode can be incredibly useful, even though the UI doesn’t look exactly as the user saw it. You can still find the reason for the crash, as you see all user interactions in the order they took place (along with the stack trace and details about users’ devices.)
Smartlook’s additional analytics features
As we said, Smartlook isn’t just a crash reporting and session recording tool. It’s a combined product analytics and visual user insights platform that helps you see what your users are doing and uncover why they’re doing it.
Here are a few of our other features (outside of crash reporting and session recordings), which can help you improve the experience on your site or app:
- Event tracking.Events are user actions, which you can track over time, like account logins, button taps, or in-app purchases. With Smartlook, you can track some events without coding, use JavaScript to track custom events, and filter session recordings by an event that took place in them.
- Funnel analysis.Funnels are sequences of steps (events) that users take to complete a goal, like buying a product or completing an onboarding tutorial. Building and analyzing funnels shows you how many people move from one step to the next through key user flows, as well as the conversion rates between each step.
- Anomalies detection.Anomalies alert you when there’s a sudden spike or drop in the occurrence of an event or in the conversion rate of a funnel. You can get alerted via email or can even set up a webhook to receive alerts in another tool (like Slack).
- Retention Tables. Retention Tables allow you to track user cohorts over time and calculate retention rates. We’ve shown examples of how you can use Retention Tables and track essential metrics like daily active users in our article on mobile game analytics.
Lastly, if you want to see how Smartlook compares to other mobile analytics tools like Mixpanel, Firebase (Google Analytics), and Adobe Analytics, check out our article on the 11 best mobile app analytics tools.
Start analyzing and improving the experience of your website or mobile app’s users with Smartlook’s full-featured, 30-day trial today — no credit card required. If you need more time to evaluate, use our forever-free plan as long as you need.
2. Sentry
- Session Recordings: No.
- Free Plan: Available, but there’s no information about its limitations.
- Paid Plans: Start at $26/month with a 14-day trial.
Sentry is an application performance monitoring and error tracking tool that helps developers fix frontend and backend issues. It’s compatible with lots of frameworks and languages including JavaScript, Python, React, Angular, and more.
Note: You can integrate Sentry with Smartlook, which lets you see links to visitor recordings in your Sentry issues.
Sentry vs Crashlytics
- and error tracking in one place. Crashlytics focuses on, you guessed it, crash analytics
- Besides crash reporting for mobile platforms (iOS and Android), Sentry can be used for web app performance tracking
- Sentry offers open-source SDKs, allowing developers to customize integration according to their specific needs, making it a better solution for fast-growing teams
- Sentry captures session screenshots, giving you more context into app crashes than Crashlytics
3. Bugsnag
- Session Recordings: No.
- Free Plan: Detects up to 7.5k error events/month and has only one user seat.
- Paid Plans: Customizable, based on how many error events you want to track and the number of user seats.
Bugsnag is a full-stack error monitoring and app stability management platform. It focuses on helping developers make data-driven decisions about their apps, easily move through debuggingworkflows, isolate events by stack trace, thread, device, custom attributes, and more.
Additionally, Bugsnag can quickly send notifications when something goes wrong, allowing developers and QAs to triage issues right away.
Bugsnag vs Crashlytics
- Similar to Sentry, Bugsnag supports various platforms, including mobile (iOS, Android), web applications, and server-side applications
- Bugsnag offers workflow and collaboration tools that Crashlytics doesn’t
- With Bugsnag, you can track issues across release stages and set stability targets
4. Luciq
- Session Recordings: No.
- Free Plan: No free plan, only a free 14-day trial.
- Paid Plans: Start at $149/month with crash reporting being an add-on that costs an extra $99/month.
Luciq is an observability and performance monitoring platform. While Luciq is mostly known for its app performance and bug-reporting capabilities, it also offers an in-app chat feature, which can be used to ask users for feedback in real-time.
Note: Luciq has both session profiler and screen recording features. The session profiler provides data on the state of user devices and your app before a crash, while the screen recording feature lets users record and attach a video to their bug reports.
Luciq vs Crashlytics
- As has been said, Luciq’s main advantage over Crashlytics is in-app bug reporting. Users can share their feedback and inform you of arising issues right within the app interface. And you can respond to users who reported issues as well
- The platform supports release stability management and tracking
- In Luciq, you can also access recordings of user sessions one minute before a crash occurs
5. UXCam
- Session Recordings: Yes.
- Free Plan: Records up to 10,000 total user sessions.
- Paid Plans:Pricing is customizable based on how many sessions you want to record per month.
UXCam is an analytics solution that helps mobile teams analyze users’ behavior with session recordings, heatmaps, events, and other analytics features. This solution also has a crash handling feature (i.e., crash reporting). Similar to Crashlytics, the platform is primarily built for mobile app tracking.
Note: While UXCam records user sessions with crashes and Application Not Responding errors (ANRs), they don’t have different rendering modes to minimize the impact on users’ devices. Reviewers note that this can make it difficult to work with screens that contain private information. And many reviewers note experiencing delays getting their sessions.
UXCam vs Crashlytics
- Similar to Smartlook, UXCam emphasizes user experiences behind app performance
- UXCam records user sessions, giving you more context into occurring issues than Crashlytics
- WithUXCam, you can filter sessions by crash count, quit rates, or rage taps
6. Rollbar
- Session Recordings: No.
- Free Plan: Reports up to 25,000 error events monthly.
- Paid Plans: Customizable based on how many error events you need to detect per month.
Rollbar is error-tracking software that allows developers and QA testers to continuously monitor and optimize their code. It’s a simple, affordable solution for small product teams.
Rollbar vs Crashlytics
- Rollbar offers unique functionality for queuing, grouping, and prioritizing errors
- It’s available in all popular languages and frameworks and goes beyond mobile app crash reporting
- Rollbar’s AI-assisted workflows enable automated error resolution
Try Smartlook today and see exactly where and how crashes occur
If you want to see how Smartlook works in detail, start a 30-day, full-featured trial — no credit card required.
Smartlook’s Crash Reports are available for both Android and iOS apps right now but we plan to release them for iOS apps and web projects in the future. Outside of the Crash Reports, Smartlook’s main analytics features — session recordings, events, funnels, heatmaps, retention tables, and more — are available for both mobile applications and websites.
Overall, Smartlook has SDKs for 10 native mobile app platforms, frameworks, and engines — including iOS, Android, React Native, and Flutter. We have detailed documentation to guide you through the implementation, but if you need any assistance, our Support team is ready and waiting.
Smartlook can be used on all kinds of websites, including ones built with popular CMSs like WordPress, Joomla, and Shopify. Implementing Smartlook on your site is as easy as pasting a code snippet directly or via Google Tag Manager.
Lastly, Smartlook has integrations for A/B testing solutions (like Google Optimize and Optimizely), CRMs (like Salesforce), analytics platforms (like Google Analytics), and other widely-used tools (like Jira, Slack, and Intercom).
For an in-depth Smartlook presentation that’s tailored to your business, schedule a demo with our team.