Tracking how users interact with your mobile app helps you uncover vital insights, such as where users tap on different screens, which features they use, or what bugs they encounter.
Over the years, an entire ecosystem of tools has emerged to help with this task. The vast majority of them are quantitative analytics tools that track what your users do and report on stats and metrics, like daily active users and retention.
While useful, these traditional analytics platforms can’t show you your users’ entire experience with your app. As a result, you can’t understand why users do what they do or see the exact situations in which bugs occurred.
Imagine a fitness app product team armed with traditional mobile app analytics notices a concerning trend: a drop in engagement and an increase in user drop-offs, particularly on the screen where users log their daily nutrition. Standard metrics indicate a decline in user interactions on this screen, but the team struggles to understand why users are disengaging.
Without fully understanding specific user pain points, the team initiates a series of generic push notifications encouraging users to engage with the app. These notifications include reminders to log meals, join community discussions, and explore new app features.
Unfortunately, the change doesn’t bring the desired increase in engagement. If only the team had a way to record exact user experiences (UX)…
Many dev, product, and UX teams often aren’t aware of (or overlook) another category of tools for tracking mobile app users — session recording tools. These tools allow you to:
- Watch everything your users do in your app throughout their session (without hurting their experience or endangering personal data).
- Find and reproduce bugs fast.
- Fix edge case errors that you couldn’t have tested before a release.
In this article, we’ll show you how to do all three of these things with Smartlook, our mobile app analytics and web session recording tool.
You’ll also learn how to combine session recordings with events and funnels to find valuable user behavior insights and improve retention rates.
In this article, we’ll cover:
- What in-app tracking says about your user behavior
- 3 mobile app tracking tools recommended by product teams
- 2 unobvious use cases for session recordings in mobile app analytics
- How to make quantitative data and session recordings work together
- How to record sessions without affecting the user experience or endangering sensitive data
To start tracking the behavior of your mobile app’s users today, sign up for a free Smartlook account (no credit card required). Our tool has SDKs for 10 mobile app platforms, frameworks, and game engines — including iOS, Android, React Native, Flutter, and Unity — and can also be used for website analytics.
What in-app tracking says about your users’ behavior
Mobile app tracking is more than merely a way to detect issues with the UX. It gives you an inside view of your customers’ preferences, pains points, aspirations, and habits. Only by understanding these (which is a tricky, because they can change constantly), can you build an app that users love.
Here are the key aspects of user behavior that in-app tracking can reveal:
User retention
User retention is a critical metric in gauging the health of your app, and traditional analytics tools provide the foundation for understanding it. Metrics like daily active users and returning visitors offer a snapshot of user engagement over time.
Smartlook takes this a step further with Retention Tables. You don’t have to make complex calculations to learn how many visitors continue to return to your app after signing up, our Tables do that for you.
Retention statistics in Smartlook
Later, we’ll tell you more about tracking mobile app user engagement with Smartlook’s Retention tables. In the meantime, just remember — it’s the starting point for retention analysis.
Once you get a grasp on the state of your app’s retention, it’s time to move on to analyzing session recordings. Here, you can see the exact screens where drop-offs occur, identify patterns, and discern the reasons behind user disengagement.
Think of the fitness app scenario mentioned earlier. Instead of relying solely on quantitative data that indicates a decline in user interactions, in-app tracking through session recordings allows product teams to witness precisely when and where users disengage.
Navigation patterns
Understanding how users navigate through your app is crucial for optimizing their experience. This is where you’ll discover whether they’re following the paths you’ve built for them.
With Smartlook’s Funnels (a.k.a. user paths), you can precisely track how users move from one screen to another, including where you lose them most often. Funnel reports uncover whether the app’s logic and navigation align with user expectations and let you know if you need to make adjustments.
Later, you’ll find out how to set up funnel monitoring to analyze user behavior patterns.
Feature adoption
How do users perceive new features? Are they reaching the “aha!” moment? Have they realized the value of your app at all?
You can get answers to these questions and more by monitoring app adoption. This is where mobile in-app event tracking comes in handy.
Events are specific in-app interactions that you define and monitor. By creating events for every critical action within your app, you can keep track of how many users engage with different features.
Use this data to refine your onboarding process and provide existing users with supporting resources to help them make the most of your app. Later, we’ll delve into the specifics of setting up and utilizing event tracking with Smartlook.
– Run a website/app heatmap (e.g. Smartlook)
– Where are your customers spending the most time?
– Prioritize features and ask yourself the following questions for each:
– How many customers ‘activate’ using this feature?
– How long does it take to activate?
For the best performing features:
– How can we drive customers to these faster?
– Does this require human intervention?
For the worst performing features:
– How can we drive customers to better-converting features?
– Does this require human intervention?
Repeat for different customer segments if you have them.
There is a lot more to explore, but you’ll be surprised at your findings.
7 questions, 1 website, 1 afternoon.”

Usability issues and behavior patterns, by user cohort
Mobile app tracking should allow you to identify friction points, non-responsive UI elements, and confusing flows in your product experience (PX). Top-level quantitative data doesn’t always uncover UX issues that particular user groups experience. These may occur on specific devices, operating systems, or any custom attribute.
With Smartlook, you can run a cohort analysis to understand how UX differs across different user groups. By segmenting your audience, you can pinpoint usability issues and behavior patterns unique to each user cohort.

3 Mobile app tracking tools recommended by product teams
You need quality software to collect data regarding mobile app usage. Let’s look at some of the most recommended mobile user behavior tracking tools.
Smartlook
Smartlook is a mobile and web analytics solution for product teams that value both quantitative and qualitative insights.
Key features:
- Session recordings: Smartlook’s standout feature allows you to record and replay user sessions, providing a visual understanding of how users interact with your app in real-time
- Event tracking: Keep track of user engagement within your mobile app
- Cohort analysis: Segment users based on various criteria such as device type, operating system, and custom attributes to uncover behavior patterns unique to different user groups
- Funnels: Watch how users move through specific sequences in your app to identify drop-off points
- Retention tables: Monitor retention across different user cohorts within custom timeframes effortlessly
Smartlook is free for up to 3,000 monthly sessions. Sign up for your free, full-featured 30-day trial now.
Mixpanel
Mixpanel is a product analytics solution with mobile application tracking capabilities.
Key features:
- Cohort analysis: Use Mixpanel’s powerful segmentation feature to compare funnels and analyze user engagement across different cohorts
- Funnel analysis: Analyze conversion paths and user journeys
- Experiments: Run A/B tests to make informed app optimization decisions
Note: While Mixpanel offers robust analytics features, it doesn’t provide session recordings, limiting its ability to provide a visual playback of user interactions.
Adjust
Adjust is a revenue-oriented analytics platform. It aggregates data on mobile app revenue, return on ad spend (ROAS), and lifetime value (LTV).
Key features:
- Attribution tracking: Identify the sources and channels that drive app installation and user engagement
- Audience building: Enable automated segmentation to create highly personalized experiences for your users
- Fraud prevention: Take advanced fraud prevention measures to tackle mobile ad fraud in real time
2 Unobvious use cases for session recordings in mobile app analytics
Session recordings (sometimes called session replays) show you users’ real-time experience in your app, from the moment they open it to the moment they close it. This means you can see every interaction inside every user session.
With Smartlook, session replays are always-on by default. Once you set up Smartlook, our tool automatically starts recording everything your users do, so you don’t have to worry about manually starting and stopping recordings.
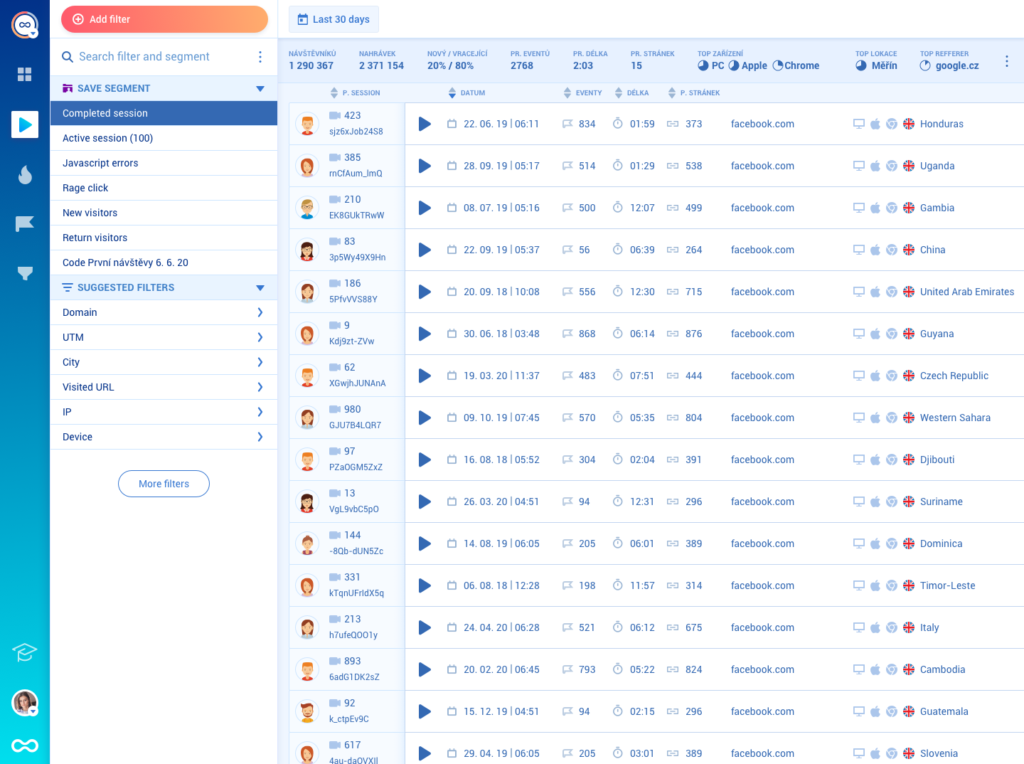
You can use over 30 filters to quickly find relevant recordings.
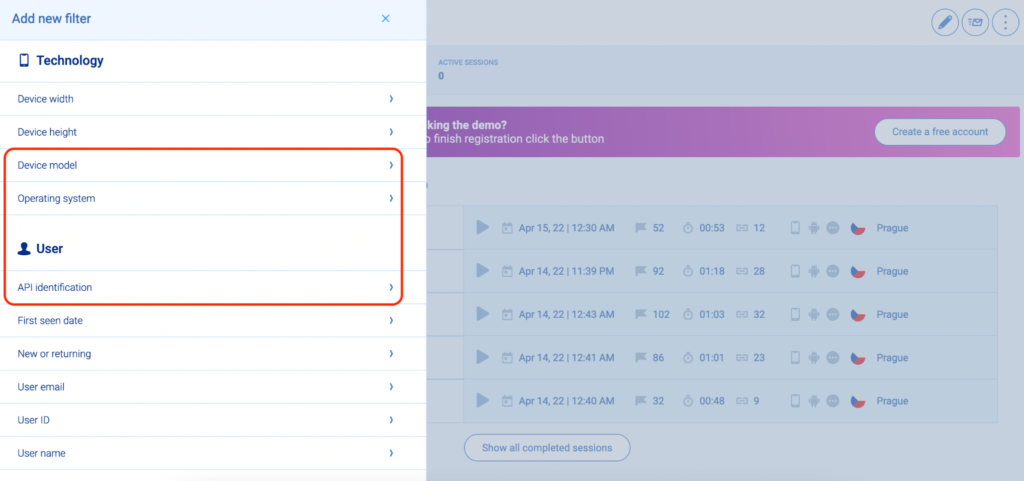
For example, Smartlook has technology filters like device and operating system, user filters like new users and returning ones, and event-based filters, which allow you to quickly find recordings where a specific user action occurred.
We’ll talk about event tracking later on, but if you’re interested, feel free to jump to that section.
Smartlook also has an Identify API, which you can use if your app collects some type of user identification details like username or email. When the API is set up, the selected identifier will appear in users’ session recordings, as you can see in the lower left-hand corner.
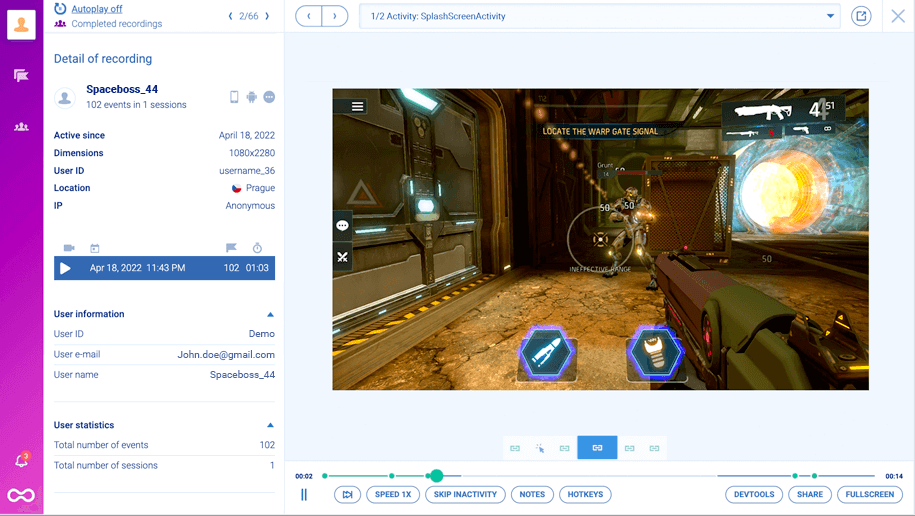
This is a great way to quickly find and debug issues that specific users have reported. For example, if an identified user reports a bug to your support team, your dev team can instantly jump into their session recordings and see exactly what happened.
Seeing how an issue occurred from a users’ point of view is extremely useful for debugging and fixing edge cases.
#1. Find and reproduce bugs fast
Debugging mobile apps and games is notoriously hard. In many cases, you can’t reproduce the circumstances in which the bug occurred. And even when you can, the reproduction process can take lots of time and effort.
Session recordings allow you to massively speed up this process. Having access to relevant session replays lets dev and QA teams see how each bug occurred from a users’ point of view, instead of guessing what went wrong.
One of our clients (Hookle) uses session recordings to save 10 hours per week on bug finding and reproduction for their social media management app.
Before finding Smartlook, Hookle’s support team often struggled as customers described their problems one way when in reality something else happened. This prompted them to look for a session replay tool that’s compatible with Flutter.
Once they set up Smartlook, session recordings made it possible to find the root cause of customers’ problems way faster than quantitative data alone ever could. In some cases, their support team contacts customers proactively, explaining and resolving issues before a support ticket is even opened.
#2. Understand edge cases that you couldn’t have tested before a release
There are so many mobile devices and technologies out there that it’s impossible to test everything you release on each device. In reality, it’s only possible to test on the top five to 10 devices and technologies that most of your customers use.
This inevitably means you have to deal with bugs that only affect a handful of users with specific devices and technologies (i.e., edge cases) as more and more people download your app. And when such edge cases come up, it’s difficult to find the root of the problem if you can’t see what’s going on.
Again, session recordings show you what happened, so you don’t waste time and effort trying to understand the situation via trial and error.
Let’s say a user on an older Android device reports the occurrence of some peculiar situation that you haven’t encountered before. According to Android’s website, 1,300 brands have produced over 24,000 different Android devices, so edge cases like these are bound to come up.
If you’ve set up the Identify API, you can find the relevant session recording instantly and see the situation. And even without identification, you can locate the session recordings from a specific date and filter them by operating system and device type.
In both cases, you can find and fix the edge case much faster than you could with quantitative data alone.
How to make quantitative data and session recordings work together
No doubt session recordings are the best tool to see your PX through the eyes of your users. But this tool is even more powerful when combined with quantitative data, like events, funnels, and retention tables.
Now that we’ve covered session recordings, let’s look at how you can use them in combination with classic analytics tools — events and funnels — to find valuable insights fast.
Use events to filter session recordings and monitor app adoption
In the context of mobile and web analytics, an event is a user action, which you can track, like an account login, button tap, or text input.
Smartlook automatically captures two types of mobile app events:
- User interaction events like finger touches, gestures, and focus on UI elements.
- Analytics events that initialize an action in your application, like button clicks and navigation between screens (for native iOS and Android apps). Recording and tracking navigation events is essential, as it helps you understand how users move between different screens to achieve their goals.
You can also build custom events via JavaScript to track important user milestones or other interactions that Smartlook doesn’t capture by default. You can learn more about Smartlook’s event tracking in our documentation.
What’s best is that tools like Smartlook enable you to organize them in folders.”

In general, there are three vital use cases for event tracking:
- Quantitative analytics. For example, event tracking can show you how many people clicked on the button for your newest feature since you added it.
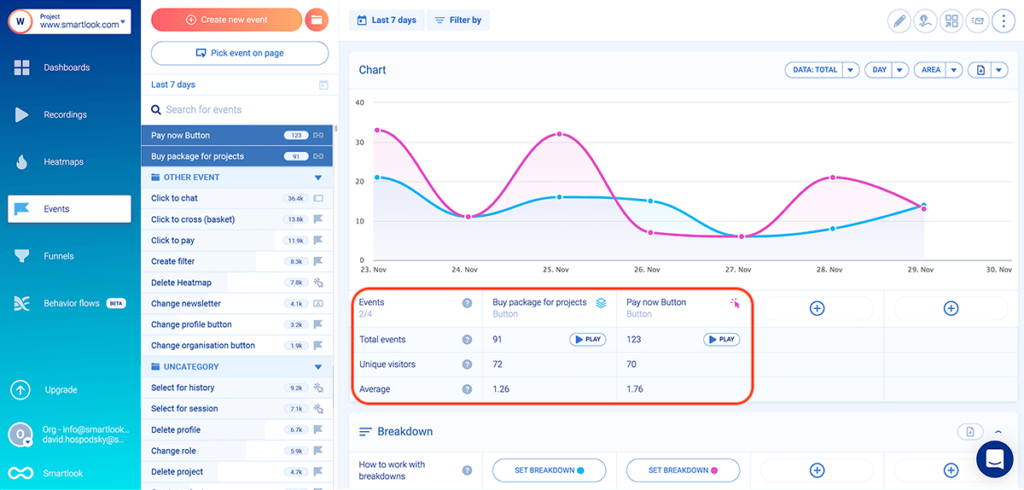
- Filtering session recordings based on events that took place in them. As you can see in the screenshot below, there’s a play button under each event. Clicking it takes you directly to all session recordings where this event occurred. This ability to combine quantitative insights (events) with qualitative insights (session replays) lets you see the entire context behind an event. Going back to our previous example, you can watch all session replays where users clicked on your new feature button and see what they did before and after that.
- Build funnels to analyze the user journey across your app and calculate conversion rates. For example, you can build a funnel to find out what percentage of the users who logged into their account (Event 1) and clicked on your new feature button (Event 2) ended up turning the feature on (Event 3). We’ll cover funnel analysis in more detail in the next section.
It’s also important to note that Smartlook automatically tracks rage clicks and JavaScript errors as events. This means you can quickly find session replays of users who were frustrated or experienced a technical problem.
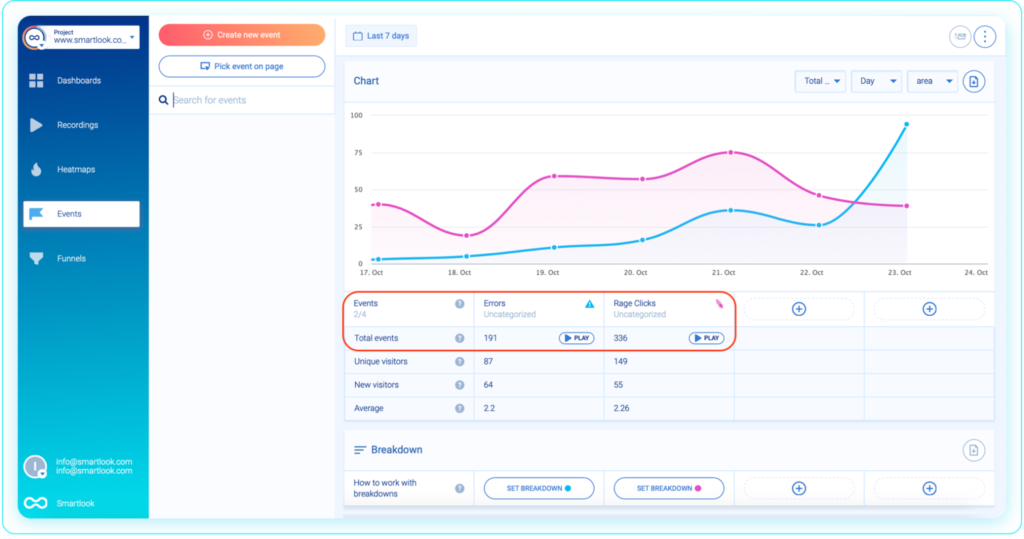
As you can see in the screenshot above, you can compare two events on the same screen. To do so, open one of the events and then click on the other event while holding down Cmd/Ctrl.
You can see how event tracking works in Smartlook’s free public demo (no registration or credit card required).
Unlock navigation patterns with funnels
Funnels let you analyze the user journey across different steps (i.e., events) and calculate conversion rates.
In Smartlook, you can create a new funnel by putting two or more events in the order you believe your users follow, like in the GIF below.
Funnels are a versatile tool, which you can use to analyze the different paths that users take to complete a goal.
For example, we often see funnels being used to analyze and improve an app’s onboarding flow. You can do this by mapping each step of your onboarding flow to an event. Then, put the events in the order you believe your users follow to create a funnel.
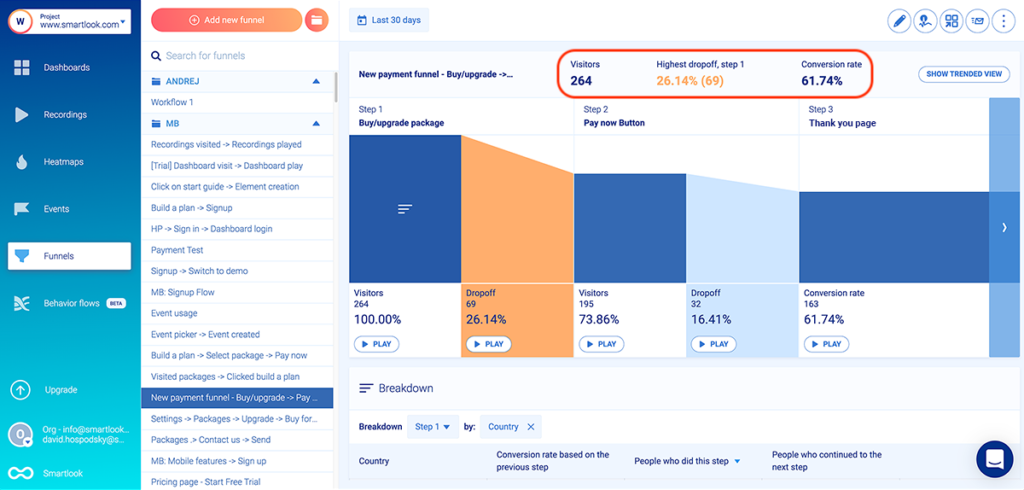
Once the funnel is created, you can see how many users went through each stage of the funnel, where most of them drop off, the funnel’s overall conversion rate, and the drop-off rate between steps.
Vertigo Games — a game development company and Smartlook customer — uses this process to analyze and improve their users’ experience. One of their most important funnels consists of 60 steps and tracks how many users complete the onboarding process since that’s crucial for retaining users.
Additionally, Smartlook provides the option to break down the funnel (or specific steps in it) by properties. When you hover over a step in the funnel, you’ll see a “Break down funnel” text appear, like in the screenshot below.
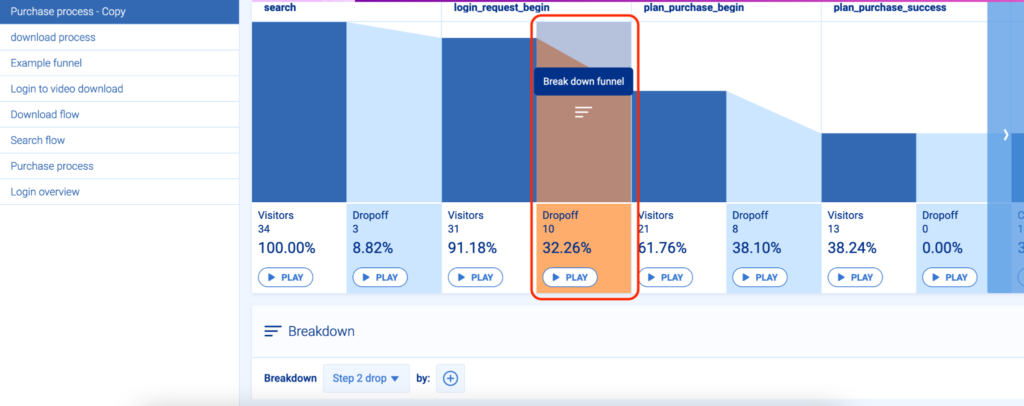
Once you click it, you’ll be able to select from different parameters such as country, device, operating system, and more. When you select a property (in the example below — operating system), a breakdown table will appear below the funnel.
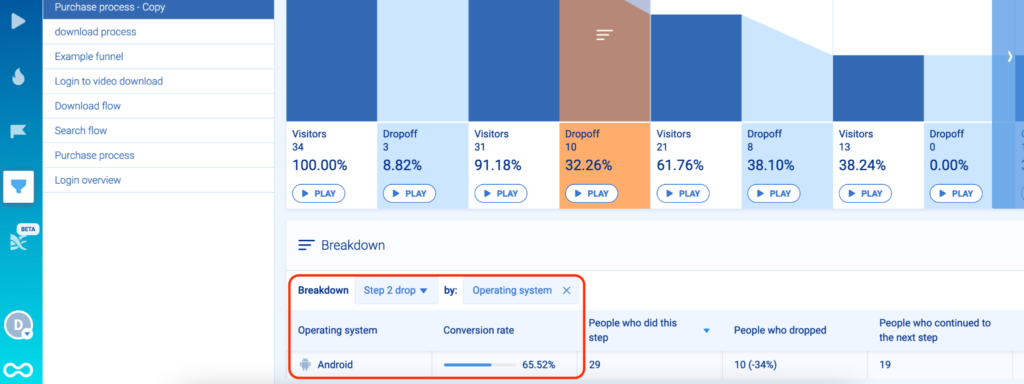
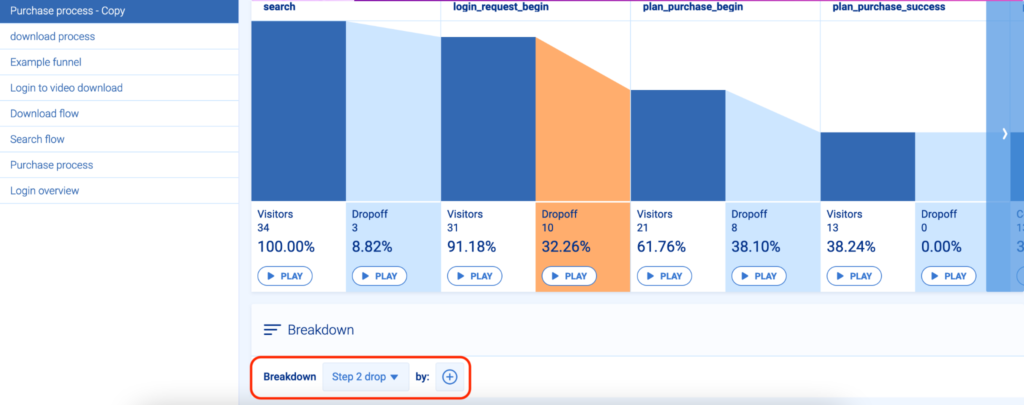
You can also break down the entire funnel by selecting “All steps” in the “Breakdown” section below the funnel and clicking the “+” button to select a property.
For instance, a breakdown might show you that far fewer Android users complete your onboarding tutorial compared to iOS users. This might indicate that your app is too resource-intensive for older devices or that there’s some compatibility issue. Regardless of the specifics, you know there’s some issue and you can begin investigating it by jumping into relevant session recordings.
Lastly, you (or your dev team) can further customize this analysis to your needs by creating custom properties, which let you log specific data for every event.
You can see how funnel analysis works and build a funnel yourself with Smartlook’s free public demo (no registration or credit card required).
Find out why users drop off with funnel analysis
While funnels can show you where most users drop off, they can’t tell you why they do so.
Fortunately, Smartlook lets you combine funnel analysis with session recordings to analyze the behavior of users who dropped off.
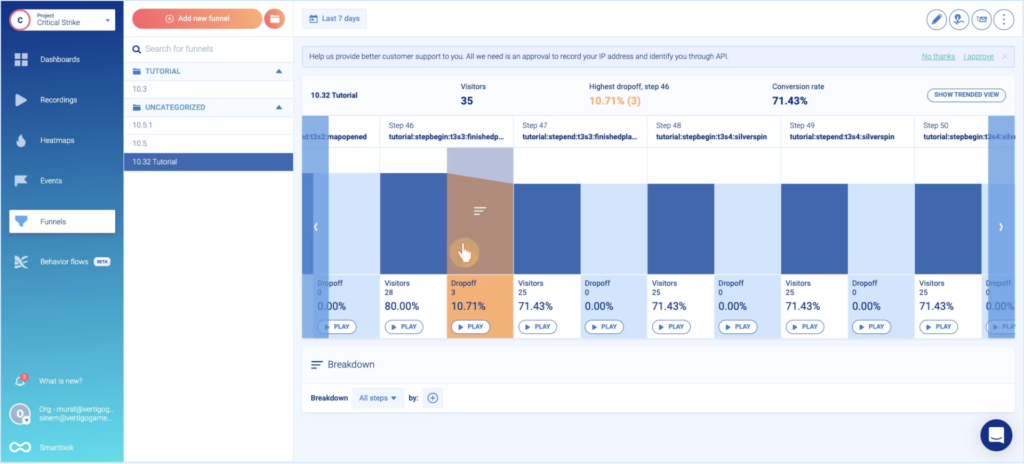
Let’s go back to our game tutorial example. Below, you can see a screenshot of a funnel that tracks tutorial completions, with an overall conversion rate of 71.43%.
As you can see, there’s a “Play” button under each drop-off step of the funnel.
When you click the button, you go directly to the session recordings of all users who dropped off at that stage. This saves you time and effort, as you can watch only users who didn’t complete that step in the funnel, instead of going through all other sessions.
In the case of this tutorial, you can easily see where the largest drop-off is (Step 46, as shown in the screenshot above) and jump straight into the relevant session recordings. Again, this is how you uncover the “why” behind your users’ behavior, which helps you improve their experience.
Another common use case for this functionality is tracking users who began filling out a purchase form but didn’t complete it. You can track each form field input as an event and then create a funnel to monitor the entire process. Once you see where the largest drop-off is, you can watch the session replays and see what went wrong.
Monitor app retention rates with Retention Tables
Besides specific user actions, Smartlook also lets you track important metrics to monitor your app’s user engagement and monetization strategy.
We’ve discussed metrics like in-app purchases and average revenue per user (ARPU) in our mobile game analytics article, so we won’t go over all of them here.
One essential metric we will cover is retention.
There are different methods and formulas for tracking retention. Lots of mobile apps (and especially mobile games) need to keep daily usage high, so it’s essential to track the number of users who return to your app or a specific feature each day after first trying it.
The better your retention, the more chances you have to improve users’ lifetime value (LTV) and other important KPIs. Retaining existing customers is also much cheaper than bringing in new ones, so high retention typically means a healthy business model.
To calculate retention, you first need a user action (i.e., event) to follow over a period of time.
For example, you may want to follow the event that tracks when people click on the latest feature added in an update. The goal here would be to analyze how many of the users that try the feature on a specific date continue to do so each following day. The group of people you track (in this case users trying out the new feature for the first time) is called a cohort.
For example, say 550 users opened your new feature for the first time on a specific day — Day 0. If 130 of them opened the feature again on the next day — Day 1 — you’d have a Day 1 retention rate of 23.63% (130/550*100).
Once you have that baseline, you can judge how changes to your app design or the feature itself affect Day 1 retention for the next user cohorts.
Smartlook has a special feature called Retention Tables, which lets you track user cohorts over time and calculates retention for you.
Let’s look at a quick example of creating and monitoring a retention table in Smartlook.
First, you need to select the event for which you’d like to analyze retention. For this example, we’re going with the account login event.
Once you have your event, you can select:
- The data range.
- Whether Smartlook should display the data by day, week, or month.
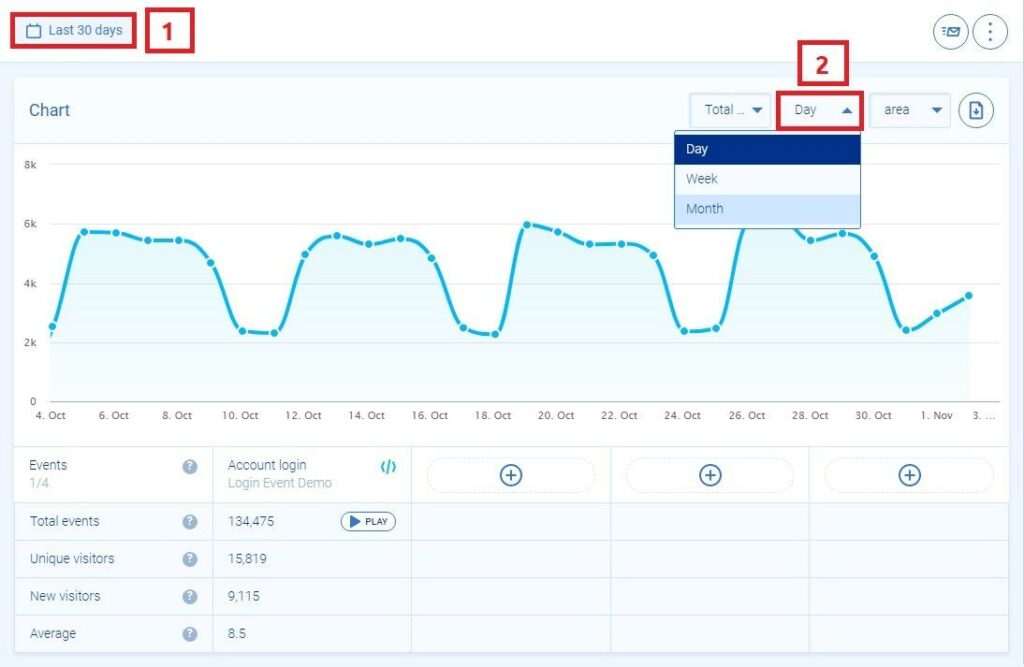
After that, scroll down to the “Retention table” section and click on “Generate”. A retention table similar to the one below will then appear.
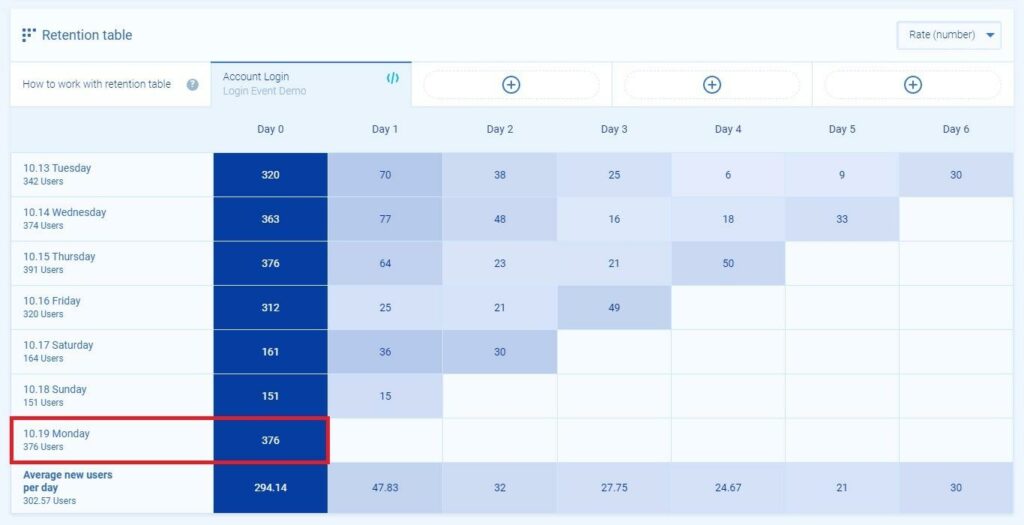
As you can see, on Monday, Day 0, 376 users completed the “Account Login” action This group of users, which we’ll track over the next few days, is our cohort.
Here’s the retention data for the next five days:
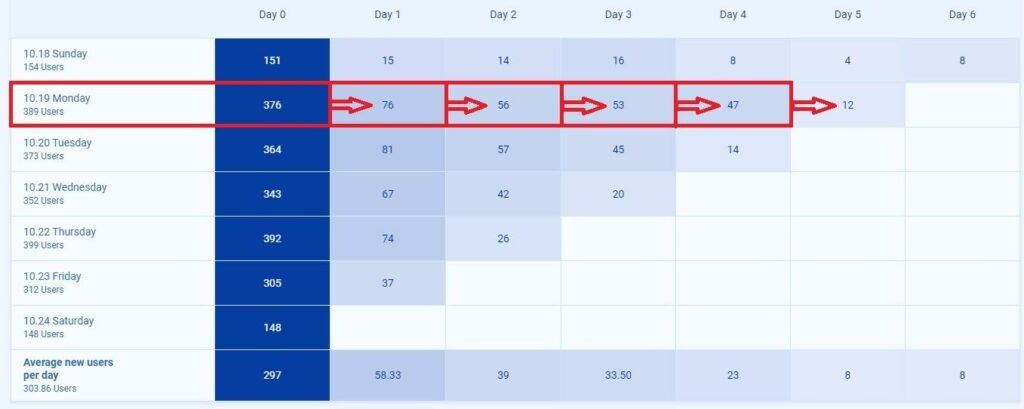
On Day 1, 76 of the 376 users (20%) performed the action again. That number gets progressively lower, with a big drop between Day 4 and Day 5.
Lastly, it’s worth noting that just tracking retention (or any other metric) won’t tell you how to improve it. However, it’s an essential first step toward diagnosing potential issues.
Imagine you release a new feature, set up event tracking for it, and notice that it’s got a low retention rate. Thanks to the ability to filter session recordings based on an event, you can watch sessions where users tried the feature. That’s not a guarantee for finding the problem, but it gives you a much better chance than simply looking at quantitative data.
How to record users’ safely, without affecting their experience
As we said, session recording tools are sometimes overlooked by product, dev, and UX teams.
For some teams, this may stem from concern about impacting the user experience. Some session replay tools can be very taxing on users’ devices, leading to fast battery drainage, high CPU usage, additional network traffic, and even app crashes. If users notice that an app is draining their battery quickly, overwhelming their CPU, or increasing their mobile data usage, they may decide to uninstall it.
There’s also the issue of sensitive data — tools should not under any circumstances record things like passwords and credit card information.
At Smartlook, we take these concerns seriously, which is why we created our wireframe rendering modes. These rendering modes (along with a few other features) allow you to automatically capture users’ sessions, without affecting their experience or compromising their personal data.
Here’s how.
Record sessions with minimal impact on battery consumption, CPU usage, and network traffic
Smartlook has three capabilities for minimizing the load on users’ devices, while still recording their sessions:
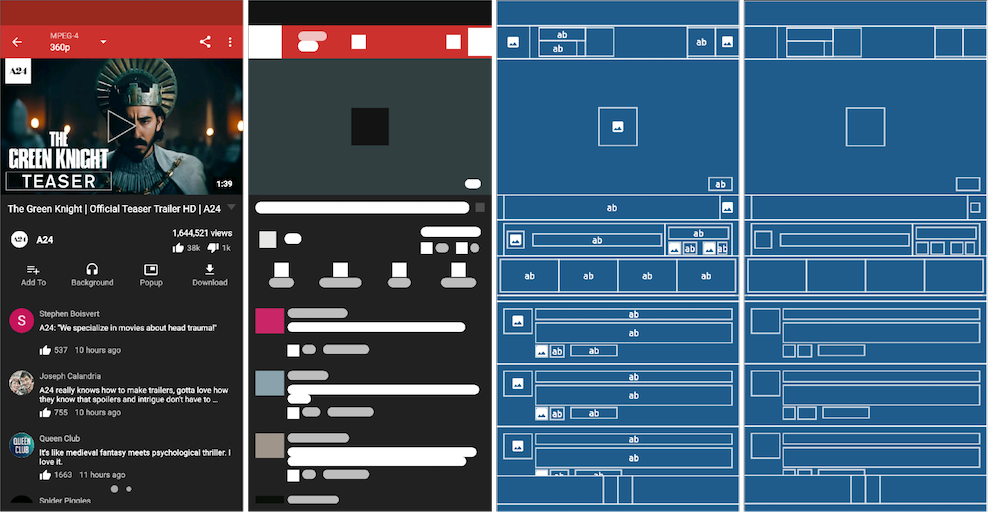
- Wireframe rendering modes. When one of these rendering modes is turned on, Smartlook draws a representation of the content on a screen, as you can see in the screenshot below. You still see all user interactions, only the UI elements are replaced by an abstract representation. This is much less taxing on users’ devices as opposed to capturing the screen as they see it. It’s also a great way to protect personal data automatically, as you’ll see in the next section.
- Adjustable recording quality and frame rate. If you need to see the UI as your users see it (which might be necessary in some cases), you can choose between three recording quality settings — high, medium, and low. Smartlook also lets you adjust the session recordings’ frame rate. The higher the quality and frame rate, the more taxing session recordings are on the device and vice versa.
- No snapshots when the UI is idle. Smartlook records user sessions by taking snapshots of the UI between regular intervals. However, when the user isn’t doing anything, Smartlook doesn’t take snapshots. This optimization, called adaptive frame rate, reduces Smartlook’s overall footprint on the device and the app’s performance.
Record sessions and events while ensuring the safety of users’ personal data
Protecting users’ personal data is another concern when using session recording tools. That’s why Smartlook offers different ways to ensure the safety of your users’ data while recording their sessions.
First, we have two important default settings:
- Smartlook doesn’t record passwords or credit card information. Elements containing such data are obfuscated automatically and replaced with a neutral color box during the rendering process.
- Our tool also doesn’t record click events that occur over the system keyboard when it’s visible. The location of the clicks can be used to reverse-engineer a users’ password, so we never record these click events.
Besides these defaults, we offer two other ways to further protect user privacy at the screen and element level:
- The first one is using one of our wireframe rendering modes. As we mentioned, wireframe rendering modes let you control what Smartlook captures on a screen level. Since they don’t show you the full UI as users see it, inputs like emails, passwords, credit card numbers, and other sensitive data are never captured.
- Secondly, you can prevent Smartlook from recording specific UI elements or classes manually. This process is called blacklisting and can be done with a few lines of code, as described in our documentation on handling sensitive data. For instance, you can blacklist the image element that contains users’ profile photos.
Track user behavior on your mobile app with Smartlook
You can set up mobile app tracking for free with a Smartlook account (no credit card required). As soon as you set up Smartlook, it will automatically start recording all user sessions.
For a detailed presentation of how Smartlook can benefit your business, schedule a demo with our team.