

Mobile app analytics tools can help you find insights about your users’ behavior such as where they click on a screen, which features they like, why they churn, and other key insights.
However, in our experience, marketing, product, and UX teams often overlook 2 potential issues when choosing an analytics tool for their mobile app:
- Recording users is taxing on their devices and can hurt the user experience. Most app analytics tools that offer session recordings can only record the screen as the users see it by taking snapshots of the UI at regular intervals. Recording sessions this way and uploading them to the tools’ servers can be really demanding for older devices, leading to fast battery drainage, high CPU usage, additional network traffic, and potential app crashes.
- Session recording tools can capture sensitive information like emails, phone numbers, passwords, and credit card details. This can lead to compliance issues, sensitive data leaks, and other legal and reputational problems.
In this article, you’ll learn how our tool, Smartlook, lets you analyze user behavior on your mobile app or game without affecting the users’ experience or compromising their data security.
We’ll also compare 10 other mobile app analytics tools you may want to consider. Here are all the tools we’ll cover in this article:
- Smartlook
- Adobe Analytics
- Apple’s App Analytics
- AppsFlyer
- Countly
- Data.ai (Formerly App Annie)
- Firebase by Google Analytics
- Flurry
- Localytics
- Mixpanel
- UXCam
You can start using Smartlook on your mobile app or game today by signing up for a free account (no credit card required). Once our SDK is set up, Smartlook automatically starts capturing session recordings and user events, so you can analyze your app’s users and find ways to improve their experience.
1. Smartlook
- Supported mobile platforms and frameworks: Android, iOS, React Native, Flutter, Unity, Unreal Engine, Cocos, Cordova, Ionic, and Xamarin.
- Key features: Session recordings, wireframe mode (for better performance and data security), sensitive data protection, event tracking, funnel analysis, and heatmaps.
- Pricing: Free plan for capturing up to 3,000 user sessions/month. Paid plans start at $55/month, with a 30-day free trial.
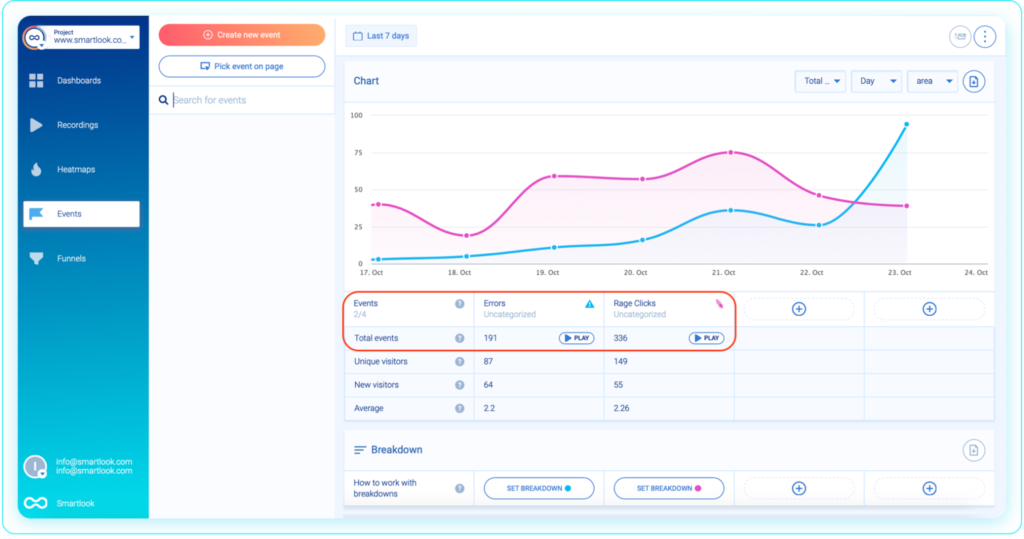
Smartlook helps over 2800 paying organizations analyze their users’ behavior with features like:
- Session recordings, which will show you the entire user journey with every interaction in it.
- Event tracking, to dig into important user interactions, like button clicks, or to find JavaScript errors and rage clicks, instantly.
- Funnel analysis, to visualize the user journey through your app or game and calculate conversion rates between key interactions.
- Heatmaps, which show you which parts of your app or game garner the most attention, and more.
Put simply, Smartlook helps you find valuable insights about your users, such as where they click, which features they like, why they churn, what bugs and glitches they experience, and more.
Our tool has SDKs for 10 native mobile app and game platforms and frameworks — including Android, iOS, React Native, Unity, and Unreal Engine — and can also be used for website analytics.
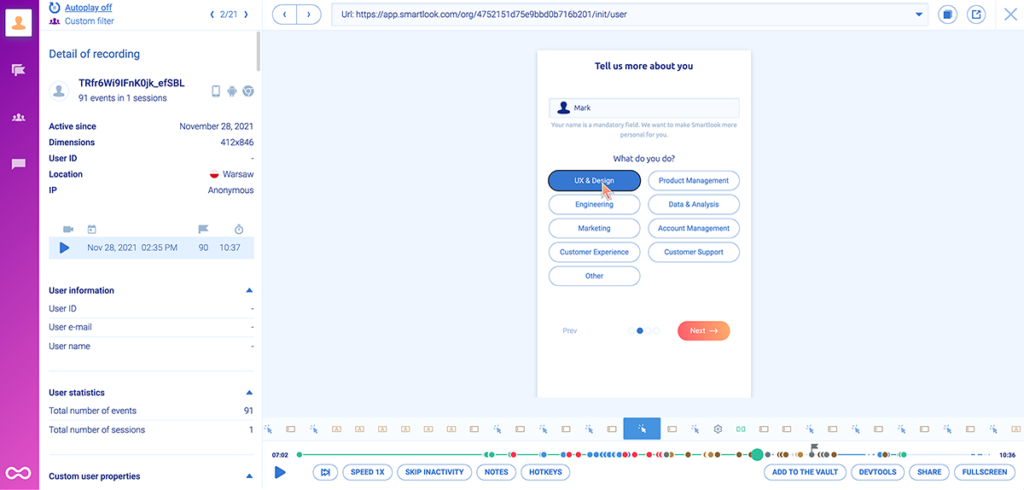
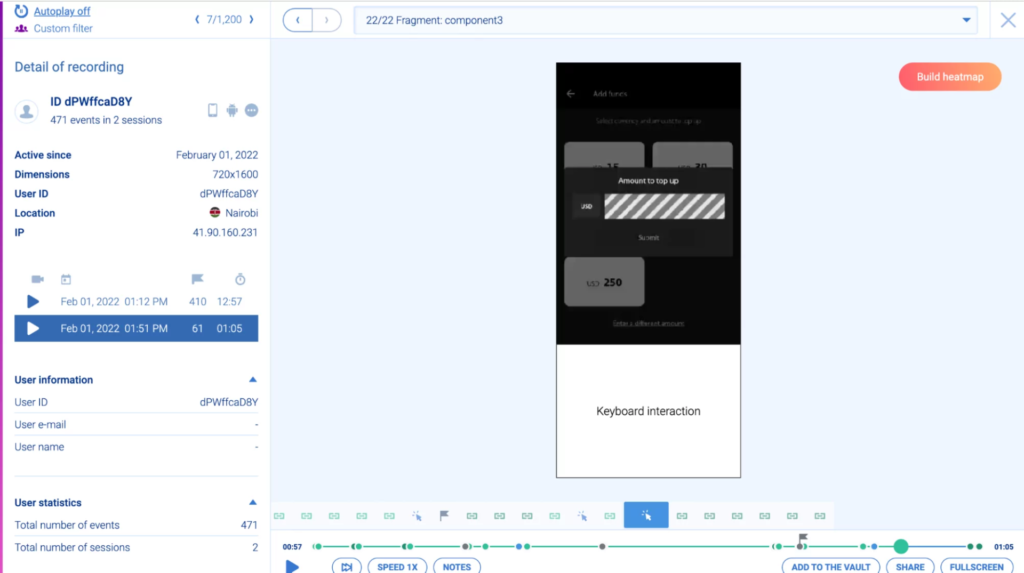
After Smartlook is set up on your mobile app or game, our tool automatically starts recording all user sessions. Once the session recordings are captured, they’re sent to our servers, but only when the users’ device is connected to Wi-Fi, so there’s no mobile data usage.
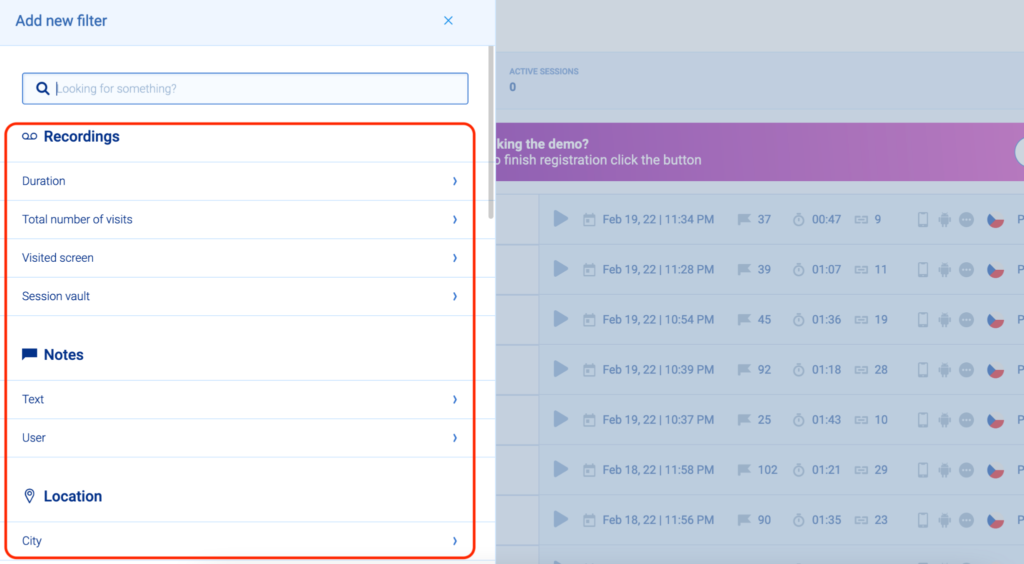
After that, the session recordings start appearing in your Smartlook dashboard. There, you can use 30+ filters like session duration, country, device, new or returning visitor, and more, to quickly find what you’re looking for.
Session replays allow you to see the entire user journey in your app, so you can find where users struggled and why they churn.
For example, watching user sessions can help you find bugs and errors, which you previously didn’t know about or didn’t know how to identify. And, if you connect your app to Smartlook’s API, users’ details (like username or email) can appear directly in your recordings. That way, if you’re watching a session replay, and you see a user encountering a bug, you can reach out to them to resolve the issue, or send the issue directly to your development team.
Now, let’s see how you can record sessions without overwhelming your users’ devices or putting their personal data at risk.
Record user sessions with minimal effect on battery consumption, CPU usage, and network traffic
As we’ve said earlier, session recordings are a great tool for getting valuable insights, but they can be taxing on users’ devices. And if users notice that your app is draining their battery quickly, overwhelming their CPU, or increasing their mobile data usage, they may decide to uninstall it.
That’s why Smartlook has 3 capabilities for minimizing the load on users’ devices, while still recording their sessions:
- Adjustable recording quality and frame rate. Our tool lets you choose between 3 recording quality settings — high, medium, and low. You can also choose how often Smartlook takes snapshots of the UI by adjusting the frame rate. The higher the quality and frame rate, the more taxing session recordings are on the device. You can experiment with these settings until you find a balance between video quality and your users’ experience.
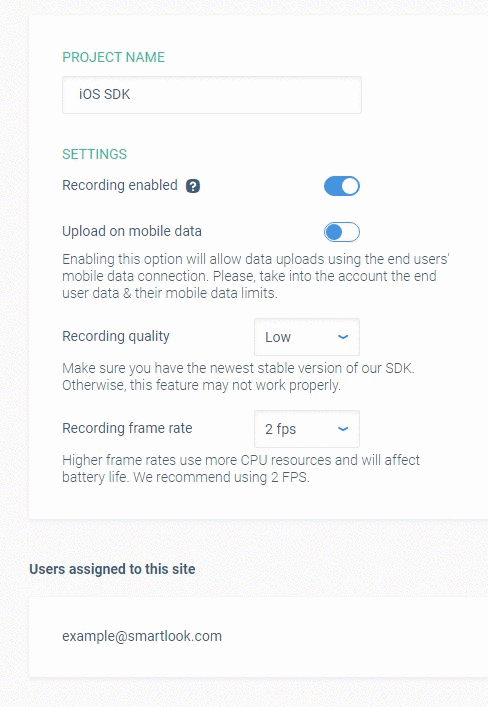
- No snapshots when the user interface is idle. Smartlook only takes snapshots when the user interacts with your app, i.e., when the UI is not idle. This optimization, called adaptive frame rate, ensures no unnecessary snapshots are taken, which reduces Smartlook’s overall footprint on the device and the app’s performance.
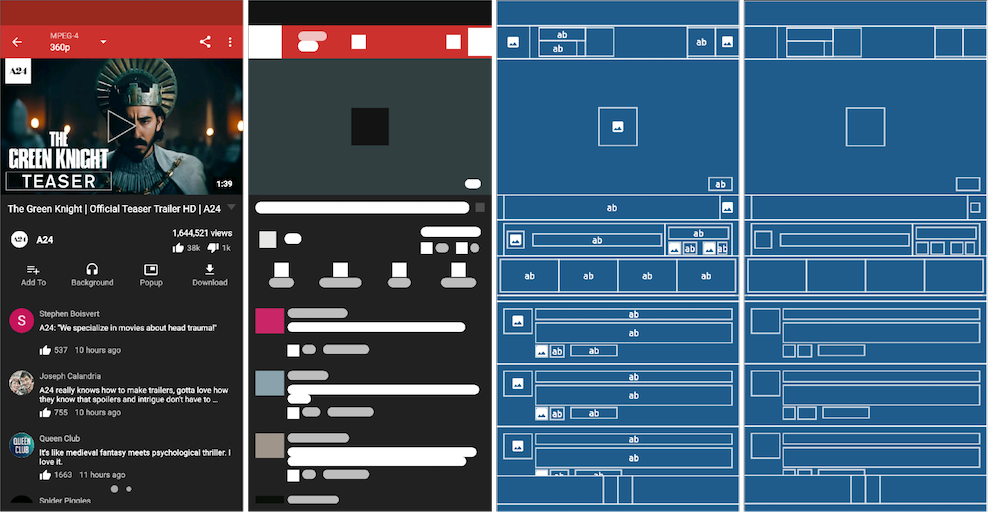
- Wireframe rendering modes. When one of our wireframe modes is on, Smartlook doesn’t capture the screen as the user sees it. Instead, it draws an abstract representation of the content, as shown in the screenshot below. This is much less taxing on users’ devices and is also great for protecting sensitive information, as you’ll see in a short while.
These 3 capabilities ensure that you’ll get all the benefits of session recordings while keeping the impact on users’ devices to a minimum.
Record sessions and events while protecting your users’ personal information
Besides the high resource usage, data security is the next big issue with session recordings. Since Smartlook is GDPR-compliant by default, we offer different ways to ensure you aren’t compromising your users’ personal data.
First, 2 crucial default settings:
- Smartlook doesn’t record passwords or credit card information. The elements which contain this data are obfuscated automatically and replaced with a neutral color box during the rendering process.
- Our tool also doesn’t record click events that occur over the system keyboard when it’s visible, because the location of the clicks can be used to reverse-engineer a users’ password.
Besides these automatic protection measures, Smartlook offers a few more tools to help you protect user privacy at the screen and element level.
The first one is using one of our wireframe modes, as we mentioned in the previous section. These rendering modes let you control what Smartlook captures on a screen level. Since they only show you colored shapes (not the full UI as the user sees it), inputs like emails, passwords, credit card numbers, and other sensitive data are never captured.
Additionally, you can also blacklist (i.e., prevent Smartlook from recording) individual UI elements or classes. For example, you may want to avoid recording an image view that shows users’ profile photos. You can do so with a few lines of code, as described in our documentation on handling sensitive data.
Now that we’ve covered performance and security, let’s see how you can analyze your users’ behavior and find ways to improve their experience.
Use events to build funnels and analyze the users’ journey through your app
Besides session recordings, Smartlook also automatically captures 2 types of events that help you understand how users interact with your app:
- User interaction events like finger touches, gestures, and focus on UI elements.
- Analytics events that initialize an action in your application, like button clicks and navigation between screens (for native iOS and Android apps).
These events can be used to filter recordings, so you can watch sessionreplays of users who clicked on a particular button or reached a specific screen, for example.
And since Smartlook also automatically tracks rage clicks and JavaScript errors, you can quickly find session replays of users who were frustrated or experienced a technical glitch.
You can also build custom events via JavaScript to track important user milestones or other interactions that Smartlook doesn’t capture by default.
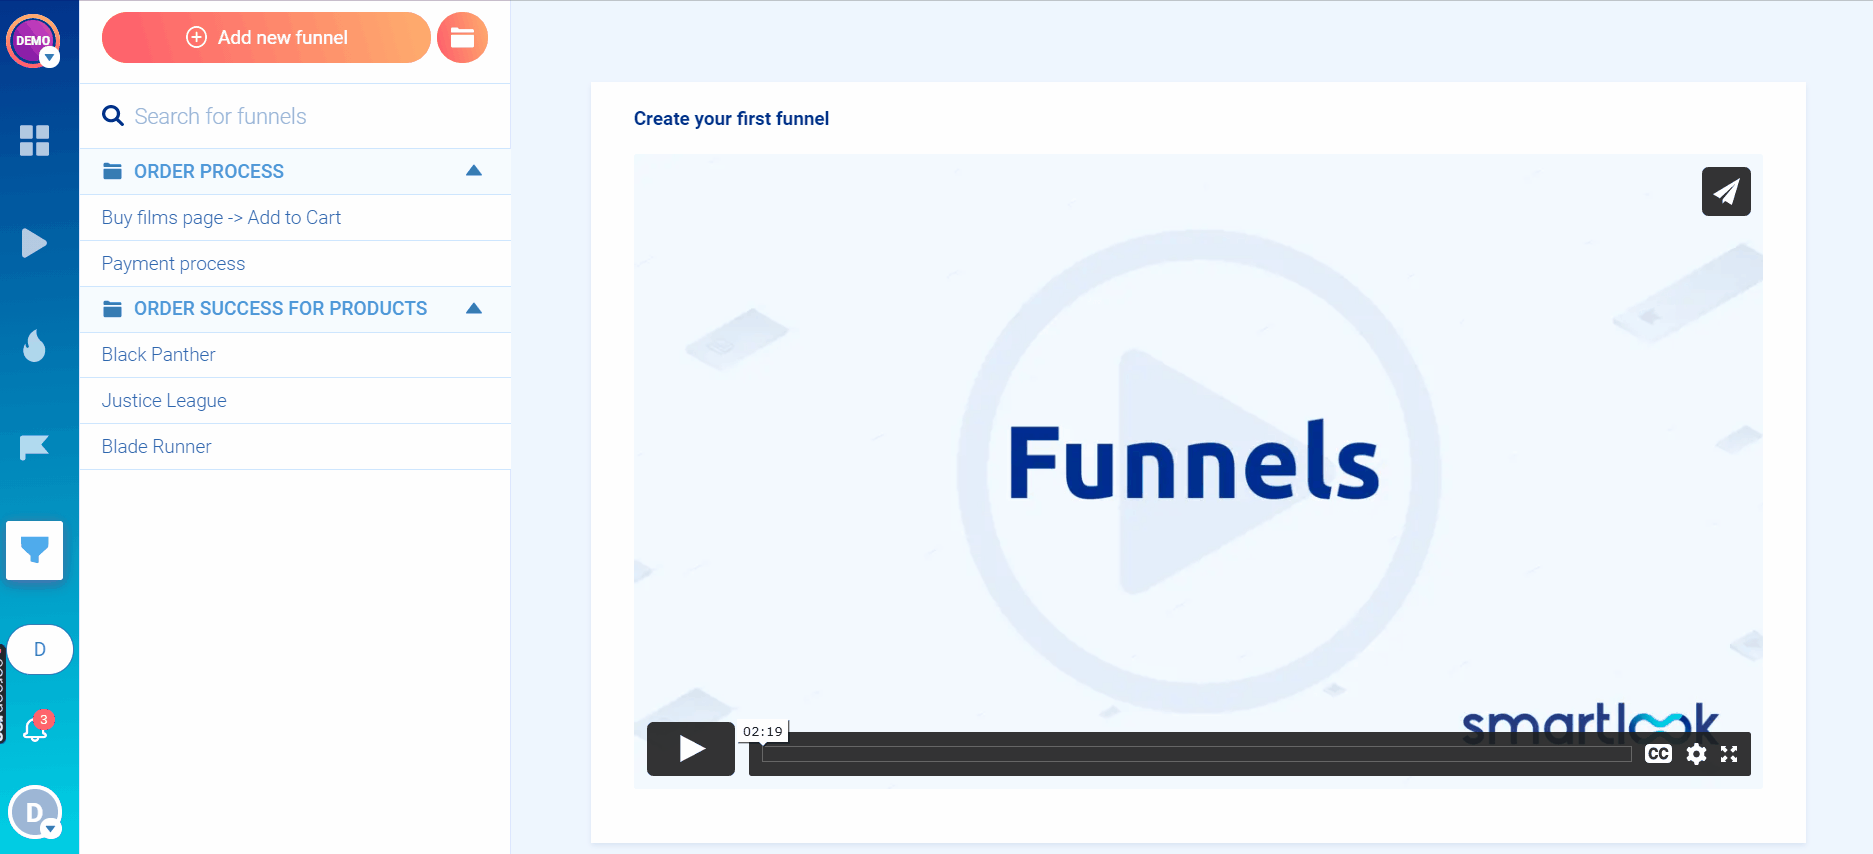
Once you have your events, you can create funnels to analyze the user journey through your app. In Smartlook, funnels are created by putting 2 or more events in the order you believe your users follow, like in the GIF below.
Building funnels and tracking the drop-offs between important sequences of steps (like the ones in the next section) can help you find user experience issues and improve your conversion rates.
You can see how easy it is to define events and build funnels with Smartlook’s live public demo (no registration or credit card required).
Combine funnel analysis with session recordings to find actionable insights fast
We’ve already mentioned that you can filter session recordings based on events (i.e., user interactions). However, that may still leave you with too many sessions to watch before finding what you’re looking for.
That’s why Smartlook lets you combine funnel analysis with session recordings to find actionable insights instantly.
Here’s how:
In Smartlook, there’s a “Play” button under each step of the funnel (blue blocks), as well as under each drop-off step (orange blocks). Usually, a drop-off step is positioned between 2 funnel steps, as you can see in the screenshot below.
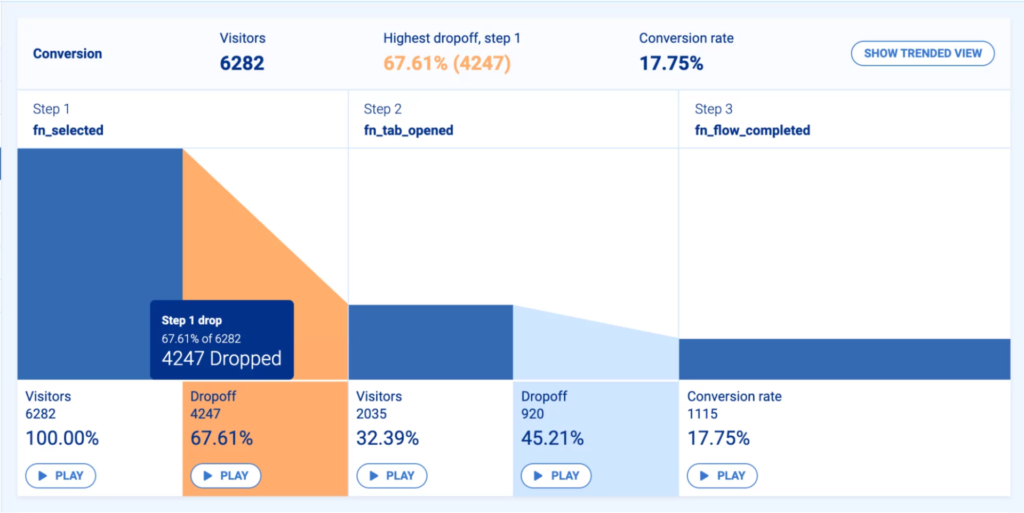
When you click the “Play” button under each drop-off step, you go directly to the session recordings of all users who dropped off at that stage. This will save you both time and effort, as you don’t have to sift through all other recordings.
This capability can be extremely useful in many scenarios.
For example, a lot of mobile apps and games have tutorials for new users, but many users don’t complete them. This is a big challenge for product and UX teams, since it makes it difficult to convert free users to paid users.
By mapping the entire tutorial to events and creating a funnel, you can see where most users dropped off and watch their recordings to see why.
One of our clients (AstroPay) used this same process to reduce users’ anxiety and boost conversions.
First, they defined events and built a funnel to map their users’ journey to purchasing a cryptocurrency. Once they saw where the largest drop-off was, they watched a few screen recordings and quickly realized what prevented users from making a purchase.
On the one hand, many users didn’t have their local currency in their e-wallet, which made the purchasing process much more difficult. On the other hand, a lot of users who just bought a cryptocurrency spent 3–5 minutes searching for it in their e-wallets. There was no indication that their transactions were still pending, which increased users’ anxiety and made them reluctant to buy again in the future.
AstroPay implemented 2 optimizations, based on their findings:
- They added users’ local currency as an option to finalize transactions.
- They added a “Purchase pending” banner for users who just bought a cryptocurrency.
These fixes increased the funnels’ conversion rate by 56%.
If you want to find similar opportunities for improving the user experience on your mobile app, game, or website, sign up for a free Smartlook account (no credit card required).
2. Adobe Analytics
- Supported mobile platforms and frameworks: Android and iOS.
- Key features: Campaign acquisition tracking, real-time analytics, and visualizations, audience analysis, and segmentation.
- Pricing: Price is available upon request to their team.
Adobe Analytics brings together a suite of tools that can help you capture and analyze real-time data from the entire user journey. They have a huge focus on attribution and predictive analytics, which analyzes users’ data and makes predictions about their future user behavior.
One downside to Adobe Analytics is pricing transparency, as they don’t have publicly available pricing plans.
3. Apple’s App Analytics
- Supported mobile platforms and frameworks: iOS.
- Key features: Basicapp analytics, sales, and financial reports.
- Pricing: App Analytics is free for all members of the Apple Developer Program.
Apple’s App Analytics is a built-in and free mobile analytics tool for app developers and startups in Apple’s ecosystem. The tool has some good features for tracking app store performance, app downloads, marketing campaigns, and basic app engagement and usage data (e.g., for active users and paid subscribers).
However, it lacks more advanced features for analyzing what users do in your app, like events and funnels.
4. AppsFlyer
- Supported mobile platforms and frameworks: Android,iOS, React Native, Unity, Xamarin, Cordova, and Flutter.
- Key features: Campaign performance analysis, cross-platform attribution, deep linking, and event tracking.
- Pricing: Free plan for tracking your apps’ first 12,000 conversions (events you track, like app installs or re-engagements). Paid plans start at 6¢/conversion.
AppsFlyer is a mobile app analytics and attribution platform. The platform’s main focus is on evaluating app marketing campaigns and their key metrics, measuring attribution, and preventing mobile app fraud.
While they have a free plan, their paid options are limited (only two plans) with pricing based on conversions, instead of recorded user sessions or the number of dashboards and reports, like most analytics tools.
5. Countly
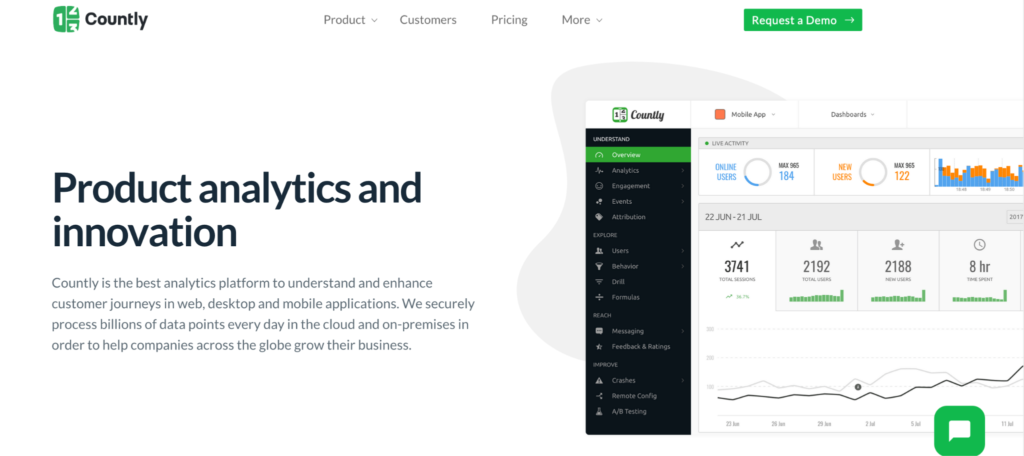
- Supported mobile platforms and frameworks: iOS, Android, React Native, Unity, Cordova, and Flutter.
- Key features: Real-time metric tracking, event tracking, funnels, and revenue analytics.
- Pricing: Free version is self-hosted. Pricing for their paid plan is available upon request.
Countly is a product analytics platform available for mobile, web, and desktop apps. It has in-app analytics, push notifications, and crash analytics features. The platform is open-source, so you can use it for free, provided you host and manage it on your own server. They can also host the platform for you on-premise or in the cloud, but the pricing for that plan is not publicly available.
6. Data.ai (Formerly App Annie)
- Supported mobile platforms and frameworks: Android and iOS.
- Key features: Ad campaign tracking, performance benchmarks, and funnels.
- Pricing: No free trial. Price is available upon request.
App Annie, a mobile data and app analytics platform, recently rebranded itself as Data.ai to reflect the company’s broader focus on analyzing user and market data via AI. Their ConnectPlus product can help you unify your app data from multiple sources, like app stores and ad networks, and analyze it in one place.
While their pricing isn’t transparent, their CEO’s announcement made it clear they’re now focused on the enterprise market.
7. Firebase by Google Analytics
- Supported mobile platforms and frameworks: iOS, Android, and Unity.
- Key features: App analytics, stability monitoring and crash reporting (Crashlytics), A/B testing, deep linking, events, and funnels.
- Pricing: Free plan for getting started with basic features. Pricing is flexible, and you can make a rough estimate with Firebase’s calculator.
Firebase is a platform by Google for creating and monitoring your mobile app, tracking in-app purchases, engaging visitors via push notifications and deep linking, and more. The platform’s scope is much broader user analysis, so it may be overwhelming if you’re just looking for an app analytics tool.
Google’s main analytics product — Google Analytics — can also be used for mobile app analytics. However, Google recommends using the FirebaseSDK to track both Android and iOS apps in Google Analytics. Both tools have become more tightly integrated over the years, which is why we’re listing them together here.
8. Flurry
- Supported mobile platforms and frameworks: Android, iOS, React Native, and Unity.
- Key features: Events, funnels, user journey analysis, user acquisition, and attribution analysis.
- Pricing: Flurry Analytics is free.
Flurry is a mobile app analytics solution that was acquired by Yahoo in 2014. The solution can help you track installs and sessions, as well as analyze app metrics.
Flurry also has features for gathering and analyzing data points like users’ age, gender, and demographic interests, and exporting their data to build look-alike audiences for ad networks.
9. Localytics
- Supported mobile platforms and frameworks: Android and iOS.
- Key features: Event tracking, funnel analysis, A/B testing, and retention tracking.
- Pricing: No free plan. Price is available upon request.
Localytics is a web and mobile app analytics software, which is part of Upland Software. Localytics’ focus is on helping users create personalized app experiences and understand how their marketing campaigns and messaging affect conversions and other KPIs. Instead of a free trial or demo, the company does a 30-minute monthly webinar, showcasing their software’s functionality.
10. Mixpanel
- Supported mobile platforms and frameworks: Android, iOS, React Native, Flutter, and Unity.
- Key features: Conversion rate analysis, user engagement analysis, user segmentation, and cohort analysis.
- Pricing: Free plan for up to 100,000 tracked users/month. Paid plans start at $25/month.
Mixpanel is a product analytics software tool, with features for analyzing conversions, app usage, and retention rate. The software lets you build reports, as well as custom dashboards to analyze product adoption, conversion rates across different segments, and other important metrics.
One downside to Mixpanel is that it doesn’t have session recordings, so you can’t watch users’ entire journeys.
11. UXCam
- Supported mobile platforms and frameworks: Android, iOS, React Native, Xamarin, Flutter, Cordova, Unity, Flutter, and NativeScript.
- Key features: Session replay, heatmaps, crash recording, and funnel analytics
- Pricing: Free plan for up to 5,000 sessions/month. Pricing for paid plans is available upon request.
UXCam is an analytics solution for mobile applications only, with a primary focus on session recordings. The solution also offers heatmaps, events, funnels, and other useful features for analyzing user behavior.
While their recorder captures all user sessions by default, they don’t have different rendering modes to minimize the impact on users’ devices.
Use Smartlook to analyze your users’ behavior without affecting their experience or compromising their personal data
It just takes three steps to start using Smartlook on your mobile app, mobile game, or website:
- Sign up for a free account (no credit card required).
- Go to our documentation page and choose your platform or framework.
- Integrate our SDK and initialize Smartlook by following the steps in our documentation.
Once the setup is done, our tool automatically starts recording user sessions, which will appear in your Smartlook dashboard. Lastly, our SDK also works even if your app is in a simulator, so you can verify the installation and test our tool.
If you want to find similar opportunities for improving the user experience on your mobile app, game, or website, sign up for a free Smartlook account (no credit card required).