


In a perfect world, you would have a complete understanding of how customers perceive your product. Not to mention, you wouldn’t need to wade through loads of data to find grains of user truth. But unfortunately, we don’t live in a perfect world.
There’s no single metric that measures product adoption. Instead, you have to dive into the user journey, track usage statistics, and talk with existing customers before you can understand whether they’re using your product as expected.
With so many people outside your product team who participate in driving product adoption, how do you acknowledge their contribution to the process?
Measuring product adoption is a complex process that involves different tools and best practices. To gain actionable insight into product adoption and not get lost in the analytics, we’ve put together the following guide with help from leading product experts.
This guide will teach you everything you need to know about how to measure product adoption successfully:
- What is product adoption?
- Product adoption vs feature adoption
- Who is involved in driving product adoption?
- How to measure product adoption
- 11 Product adoption indicators
What is product adoption?
Product adoption, or user adoption, involves helping users understand the value of a product, including how to use product features to accomplish goals.
Adoption is often confused with activation, a.k.a. conversion. But it takes quite some time before a paid user realizes a product’s full potential. In reality, it requires a proper onboarding program, product documentation, and in-app training to drive users to that “aha!” moment.
“Did you just say, ‘aha!’ moment?”
In product management, the “aha!” moment refers to a user realizing the true value of a product. This usually occurs during the onboarding stage, when users are busy testing out the full functionality of a product (not during the sales demo).
Reaching the “aha!” moment is an important step toward achieving product adoption. But it’s not the only milestone along the way.
Product adoption stages
General consensus says there are six stages of product adoption:
- Awareness — users discover a product
- Interest — they explore the product’s functionality
- Evaluation — the users consider the pros and cons of the product
- Trial — they sign up for a free trial
- Activation — users convert into paying customers
- Adoption — after the onboarding process, users learn how to use product features to achieve their goals
As you’ve already learned, activation doesn’t guarantee product adoption. Even after becoming paying customers, users may fail to grasp the true value of your product and churn after the first few days or weeks. Adoption aims to build long-term customer relationships and bring users to the next level in the customer journey — advocacy. But that’s a topic for another article.
Who is involved in driving product adoption?
Product adoption is the result of cross-functional collaboration between various teams making contributions at different stages of the process.
Up until the trial stage, marketing and sales teams interact with potential customers. Once a user signs up for a free trial, customer success and product teams get involved in the product adoption process.
Moreover, our customer success team sets up our solution to our client’s needs during their onboarding and provides training to the end users so they can extract more value quicker.”

Here’s how cross-functional collaboration on product adoption in a SaaS company could look:
- The marketing team attracts leads and creates resources that help them understand their pain points. The goal is that they will come to see the product as a way of solving their problems
- The sales team takes over warm leads and runs product demos illustrating the value of the product (a prelude to the “aha!” moment)
- The product team — perhaps in collaboration with content marketers — creates end-user documentation and in-app training paths to guide free and paid users through the product
- The customer support team answers customer questions, helps them resolve problems, and collaborates with product and marketing teams to create better on-demand content based on the most common customer queries
- The customer success team checks in with paid users to help them get even more out of the product
The examples above are just a tiny snippet of what’s involved in product adoption. We haven’t even mentioned the analytics that every department turns to regularly.
User behavior analysis is what brings cross-functional teams together, allowing them to create a better product adoption strategy. Customer success may rely on product analytics to uncover user training opportunities, and product managers and marketers may dive into the user journey to create better help content.
To keep everyone on the same page, a SaaS company must implement a centralized product monitoring platform. Smartlook is a product analytics and visual insights platform your team can use to measure and optimize product adoption. It allows you to visualize the user journey and view session recordings, heatmaps, and user actions in a shared interface, eliminating discrepancies and serving as a single source of truth across the entire company.
Book a free demo or try Smartlook today with our full-featured, 30-day trial (no credit card required).
There’s a lot of work preceding successful product adoption. That’s why it’s important to establish the metrics that will help each team assess their contribution to the process.
Product adoption vs. feature adoption
The terms “product adoption” and “feature adoption” are often used interchangeably. But is there a difference between them?
Yes. There is a difference between product adoption and feature adoption.
Feature adoption aims to maximize the use of specific features within a product. You may decide to focus on driving feature adoption if you’ve recently released a new feature or noticed an aspect of your product is underused.
Product adoption is a broader concept. The process of measuring product adoption includes but is not limited to tracking feature adoption. There are a bunch of other metrics you’ll need to consider, such as stickiness, net promoter score (NPS), etc., but we’ll talk more about them later. Keep in mind, you can even increase product adoption by improving feature adoption.
How to measure product adoption: tools and best practices
Choosing a product analytics tool isn’t enough to successfully measure SaaS product adoption — you need a strategy.
Set goals & choose your product adoption metrics
First, you should make clear what you consider a success.
Revisit your product goals. You must already know what you want to achieve with your product, right? Now, you just need to take those objectives and connect them to your product adoption goals.
What does it mean?
There’s no universal benchmark for product adoption — you’ll need to create your own. But how do you know what you should be aiming for? To answer this question, you’ll need to turn to your ultimate product goals.
For example, you clearly have Customer Lifetime Value (CLV) goals you need to hit to achieve your profit goals. Based on this metric alone, you can estimate all other product adoption metrics you need to aim for, such as activation rate, user retention rate, etc. This is where you’ll also come to understand which product adoption KPIs matter most.
Use the right technology
There are two types of tools we strongly encourage you to use: digital adoption platforms and user behavior analytics tools.
A digital adoption platform consists of software you connect to your product to layer training flows, help content, and other elements that drive user adoption. Such tools provide you with insight into how users progress through onboarding flows and interact with help content — these can become additional user adoption metrics for you to follow.
We don’t doubt you already have a product analytics tool in your tech stack, but in case you need help choosing the right one, consider Smartlook. It provides you with product adoption insight across desktop and mobile devices, helping you uncover the most critical metrics for your cross-functional team.
Build a framework for measuring product adoption
You can’t just randomly monitor various metrics — you need a system.
Measuring product adoption is a continuous process that requires consistency. Once you have a list of metrics to track, create a system for documenting the results of your analysis and establish a schedule. This way, you’ll be able to see how product adoption improves (or doesn’t), so you can adjust your strategy accordingly.
11 Product adoption indicators to track along the user journey
Your choice of product adoption metrics should be determined by your goals. That said, here are 11 product adoption indicators you may want to consider:
1. Active users
Let’s begin with the most basic metric you can find in almost any product analytics tool.
The number of active users indicates how many customers interact with your product regularly. Contrary to the number of total paying users, this one has more to do with your product adoption strategy than your sales team’s performance.
DAUs provide insight into the number of unique users engaging with our software on a daily basis. As opposed to the total number of sign-ups, which potentially doesn’t tell the full story as users may churn at some point, DAU enables a better understanding of the number of people actually using our solution.”

With Smartlook’s Dashboard, you can set up a tile that displays:
- Daily active users (DAU)
- Weekly active users (WAU)
- Monthly active users (MAU)

It’s important to track all three categories so you can understand how many users depend on your product daily and how many use it occasionally.
Who should track it: product teams, sales
2. Activation rate
Activation rate is the metric used to calculate the percentage of users that performed the “key action” or reached the “aha!” moment out of the total number of new users within a timeframe.
The action is unique for every product, and it’s up to you to decide what it should be. For example, in an email marketing platform, an activation point might be creating the first contact list.
Once you define an action, use your product analytics platform to set up tracking to learn how many people reach the point. With Smartlook, you can track custom events, using the data to calculate your product activation rate.

Who should track it: product teams, sales
3. Time to value
This metric is related to the activation rate. It shows how long it takes a user to perform a designated action within the product. The less time it takes to reach the activation point, the more effective your product adoption strategy.
You’ll need an audience sample to measure how long it takes different users to complete activation and then calculate the average.
Who should track it: product teams, sales & marketing
4. User paths
User behavior directly correlates with product adoption. That’s why it’s important to not only measure quantitative metrics but also dive into qualitative insights such as user paths, session recordings, and in-app events.
User paths, or funnels, are visualizations of the user journey within your product. This is a great way to see exactly how users move from one step to the next within your product, including how many complete the workflows you’ve designed for them. Smartlook includes a comprehensive Funnel Analysis tool.
Who should track it: product teams, sales & marketing
5. Session recordings
Watching session recordings (session replays) is particularly useful for testing out new features on real user samples and measuring new feature adoption.
Of course, you don’t need to waste time watching each and every session replay. But if you spot friction in user funnels, you can watch real user behavior and uncover product adoption issues. For instance, you may discover that people who take too much time to complete activation skip the user onboarding flow.
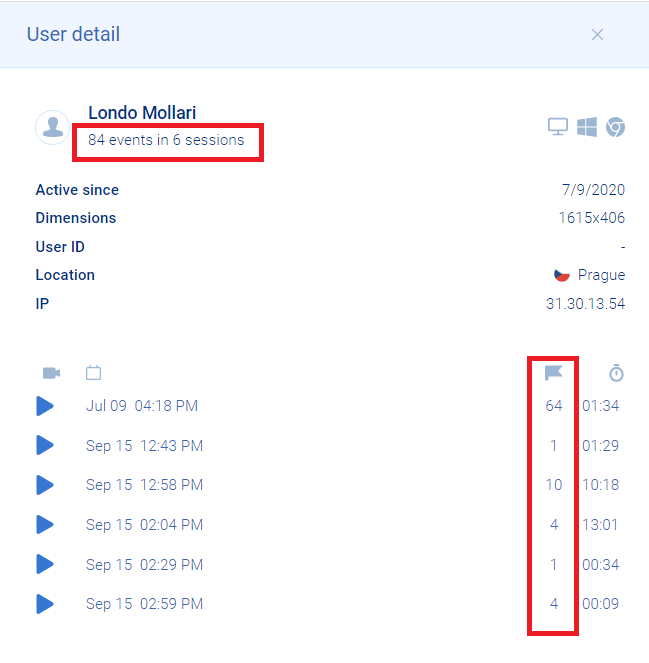
Here’s how it works with Smartlook.

Who should track it: product teams
6. In-app events
We’ve already touched on custom events, but there’s more to it. You should monitor custom in-app events to collect statistics regarding how many people follow the paths you designed for them.
You can measure feature adoption by setting up custom events for features and tracking the number of people who complete them.
Moreover, by tracking events and funnels, you can spot anomalies in user behavior that result in low product adoption.
Smartlook allows you to filter event data the way you want. You can see the total number of events per user, so it’s easy to spot the most and least active users.
Who should track it: product teams
7. Product stickiness rate
Product stickiness rate is one of the key product metrics for uncovering whether your product creates value.
It represents the percentage of users that return to your product regularly. To calculate it, simply divide the number of daily active users (DAUs) by the number of monthly active users (MAUs).
Who should track it: product teams
8. Upsell conversion rate
This is one of the most significant indicators of product adoption success. If you have a high upsell conversion rate, it means that there are a lot of people who not only decided to stick to your product but also enjoyed it enough that they’re willing to upgrade to a more expensive plan.
This is one of the examples where the results of collaboration between a product team and a customer success team can be traced and measured.
To calculate your upsell conversion rate, you need to divide the number of customers you offered an upsell opportunity by the number of people who took it.
Who should track it: customer success, marketing
9. Product engagement score (PES)
Product engagement score, or PES, is another metric that shows how many users consistently interact with your product. PES combines the three key metrics — product adoption, stickiness, and growth.
It’s a sum of the product activation rate, stickiness rate, and growth rate divided by 3, where the growth rate represents the ratio of new and renewed total users to the number of churned users.
Who should track it: product teams, customer support & success
10. Net Promoter Score (NPS)
Net promoter score (NPS) is a metric that measures customer loyalty, including how likely they are to recommend your product to others.
One way to calculate NPS is by talking to your customers via an NPS survey. Simple questionnaires may include only one question: on a scale of 1-10, how likely are you to recommend this product to a friend? Generally, NPS scores between 8 and 10 indicate high product adoption.
Smartlook integrates with Survicate giving you the opportunity to listen to your customers’ voices and keep all customer data forms in one place. This integration also enables you to run NPS surveys right through Smartlook’s interface.

Who should track it: product teams, customer support & success
11. User retention rate
Lastly, the retention rate represents the percentage of people using your product month over month (or any period of time). It’s a critical product adoption metric for SaaS companies as it directly affects your CLV.
The retention rate is the inverse of the user churn rate — that’s why we aren’t dedicating a separate section to the latter.

Who should track it: product teams, customer support & success
Measuring product adoption is a complex process
User behavior metrics in isolation say nothing about product adoption. You need to create a consistent process for measuring and analyzing product adoption metrics to eventually build a product your customers not only love but actually know how to use.
Smartlook is a powerful tool for measuring product adoption for product managers and other teams that contribute to the process. With it, your marketing, sales, customer support, and product teams can:
- Visualize the user journey
- Spot popular and underused features and workflows
- Make informed decisions regarding optimizing your product adoption strategy
Book a free demo or try Smartlook today with our full-featured, 30-day trial: no credit card required.


