


![The ultimate guide to user activation in SaaS, including how to improve it [+6 Tactics]](https://hpassets.smartlook.com/wp-content/uploads/sites/2/2023/04/13121556/user_activation_blog.jpg)

You may think that building a great product is enough to ensure user activation. But the truth is that even the best products, from a technical standpoint, can only succeed with a solid user activation strategy.
A misleading UX, friction points, and poor onboarding all contribute to low user activation rates.
On the bright side, product managers can locate and address all of the friction points that impair user activation in a timely manner.
Throughout this guide, we’ll delve into 6 tactics that have been proven to boost user activation rates and drive revenue for SaaS products. Moreover, you’ll learn how to measure user activation and act on the data collected.
- What is user activation in SaaS?
- What are the consequences of a low activation rate?
- How do you measure user activation?
- A 6-step approach to boost user activation in SaaS
- Best tools for user activation
Smartlook records user actions and is equipped with session replays to help you unlock opportunities for improvement. Request a free demo or try Smartlook with a full-featured, 30-day trial: no credit card required.
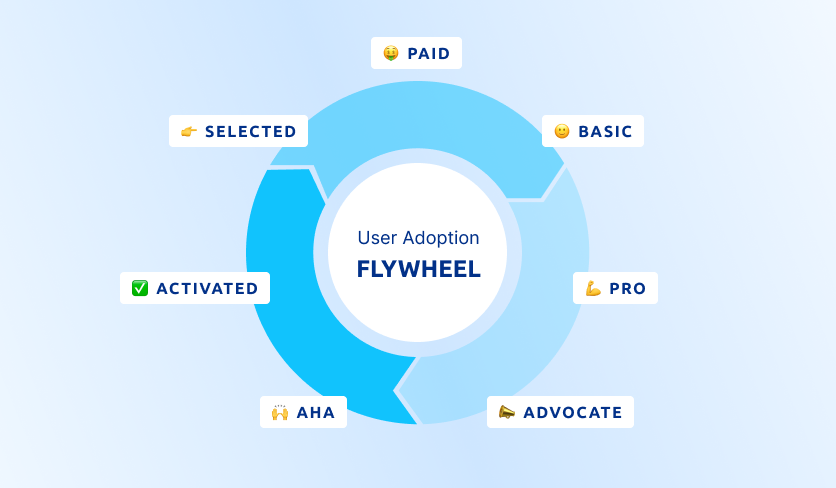
What is user activation in SaaS?
User activation in SaaS refers to the pivotal moment when a new user successfully experiences the core value of your product for the first time. In other words, an activated user is someone who has realized the benefits of your software and, as a result, is more likely to continue using it and become a paying customer.
For example, regarding a project management SaaS, an activated user could refer to someone who has created their first project, added team members, or assigned tasks, thereby experiencing the software’s collaborative capabilities.
What are the consequences of low activation?
Reading about the positive side of measuring user activation is always inspiring. But let’s flip the coin and explore 5 major repercussions of low user activation. This better reflects the reality of product development.
- High churn rate. Users who fail to activate are more likely to abandon your product
- Low customer satisfaction rate. Unsatisfied users who struggle to realize your product’s value will have a lower satisfaction rate, negatively impacting brand reputation and referrals
- Negative marketing ROI. When customers stop using your product before reaching activation milestones, the resources spent acquiring them go to waste
- Decreased customer lifetime value (CLV). Users who don’t fully engage with your product are less likely to convert into paying customers or upgrade to higher-tier plans. This directly affects your revenue stream
- Increased customer acquisition costs (CAC). You’ll need to invest more to acquire new customers to compensate for the ones you’ve lost. As a result, you’ll drive up your customer acquisition costs and potentially strain your budget
A while back, the number of people submitting at least one query plan (within a week) was as low as 50%. We tried several iterations relating to the improvement of our docs, the error messages we gave, and our welcome emails… but still only managed to get user activation up to about 55%.
Eventually, after watching new users try and fail multiple times, we bit the bullet and started improving the product to accept badly formatted inputs (the primary cause of issues). This almost instantly took us to around 75%, a number we’ve not managed to improve much since!”

In other words, low activation rates can spell disaster for your SaaS business, resulting in a domino effect of negative consequences. At Smartlook, it’s our mission to equip you with the best tools on the market for maximising user activation.
But first, you’ll need to understand your current user activation rate.
What is the user activation rate?
The user activation rate is a metric that quantifies the percentage of activated users after signing up. It’s a crucial indicator of how well your product delivers value to new users and helps identify areas for improvement in the onboarding process and overall user experience.
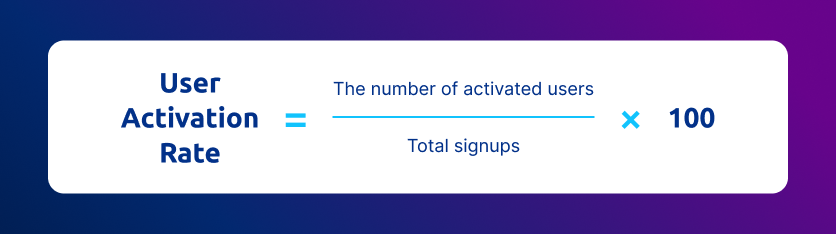
What is the formula for calculating the user activation rate?
User Activation Rate = (The number of activated users / Total signups) x 100
For example, if 1,000 users sign up for your SaaS product in a given month, and 300 of them become activated users, your user activation rate is:
(300 Activated Users / 1,000 Total Users) x 100 = 30%
This means that 30% of your users became activated (e.g., experienced the first real value).
What is a good user activation rate?
For SaaS companies, the average activation rate is 36% (the median is 30%).
How do you measure user activation?
Knowing the formula is not enough. If you find a ratio of new sign-ups, including those who reached the activation point, then you know you’re looking at high-level data. Dig deep to understand how different customer segments adopt your product to make meaningful adjustments.
Step 1. Define activation points
Activation points are specific milestones or actions that indicate a user is deriving value from your product during the onboarding process. These events vary depending on the nature of your SaaS product and its core features. Examples include:
- Collaboration tools: Creating a workspace or team, inviting team members, and engaging in conversation
- CRM software: Importing customer data, creating a sales pipeline, and logging a deal or opportunity
- Social media management: Connecting social media accounts and scheduling the first post
Step 2. Track in-app events and segment customers
Once you have laid out your activation points, the next step is to set up a product analytical platform to monitor these events. This is important for several reasons:
- By monitoring in-app events, you can get a better understanding of user behavior and identify friction points in the UX and the onboarding process, including what’s causing users to drop-off
- Segmenting customers enables you to analyze activation rates across different user groups, helping you tailor your strategies to meet the unique needs of each segment
Use Smartlook to assign custom in-app events and analyze the activation rate across segments. Here’s how to do it.
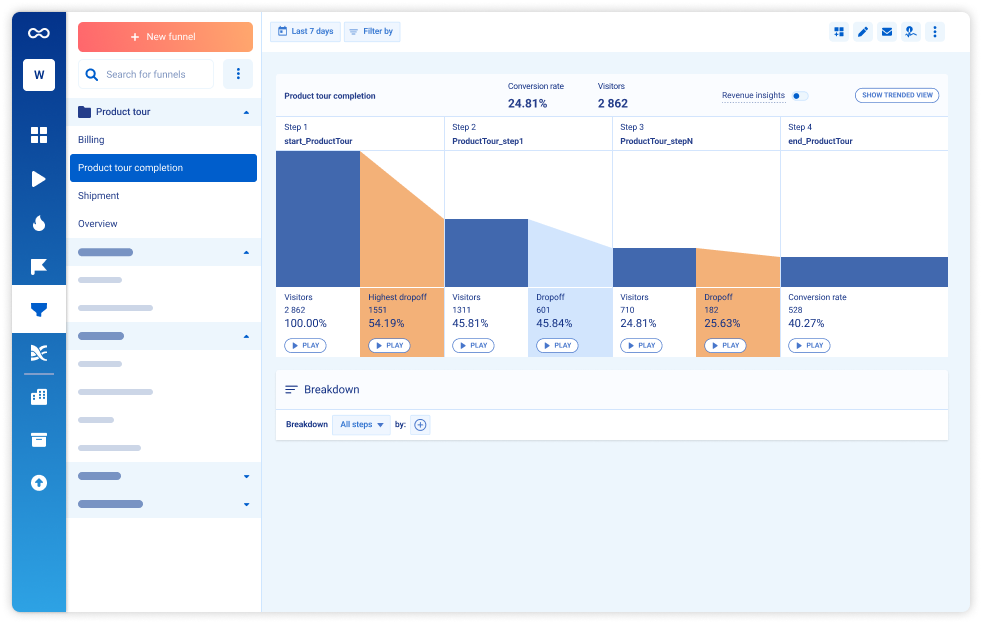
Define key moments in your user onboarding flow and set them as activation events. A set of key moments in the onboarding process could consist of users starting and finishing a product tour (including if they skipped any steps). Smartlook users can create funnels based on specific events around product tours such as start_ProductTour, ProductTour_step1, ProductTour_stepN, and end_ProductTour to quickly monitor drop-off rates between steps (i.e., those that haven’t completed the product tour).
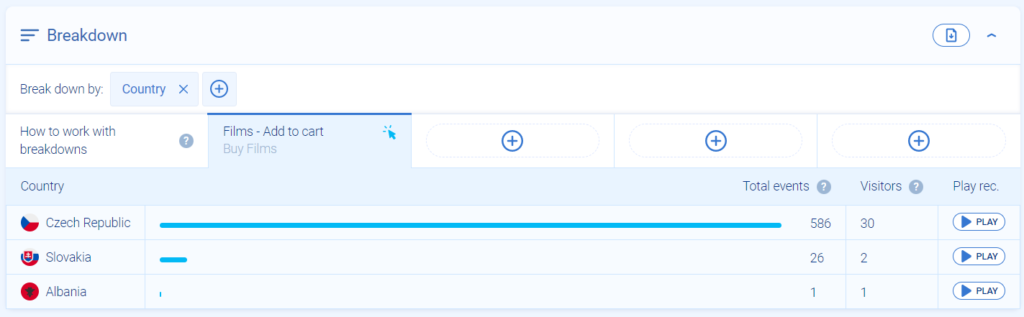
Once you’ve collected enough data, you can delve into user segmentation to find anomalies in particular segments. Smartlook offers event breakdowns by technologies, location, and event properties.
Other important user activation metrics to track
In this section, we’ll explore 6 more user activation metrics so you can get a better picture of user behavior to optimize your app. To make things easy, we’ve grouped the following metrics into short-term and long-term objectives.
Short-term user activation objectives
Short-term user activation objectives focus on the initial stages of user engagement within a product. These metrics help evaluate the effectiveness of the onboarding process, the speed at which users realize the value of your product, and the level of early user activity.
By optimizing short-term objectives, you can quickly address friction points, enhance the user experience, and increase user activation rates.
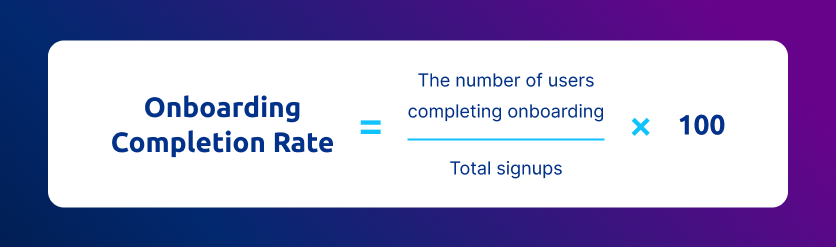
Onboarding completion rate
This metric measures the percentage of users who complete the entire onboarding process. It helps you identify areas for improvement in the onboarding flow, contributing to higher user activation.
For instance, Vertigo Games keeps a close eye on the onboarding process to quickly locate bugs and other issues that prevent new users from completing the onboarding process. The company relies on Smartlook’s screen recordings and funnel analytics to spot drop-offs, including the reasons behind them. These features allow Vertigo Games to save 10-12 hours of development time.
Onboarding Completion Rate = (The number of users completing onboarding / Total signups) x 100
Time-to-value (TTV)
TTV refers to how much time it takes for a new user to realize your product’s core value. By reducing TTV, you can accelerate user activation and improve user satisfaction.
TTV = Time between user signup and reaching activation milestone.
1. How quickly a user gets to value
2. If and where there are roadblocks that prevent them from using the product
Within our product, we track the time to value in certain product loops. For example, how long it takes a customer to invite a client or set up their profile. We use tools to easily watch session replays and create funnels to track objectives toward a certain product loop.”

Active users
This metric refers to the number of users who actively engage with your product within a specific time frame. Monitoring active users can help you gauge the overall effectiveness of the user activation process.
Active Users = The number of users engaging with an app over a specific time period.
Long-term user activation objectives
Long-term user activation objectives contribute to sustained user engagement and the broader adoption of your product’s features over time. Use insights to inform your product roadmap and refine marketing strategies to encourage ongoing user activation, improve retention, and maximize CLV.
Feature adoption rate
This is the percentage of users who adopt new product features. Typically, it’s measured across all users to understand whether a feature rollout is successful. But this metric can also point out problems in the onboarding process when measured across users who reach the “aha” moment or activation milestones.
For example, you can tell if some features are being abandoned by the signup ratio. To drive feature discovery, consider adding some additional steps to your product walkthrough.
Feature Adoption Rate = (The number of users adopting a feature / total number of users (or within a specific user segment)) x 100
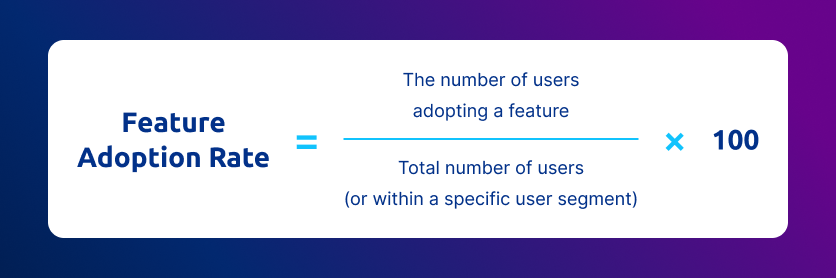
StoragePug collects feature adoption insights with Smartlook’s funnel analytics and session replays. These insights validate the feature adoption rate and tell you if a new feature is stable and ready to be promoted to the entire user database.
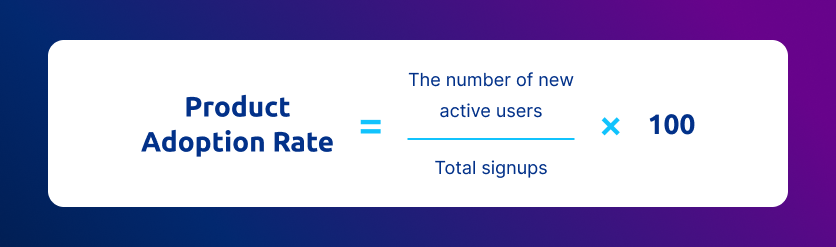
Product adoption rate
This refers to the percentage of customers who regularly use your product’s core features. Monitoring this metric can help you identify trends and opportunities to improve user activation over time.
Product Adoption Rate = (The number of new active users / Total signups) x 100
User churn rate
This represents the percentage of users who drop off (stop using) your product within a specific time period. To calculate this, you can measure the overall churn rate or examine segments to locate specific friction points.
User Churn Rate = (The number of churned users / Total users at the beginning of a time period) x 100

Analyze your key metrics often to refine and improve user activation tactics. With that, let’s explore 6 proven user activation techniques.
A 6-step approach to boost user activation in SaaS
Ready to drive user activation rates through the roof? Let’s explore six powerful tactics, complete with real-life examples. We recommend employing them one-by-one for maximum results.
1. Use in-app and website heatmaps to identify friction points
The first step toward increasing user activation is to pair in-app and website heatmaps to locate friction points at the beginning of the user journey. Heatmaps allow you to visualize user interactions, such as clicks, taps, hovers, and scrolls. Warm and cold zones show how users navigate your product and website, including where they encounter difficulties.
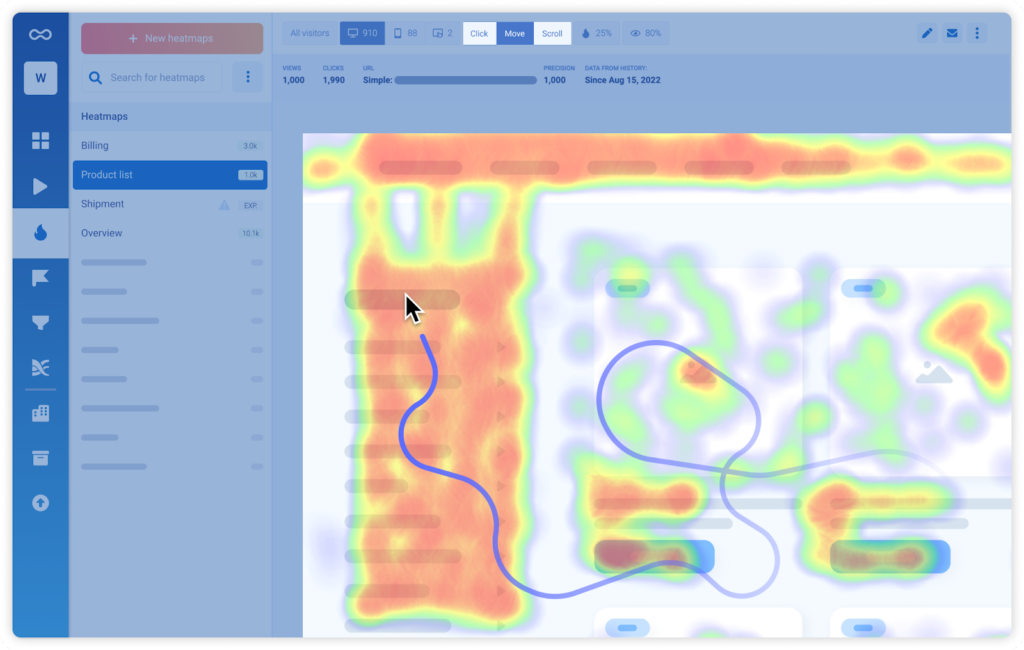
Smartlook’s in-app and website heatmaps help you uncover areas where users are struggling or dropping off. By analyzing this data, you can pinpoint issues such as confusing navigation, non-intuitive design elements, and poorly placed CTAs.
Case in point: Sewio incorporated Smartlook’s heatmaps to declutter its home page and increased its CTR by 276%.

Once you’ve taken care of all the technical issues, the next step is to spend some time creating an outstanding user onboarding experience.
2. Use welcome screens to personalize onboarding
Picture this: a new user stumbles upon your SaaS product and can’t wait to explore its features. But they’re greeted with a generic, one-size-fits-all onboarding experience — not the warmest of welcomes.
Welcome screens in the sign-up flow are your chance to roll out the red carpet for new users, making them feel valued and understood from the get-go.
Ask users about their jobs to be done, their industry, and their roles. Use this information to customize their onboarding experience. With tailored content and guidance, users will become more engaged.
For example, Lemlist collects your goals and then explores whether you’ve worked with the tool before. If you’re a first-time user, you’ll be taken on an interactive product tour.

Another great example of a welcome screen is by Later. It’s equipped with a social media scheduling platform that studies new signups by asking them questions, including:
- Their field
- Social media marketing goals
- The tasks they want to resolve
- How they heard about Later
Not only can you use this customer data to personalize the onboarding flow, but you can also use it to determine your top-performing marketing channels.


3. Implement interactive walkthroughs to guide users to the activation point
Interactive walkthroughs consist of step-by-step, in-app guidance that helps users explore your product’s features by completing actions themselves. They beat passive product tours when it comes to user involvement and shortening time to value.
The third step is to couple interactive walkthroughs with welcome screens to build a highly-personalized and cohesive user experience. Do this, and your user activation rates will soar.
For instance, Lemlist engages signups with cold email campaign creation guidance after they complete a microsurvey on the welcome screen.

Platforms like WhatFix or Appcues allow you to build interactive product walkthroughs and show how different customer segments adopt your product.
4. Use NPS and CSAT surveys to uncover customer pain points
Dig deeper to find out what users like/dislike. Use NPS (Net Promoter Scores) and CSAT (Customer Satisfaction) surveys to get a feel of user sentiment and uncover areas for improvement.
NPS surveys measure the likelihood of users recommending your product to others, while CSAT surveys assess their overall satisfaction. By collecting feedback through these surveys during the onboarding stage, you can identify and troubleshoot the issues that are preventing users from becoming fully activated.
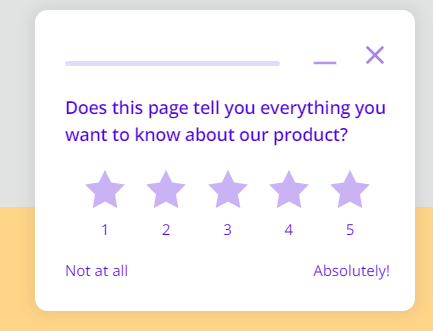
To implement in-app NPS and CSAT surveys, consider using a tool like Survicate, which offers an easy way to trigger surveys based on specific events and user actions. To capture the most valuable insights, time your surveys strategically. For example, you may wish to trigger an NPS survey after a user has completed an activation milestone or launch a CSAT survey after they’ve interacted with a specific feature.

5. Watch session recordings to understand how users interact with your app
Imagine being able to see your product through your users’ eyes, witnessing firsthand how they navigate your app and where they stumble. With Smartlook’s advanced session recordings, you can do just that.
By watching recordings, we found that users struggled to understand their results in CRM Health Grader. Users were presented with a detailed report of their sales data, but without someone on the call to walk them through the results, they were lost.
The fix? Pulling out the most important bits and presenting them right at the top. We made the change, tested it again, and our users reported a much better experience.
With such analytics, we exposed user concerns early on and were able to course-correct, leading to greatly improved conversion rates. As a byproduct, we were also able to open the tool up to a wider audience.

Session recordings capture every click, swipe, and scroll, offering a detailed, real-time view of how users interact with your app. By watching these recordings, product managers can gain invaluable insights into user behavior and uncover pain points and usability issues.
You can also filter session recordings by event occurrence, location, duration, and technology and skip idle time.
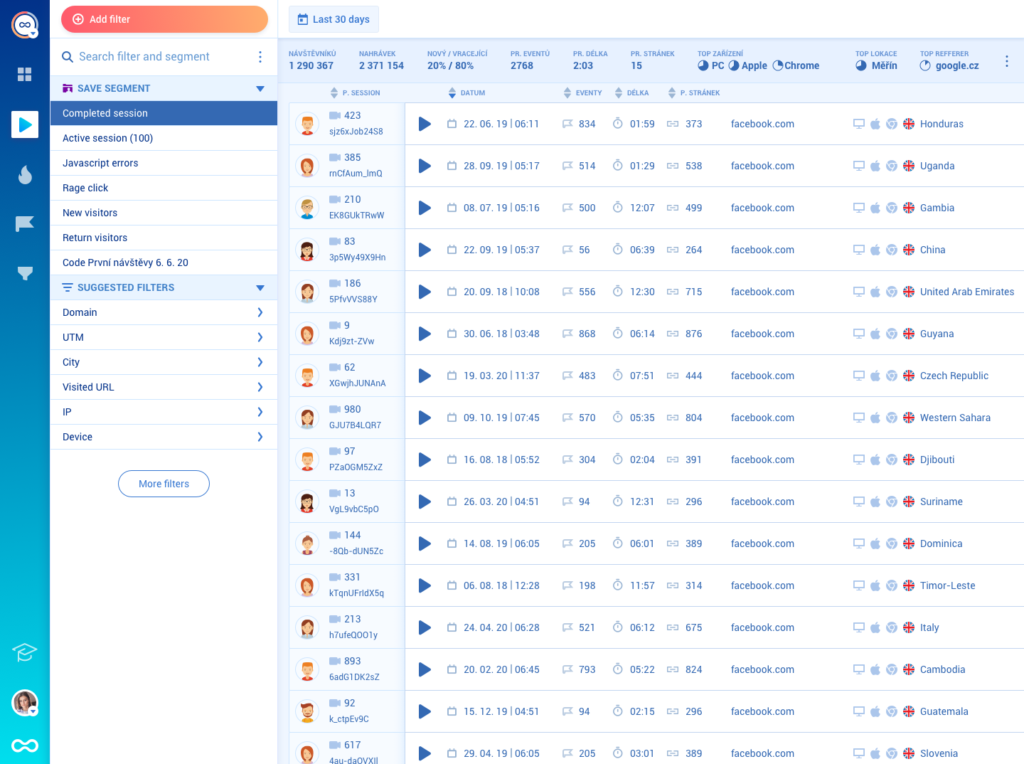
Here are some of the insights you can glean from session recordings:
- Identify confusing UI elements
- Analyze the onboarding flow
- Observe feature adoption
- Discover user preferences
The StoragePug Product team uses session replays to see how customers adopt new features and locate friction points and unexpected user paths. They also utilize session recordings to analyze and improve product UI.
6. Re-engage inactive users with email marketing
Even with the best onboarding experience, some users might still slip through the cracks and become inactive. With email marketing, you can re-engage these dormant users and reignite their interest in your product.
Types of content you may wish to send include:
- Product updates
- “We miss you!” emails
- Success stories
- Incentives
- Educational content
Here’s what a re-engaging email by WordTune looks like:

Best tools for user activation
To spot drop-offs and see how users behave within your app and website, product managers use a range of product analytics tools. Below, you’ll see the 3 best tools on the market for collecting quantitative and qualitative data and for performing an in-depth user behavior analysis.
1. Smartlook

Smartlook combines qualitative and quantitative analytics about user behavior at different stages throughout the customer journey. The following features are of utmost importance for optimizing user activation rates:
- Use session recordings to see why users don’t activate, including why they leave negative NPS scores
- Heatmaps will help you visualize and quantify UX issues across your app and website
- Incorporate funnel analytics to break down the user activation stage and identify which steps cause friction
- Get the numbers regarding how many users become activated over a given period with the events feature
Book a personal demo and start your free 30-day trial: no credit card required.
2. Survicate

Survicate is a powerful tool for building in-app microsurveys and collecting quantitative and qualitative user feedback. Trigger surveys by event occurrence, hovers, clicks, time period, etc. Create follow-up questions to get a sense of why users leave positive and negative scores.
3. Appcues
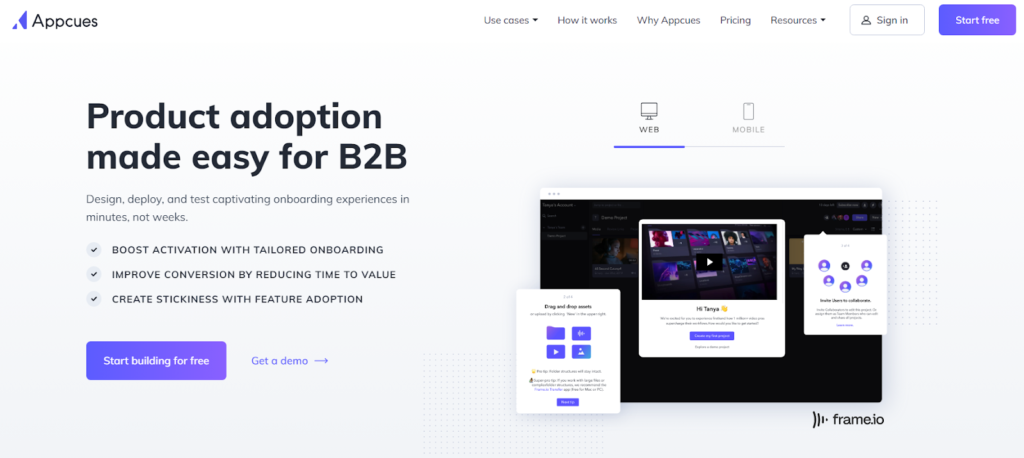
Appcues includes tools for driving product adoption and user activation. With it, you can create interactive onboarding flows, announce new features with modals, and deliver contextual help with tooltips — all of which are code-free.
Drive user activation rates with Smartlook
In a nutshell, user activation can make-or-break your SaaS product’s success. With Smartlook’s qualitative and quantitative app analytics, you can effortlessly measure, monitor, and optimize your user activation strategies for both short-term and long-term success.
Don’t let low user activation rates hinder your growth – equip yourself with the right tools and tactics from this guide to create an engaging, user-centric experience that drives product growth.
Schedule a Smartlook demo and start your free 30-day trial today!


