


Product adoption is the process of getting potential customers to start using your product regularly.
Optimizing this process is one of the most essential tasks for product teams. If you can’t get users to incorporate the product into their routine, you’ll struggle with low retention rates, high churn, and an unengaged user base.
However, driving product adoption is not an easy task.
You first need to attract the right type of customers (i.e., those who’ll find your product valuable enough to use regularly). Then, you need to design an onboarding experience that helps them reach your product’s value. You also need to measure if your efforts actually result in higher adoption.
Put simply, improving product adoption requires cross-team collaboration throughout the entire customer journey.
In this guide, we’ll help you successfully measure and improve adoption by covering the following.
- What is product adoption? (With examples)
- 3 essential metrics for measuring product adoption
- Best practices for improving product adoption
- 5 tools for measuring and improving product adoption
Smartlook can help you track key adoption metrics, analyze your customers’ behavior, and find ways to improve their experience. Start a full-featured, 30-day trial (no credit card required), or book a demo with our team to see how Smartlook can help you measure and boost product adoption.
What is product adoption? (With examples)
Product adoption (also called user adoption) is the process of getting potential customers to start using your product regularly. This process consists of six stages:
- Awareness, during which potential customers become aware of the problem your product solves
- Interest, during which they research potential ways to solve their problem, including your product
- Evaluation, during which they compare your products and your competitors’ products
- Trial, during which potential customers become users and give your product a try
- Activation, during which users experience your product’s value for the first time by reaching the “Aha” moment (or activation milestone)
- Adoption, during which customers develop habitual product usage, i.e., successful activation prompts them to integrate your solution into their workflow (B2B) or personal life (B2C).
This process looks very different depending on the industry, product type, and company size.
Let’s take Gong and Spotify as theoretical examples.
Gong is a B2B product that gives sales teams visibility into their client-facing conversations. Adoption for Gong may occur when sales managers start logging into the product once a week to check how individual reps are doing.
At the same time, Spotify may have totally different adoption goals, e.g, getting people to use the app every other day for at least 30 minutes.
The tactics you can use to increase product adoption will also vary depending on your company’s stage.
For example, exciting but unproven startups typically have to focus their product adoption strategy on tech-savvy people who like experimenting with new products (often called innovators or early adopters). Conversely, established businesses with a recognizable brand can focus on more conservative and risk-averse customers (sometimes called laggards or the late majority).
How to measure product adoption: 3 essential metrics
As a complex, multi-department process, product adoption can’t be measured with a single metric. But there are various metrics that indicate if your adoption efforts are moving things in the right direction.
Below, we’ll discuss three of those metrics, but for a detailed breakdown, check out our guide to measuring product adoption.
#1 Activation rate
Activation rate is the percentage of users who reach your product’s activation milestone.
Activation rate = Activated users during a specific period / Total users for the same period * 100
It’s worth noting that this metric sometimes gets confused with product adoption rate, which is the ratio of new users to all users for a specific period. However, adoption rate shows only how many users you’ve acquired in a specific time period relative to your whole user base. Since this doesn’t take into account if they find value in your product, activation rate is a better gauge for your adoption efforts.
Now, before you can calculate activation rate, you need to define your product’s “Aha” moment (i.e., decide when users become “activated”).
In practical terms, the “Aha” moment (or activation milestone) is an action or set of actions that show users are getting value from your product. This milestone should be correlated to long-term retention (i.e., habitual usage), since that’s the whole point of activation.
For example, a social media app like Instagram may consider users activated when they upload three photos in a week. On the flip side, a CRM like Salesforce may consider the act of importing your leads into the system as activation.
In short, activation is product-specific.
Finding the right activation milestone is typically done by analyzing users’ behavior and asking them about their experience. The Jobs-to-be-Done framework is also a useful way to clarify exactly what customers are trying to accomplish with your product.
Once you find the right action or set of actions, you can easily track them with Smartlook’s “Events” feature.
Our tool allows you to monitor many standard user actions (like page visits, clicks, and text inputs) without coding. You can also define custom events via JavaScript to track pretty much any other activity you want.
For example, the screenshot below shows two custom events being compared on the same screen in Smartlook.

You can track any actions that demonstrate that users are getting value from your product — like clicks on a certain feature, time spent in your product, and so on.
#2 Free-to-paid conversion rate
Most SaaS apps have a free trial or free version so users can try the functionality before paying.
The percentage of free users who become paying customers — i.e., your free-to-paid conversion rate — is an essential product adoption indicator.
A high free-to-paid conversion rate signals that many users find your product useful enough to pay for it after the free trial ends — which likely means they’ve incorporated it into their routine.
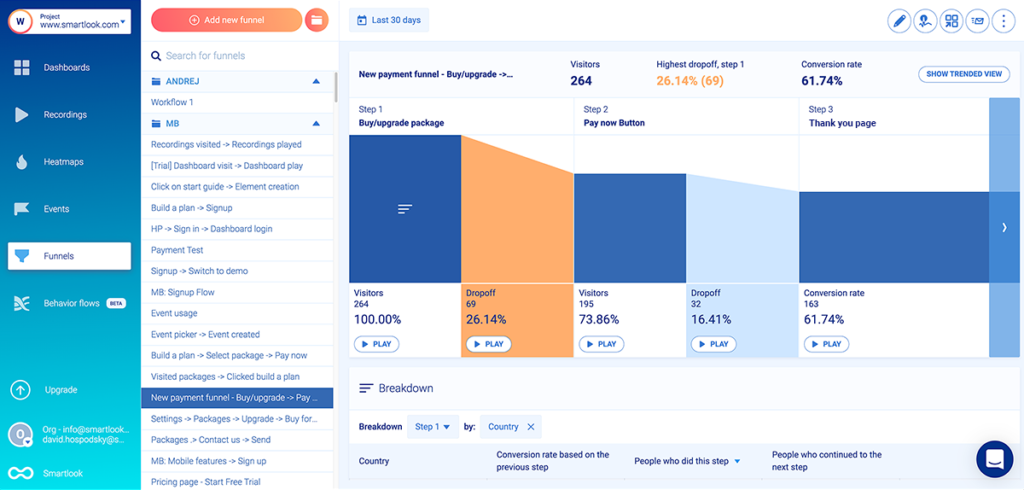
You can calculate this metric with Smartlook’s funnels feature. Funnels are sequences of events that map out common user paths — like completing onboarding tutorials or checkout processes (like the one shown below.

You need only two events to calculate your free-to-paid conversion rate:
- Event 1: Users create a free account/start a free trial.
- Event 2: Users upgrade to a paid plan.
Once you define those events and create the funnel, Smartlook automatically calculates the free-to-paid conversion rate for you. You can then monitor this funnel in your dashboard and easily see how changes affect its conversion rate.
#3 Time-to-value (TTV)
TTV measures how long it takes, on average, for users to reach your activation milestone.
The longer the TTV, the higher the chances of users giving up on the product. That’s why good user onboarding shortens TTV as much as possible.
For example, say you have a fintech app like Venmo or Cash App.
Users need to connect to their bank account before they can experience the benefit of easily exchanging money with friends or making purchases with their phone. If the bank account setup is too difficult or time-consuming (i.e., the TTV is too high), many users will churn before getting activated.
On that note, we’ll look at some best practices and tools for improving your onboarding process and reducing TTV in the next sections.
Best practices for improving product adoption
In order to improve product adoption, you need to consider the entire user journey, from the moment people first encounter the product to their decision to use it regularly.
The ideas below are based on the three key stages of that journey — pre-purchase, onboarding, and post-onboarding.
Pre-acquisition: Reduce friction and increase motivation
The product adoption process starts with getting the right potential customers to learn about your product and go to your site. From there, it’s all about driving them to the next step — creating a freemium account, starting a free trial, or booking a demo.
At a high level, there are two ways to get them to that next step:
- Increase their motivation by refining the site’s copy and design, trying new offers, and more
- Reduce friction by analyzing their behavior, finding points of friction, and optimizing the user experience
Many tactics fall under these two categories. Here are some of the easiest to start with:
- Use heatmaps to understand the typical user’s experience. Heatmaps show you where users click, where they move their cursors, and how far down a page they scroll. This can give you ideas for where to place important text or call-to-action (CTA) buttons. For example, the Smartlook heatmap below shows which areas of our site most visitors see without scrolling.

- Include relevant images and videos. These help potential customers understand your product and visualize themselves using it. For example, we’ve embedded a video on our homepage that demonstrates some of Smartlook’s features in a concise way.

- Use social proof. The uncertainty of trying something new is often an obstacle for potential customers. Having social proof on your site — in the form of client logos, case studies, or quotes — can alleviate these concerns and build trust with your audience. This is another tactic we use on our homepage.

There are many more ways to get people to try your product, so check out our article on the 19 data-driven ways to boost conversions quickly for more details.
Onboarding: See where users struggle and get them to the “Aha” moment as fast as possible
Once you get users to try your product, you need to ensure they get value from it. Without that, your acquisition efforts will be in vain, as most users will quickly churn.
That’s why the main goal during the onboarding stage is getting users to the “Aha” moment as fast as possible (i.e., reducing TTV).
If you already have an onboarding flow, Smartlook can help you analyze how users navigate it and see which steps prevent them from reaching the “Aha” moment.
Here’s how:
You can map each step of your onboarding path to an event in Smartlook. Then, you can create a funnel by putting each step in the order users follow.
The funnel will show you the overall conversion rate for your onboarding flow as well as the drop-offs between each step. As a result, you can hone in on the steps that prevent most users from experiencing the value of your product.
In fact, Vertigo Games — a game development company and Smartlook customer — uses this exact process to analyze how users navigate their onboarding tutorials.

Note: Because onboarding impacts product adoption so directly, it’s easy to think that a great onboarding experience is enough to drive adoption. However, that’s not the case. If you’re attracting the wrong type of users, no onboarding experience will convince them to stick around. Acquisition and onboarding both play key roles, but by themselves neither is enough to drive adoption.
Post-onboarding: Analyze and improve feature adoption
Even after a successful onboarding, long-term adoption isn’t a guarantee. You still need to help new customers get more benefits from your product by exploring specific features and use cases.
This is where the concept of feature adoption comes in. Feature adoption, as the name suggests, is the process of getting existing customers to use individual features. To do this, you first need to understand how customers currently engage with your features and find opportunities to improve their experience.
Let’s use StoragePug as an example.
StoragePug is a platform that helps self-storage businesses rent out facilities and attract new clients. One of their main features, called Lead Manager, gives their customers insights into their website traffic, new leads, contacts, and so on. StoragePug’s team wanted to understand how customers interact with this feature, so they used Smartlook’s session recordings — a tool that shows you a visual replay of your users’ exact experience with your product.
The session recordings revealed that users were trying to click on tiles that weren’t clickable, which hurt the overall user experience. Armed with this insight, StoragePug’s team gave this feature a new name and changed its design and functionality.

The redesigned Home Screen feature has bigger, clickable tiles, and new microcopy. This change realigned the feature with customers’ expectations in an effort to improve their experience and boost adoption.
Besides analyzing how customers engage with your features, another important way to improve adoption is to nudge users toward the features they should try. We’ll discuss how to do this with a product adoption tool called Appcues in the next section.
5 tools for measuring and improving product adoption
We just covered a lot of product adoption metrics and best practices. Now, let’s discuss which tools you can use to put the advice into action.
Smartlook: Measure product adoption and evaluate the impact of changes

Smartlook is our product analytics and visual user insights platform. You can use it to collect essential product usage data with a single code snippet, understand user behavior, and monitor product and feature adoption.
Here are a few ways to use Smartlook’s feature set to analyze adoption:
- Track activation and adoption events. As we mentioned, Smartlook enables you to track key actions as events. These can be account creations, account logins, feature clicks, plan upgrades, or any other activities showing that users are getting value from your product. With Smartlook, you can monitor the occurrences of these events and see how changes to your product’s design or functionality affect them.

- Analyze user flows. Earlier in the article, we showed how funnels can help you analyze onboarding flows and calculate your free-to-paid conversion rate. Thanks to their versatility, funnels can also be used for many other user paths, like checkouts. For example, you can map each step of your checkout to an event, build a funnel, and see where most users drop off (in the screenshot below, that’s between Steps 1 and 2).
- Watch how customers interact with your product. While most product analytics tools focus only on quantitative data (i.e., stats and metrics) Smartlook lets you go beyond raw numbers and see your users’ actual experience. This is possible thanks to our session recordings, which show you users’ entire journeys, including where they click, scroll, move their mouse, and which pages or screens they visit. For example, the screenshot below shows a user navigating an onboarding tutorial.

You can learn how to use Smartlook to improve your UX, conversions, and customer retention in the following resources:
- Our practical guide to product analytics
- Our guide to tracking user activity on websites
- Our article on implementing mobile app tracking and analyzing user behavior
You can even give Smartlook a test run today with our full-featured, 30-day trial — no credit card required.
Survicate: Get direct feedback from users

Sometimes, the easiest way to understand why product or feature adoption is low is to ask your users. Survicate lets you do that with surveys and feedback widgets.
Here are two ideas you can try out:
- Run net promoter score (NPS) and customer satisfaction score (CSAT) surveys. These surveys are a common way to evaluate how satisfied customers are with a certain feature or your product as a whole.
- Run contextual in-product surveys. For example, you can run surveys after users try a new feature or spend a certain amount of time logged into their accounts to understand their experience.
Note: Survicate’s integration with Smartlook combines the power of direct user feedback and product analytics. For example, say you run a survey with a question like “How would you rate your experience with our product?” where customers can answer with numbers between 1 and 5. With the integration, you can jump straight into the session recordings of users who gave a low score to uncover issues that affect product or feature adoption.
Optimizely: Experiment with different product adoption tactics

Optimizely lets you create various types of tests, run them on different user segments, and see the impact they have on product adoption.
For example, say you have two different value propositions for a landing page but don’t know which one will drive more visitors to sign up. You can run an A/B test by serving two different versions of the page to visitors (one for each value prop) and see which one converts better.
Experiments are also crucial for refining in-app experiences. For example, you can use Optimizely to compare two versions of your onboarding flow and determine which one leads to faster activation and higher adoption.
Note: Optimizely integrates with Smartlook, letting you watch session recordings of users who interact with each variant you’re testing. This is crucial for validating the accuracy of your experiments, as we explained in our article on the top A/B testing tools.
Intercom: Drive conversions and provide fast support

Intercom is one of the most popular tools for providing customer support. It helps you give users the information they need, when they need it, by integrating a live chat pop-up into your website and product.
For example, we use Intercom’s messenger on our site, which lets visitors ask product questions and get quick answers.

This improves the customer experience and helps us drive more sales because our team can explain to visitors how Smartlook can solve their problems.
Intercom is also useful for chatting with customers while they’re using the product. Customers can ask to use the live chat function when they get stuck instead of having to search through documentation. Helping people get quick answers when they run into problems can prevent them from churning.
Lastly, a word of caution — live chat has a built-in expectation for fast responses. Make sure your customer success team can handle inquiries quickly before implementing Intercom or another chatbot.
Note: Intercom also integrates with Smartlook. This integration allows you to jump straight into session recordings of the users you’re chatting with to understand and solve their problems quickly.
Appcues: Help users navigate your product

Appcues is a tool for improving product engagement and activation. You can use it to create better onboarding experiences, drive feature adoption, and improve the entire post-purchase customer journey.
For example, Appcues lets you:
- Create onboarding tutorials or checklists that guide users to the “Aha moment”. You can even segment your customer base (by their plan, account owner, and other criteria) and build different onboarding paths for each segment.
- Boost feature adoption with nudges and walkthroughs. You can create in-app messages that entice users to try a feature and show them how to use it.
- Promote new features. After releasing a new feature, you can encourage users to try it by creating in-product announcements.
Measure and drive product adoption with Smartlook
Smartlook empowers fast-growing, fast-building product teams with the usage data they need to make better product decisions.
Our tool combines the power of quantitative analytics and product experience insights so you can:
- Capture every user interaction with a single code snippet.
- Quantify their behavior with event tracking and funnel analysis.
- Track product analytics metrics like daily active users, retention, and conversion rates.
- Uncover why users do what they do, which is crucial for improving product and feature adoption, as well as conversion rates and retention.
- And much more.
To get a detailed presentation of how Smartlook can help you (without having to set it up), book a free demo with our team. We’ve found that customers who go through the demo have a 70% faster onboarding time and leave positive reviews 99% of the time.
If you want to give Smartlook a go yourself, start a full-featured, 30-day trial — no credit card required.


