Mobile analytics is the process of collecting and analyzing behavior data from users on mobile devices. The term sometimes includes the mobile web (i.e., users accessing websites and web apps via mobile devices), but is more often used in the context of analyzing user activity in native iOS and Android mobile applications.
In both cases, mobile analytics provides insights into the behavior and experience of mobile users, which helps companies:
- Boost conversions and retention by removing bottlenecks in the user journey.
- Make data-driven decisions on how to refine their products.
- Find and fix bugs and other UX problems.
To provide these benefits, mobile analytics tools come with various quantitative and qualitative analytics features, such as session recordings, events, funnels, and more. In this guide, we’ll show you three real-life examples of companies using these mobile analytics features to improve their products, UX, and conversions.
Then, we’re going to cover a few essential mobile analytics metrics and explain how to set up mobile analytics tools on websites and native mobile apps.
But before we dive in, let’s quickly discuss the difference between mobile analytics and traditional web analytics.
You can start analyzing the behavior of your website or mobile app’s users today by signing up for a free, 30-day Smartlook trial (no credit card required). Our tool combines the power of session recordings, heatmaps, events, and funnels, helping you see everything your users do, uncover why they do it, and improve their experience.
What’s the difference between mobile analytics and traditional web analytics?
As we said, the term mobile analytics can refer to two different things:
- Gathering and analyzing behavior data from mobile users who are interacting with native mobile apps. This is the more strict and widely-used definition. In this context, the difference between mobile and web analytics is the platform — one deals with websites or web apps, while the other is only concerned with native mobile apps. Additionally, some analytics solutions are focused on sites or mobile apps, while others (like Smartlook) can be used on both. There are also differences in the way behavior tracking is set up on each platform and in the metrics that you should track, as you’ll see later in this guide.
- Gathering and analyzing behavior data from mobile users who are interacting with websites, web apps, and native mobile apps. This is the broader definition because it doesn’t separate mobile users based on the product’s platform (web or mobile), but groups them together based on the device. In this context, an important difference is the fact that mobile websites have incoming link data, which is useful for measuring attribution for advertising and marketing campaigns. Native mobile apps don’t produce this data because they have to be opened directly from the device.
It’s also worth noting that today, a single user’s journey can take place across platforms. For example, a customer can browse e-commerce items on a website using their smartphone but complete their purchase with the company’s native mobile app.
This is a cross-platform journey, even though it takes place on the same device. As a result, cross-platform analytics has also emerged as a popular category alongside web and mobile analytics.
3 real-life examples of companies using mobile analytics to boost conversions, fix bugs fast, and improve their UX
Businesses turn to mobile analytics solutions to understand how people are interacting with their product in the wild, instead of using focus groups and user tests as a proxy for their users’ actual experience.
The idea is to gather behavior data, analyze it, and find UX problems and opportunities for improving conversion rates. Mobile analytics tools like Smartlook help businesses do this with features like mobile session recordings, event tracking, funnel analysis, and more.
Here are three examples of companies using mobile analytics to improve their product and bottom line.
#1 AstroPay: Improving sales funnel conversions by 56%
AstroPay is a fintech app that connects 5M+ users with 500+ merchants in Asia, Africa, Latin America, and Europe.
In order to optimize the app experience, AstroPay’s team wanted to analyze feature adoption and customer journeys, as well as find places where users get stuck.
Once they set up Smartlook, they started tracking individual user actions, i.e., events. Then, they used these events to create funnels, which mapped their most important user flows, such as their checkout.
After they analyzed the customer journey data, they found a problem — many users didn’t complete their cryptocurrency purchase process after starting it.
From here, the team had to find out why that happened. For that, they used Smartlook’s session recordings, which show a video of everything users do during their session, as you can see in the screenshot below.
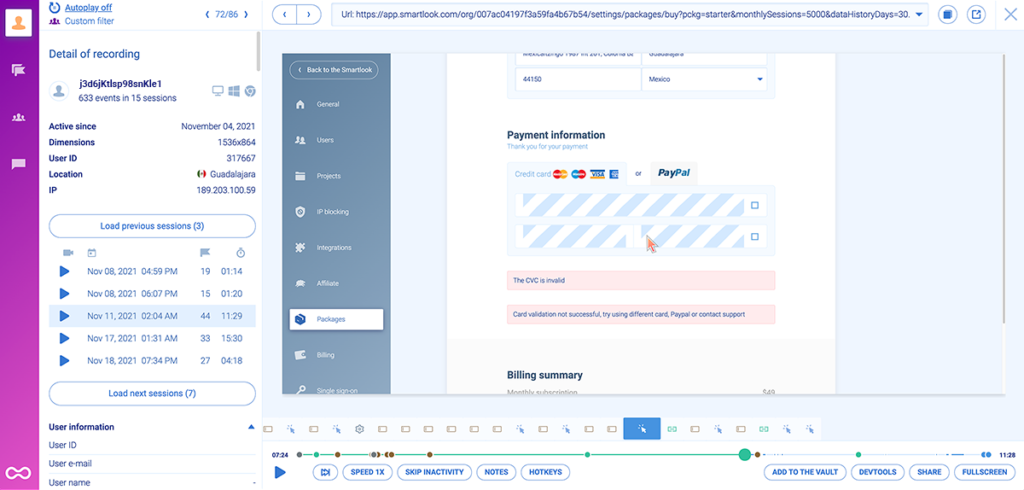
AstroPay’s team came away with two key insights from this analysis:
- Some users dropped off because there were way too many steps in the purchase process.
- After purchasing, many users spent several minutes anxiously looking for the cryptocurrency in their wallet, not realizing the transaction was still pending.
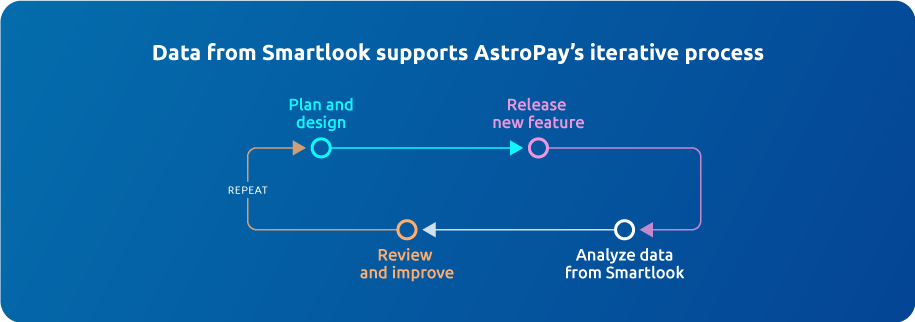
Empowered by these findings, AstroPay made a data-driven redesign of their cryptocurrency purchase flow, removing unnecessary steps and adding a “Purchase Pending” banner. This resulted in a much better user experience and a 56% lift in conversions.
Today, AstroPay’s product and dev teams both use Smartlook to make product decisions based on analytics data.
#2 Vertigo Games: Speeding up bug reproduction and analyzing user behavior
Vertigo Games is a game development company that builds and self-publishes first-person shooter games.
During the early development stages of one of their games, they had a big issue — bug reproduction was slow and often unsuccessful because their team couldn’t see the exact circumstances in which bugs occurred.
As Sinem Bulut Selduz, Game Analyst at Vertigo Games, said:

Session recordings helped them overcome this problem by showing them everything users did leading up to a bug. Now, their QA can simply watch how each bug occurred, instead of trying to reproduce it via trial and error.
Additionally, the product team also uses session recordings to verify if new users get a great first impression of the game.

Both teams also use detailed funnels (with as many as 60 steps) to map how users navigate their onboarding tutorial and other key flows. This helps them understand the functionality and user experience throughout the game.
#3 Hookle: Improving the onboarding experience and fixing bugs easier
Hookle is a Finnish startup that offers a social media management app for Android and iOS.
They wanted to use a new mobile analytics tool to:
- Check which features in their mobile app are useful for their users.
- Improve user experience (UX) and app usability.
- Give their users fast and accurate support.
- Speed up bug reproduction.
Additionally, they wanted a mobile analytics tool that was compatible with Flutter — the framework their app was built with.
Smartlook checked all of these boxes, so Hookle’s teams started using it. Thanks to the session recordings, they quickly saw an opportunity for improving their onboarding.
As Jere Seppala, Co-founder and CTO of Hookle, said:

The customer support team also uses session recordings to debug faster. Before Smartlook, it was hard for them to understand bugs due to the mismatches between what users described and what actually happened. Now, they easily solve any discrepancies and find the root cause by simply watching their users’ sessions.
The different types of mobile analytics (& tools to implement them)
Now, we’ll discuss a few different sub-categories of mobile analytics, starting with the crucial, but overlooked distinctions between quantitative and qualitative analytics.
Quantitative vs. qualitative analytics
Mobile analytics tools can collect two types of data: quantitative and qualitative.
Quantitative data is information in the form of numbers, meaning it can be quantified, measured, or counted. This data is used to answer questions like “What?”, “How much?”, “How many?”, “How often?”, etc.
Quantitative analytics tools provide charts, dashboards, and reports filled with stats and metrics about your users, such as who they are (i.e., demographics), their device and operating system, their location, whether they’re new or returning users, and so on.
Some popular quantitative analytics tools are Flurry, Firebase, and Countly. You can find more examples in our article on the top free and paid mobile app analytics tools.
While useful, most quantitative analytics solutions have two limitations:
- Their data can be difficult to interpret if you don’t have a data-oriented personality and technical skills. This means quantitative tools are most useful to technical product managers, data analysts, and developers.
- They often can’t tell you why users do what they do, making it difficult to improve their experience and your conversions.
Qualitative data is non-numerical data that’s descriptive and rich in context and detail. This type of data is used to answer two key questions: “How?” and “Why?”
Qualitative analytics tools help you get the subjective insights into what your users want or need or why they do what they do. In recent years, these tools have gained popularity in the mobile analytics world as product teams look for more accessible solutions that can give them a better understanding of the “why” behind their users’ behavior.
For example, session recordings are one of the best ways to gather qualitative data.
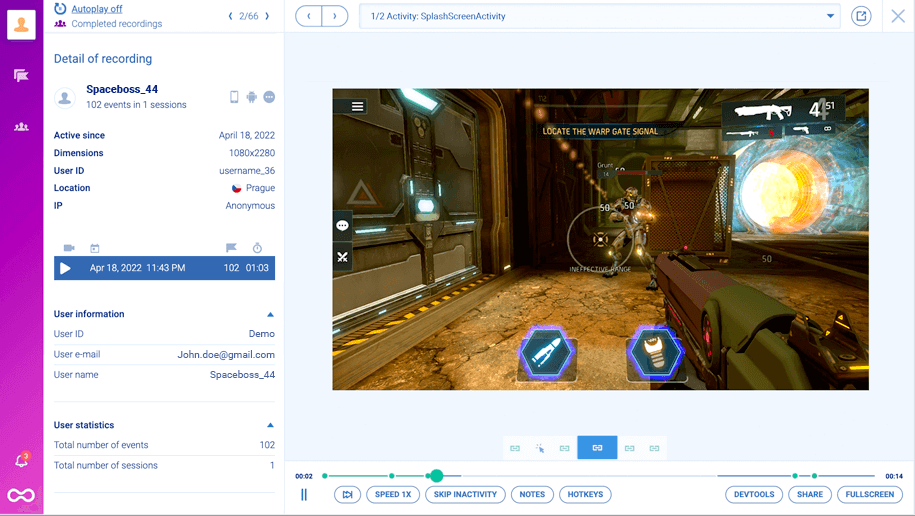
The screenshot above shows a mobile game session recording. As you can see, the video on the right lets you seeeverything exactly as your users saw it. This, alongside the additional information on the left, provides the necessary context for solving UX problems and improving your conversions.
Session replays also have a low barrier to entry, which is why product, marketing, UX, customer success, dev, and QA teams can all benefit from them. This is something we’ve discussed at length in our product analytics guide.
Besides session recordings, heatmaps and surveys are also popular qualitative analytics features.
Some widely-used qualitative analytics tools are Smartlook (which also has quantitative capabilities), UXCam, and FullStory. You can learn more on this topic in our article on the top 8 session replay and visitor recording tools.
Product usage and engagement analytics
Again, organizations use mobile analytics to gather data on how users interact with their products. The process of gathering and analyzing these data points is called product usage analytics (or engagement analytics).
Having access to app usage and user engagement data helps you uncover:
- How often users login to the product.
- Which features they use the most/least.
- How much time they spend using the product, and much more.
Smartlook, as well as traditional analytics platforms like Mixpanel and Amplitude, can all help you get these insights. To learn more, check out our article on the best product analytics tools.
Product performance analytics
Product performance analytics refers to the process of finding bugs, crashes, slow load times, and other technical problems that affect your UX.
For example, Smartlook has a Crash Reports feature for Android apps, which automatically provides a list of all app crashes. The feature also shows you information about the version (or versions) of your app where a crash occurred, as well as the number of users who experienced it.
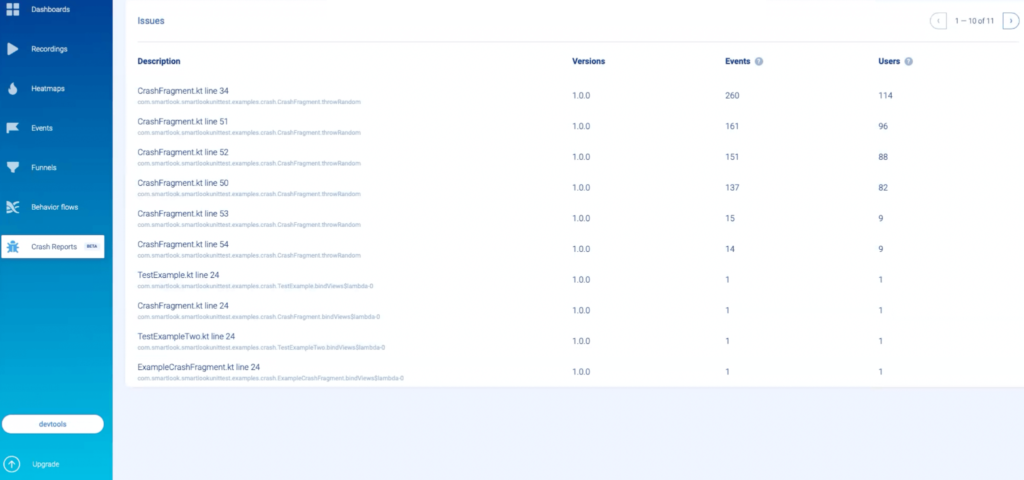
Due to their technical nature, classic performance analytics tools like Crashlytics, BugSnag, and Sentry are used by technical product managers, developers, and QAs.
However, tools that incorporate session recordings (like Smartlook) also enable non-technical team members to analyze product performance. We’ve discussed the benefits of combining crash reporting with session recordings in our article on the best Crashlytics alternatives.
Essential mobile analytics metrics
Before we dive into the metrics, note that the first few are mostly applicable to mobile apps, but the final one (conversion rates) is a must for both websites and mobile apps.
Daily, weekly, and monthly active users
These first three metrics are pretty straightforward:
- Daily active users (DAU) is the number of users who open your app in a day.
- Weekly active users (WAU) is the number of users who opened your app at least once during the week.
- Monthly active users (MAU) is the number of users who opened your app at least once during the month.
Many product analytics tools will calculate these metrics for you. For example, in Smartlook, you can open the dashboard and click on “Add new tile”.
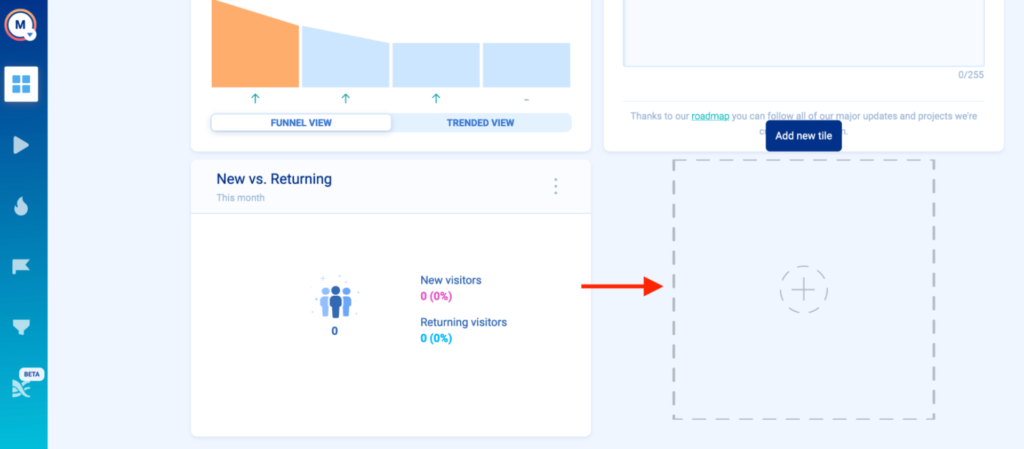
Then, click on “Active Users”, where you can choose between daily, weekly, or monthly active users, and choose the data range you want to analyze (seven, 30, or 60 days).
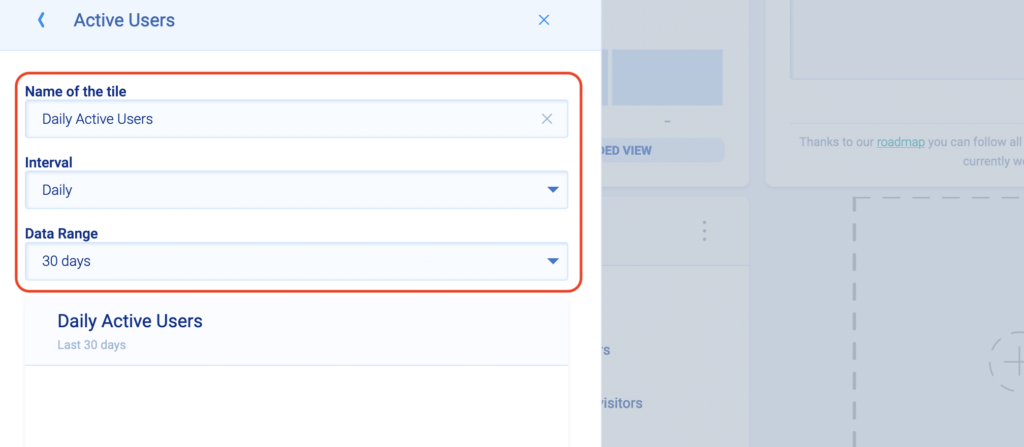
Once you click “Save” the newly created tile will appear in your dashboard, where you can easily keep track of your daily, weekly, or monthly active users.
Retention rate
Retention rate is the percentage of visitors that continue to perform an action (e.g., log into their account, open a feature, or make an in-app purchase) for a certain amount of time after first doing so.
Smartlook has a feature called Retention Tables, which lets you track user cohorts over time while calculating retention for you.
To calculate retention, you first need to select an action, i.e., an event. In the example below, we’ve used account logins as our event.
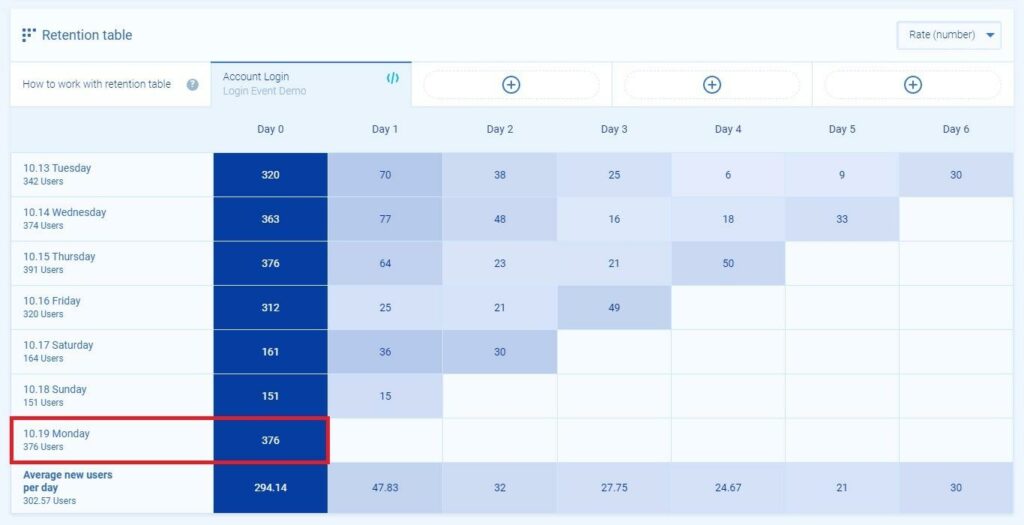
As you can see in the screenshot, the retention table shows that 376 users triggered this event for the first time on Monday, 10.19, which is our Day 0.
Over the next few days, the table automatically tracks this user cohort (users who first performed the “Account Login” action on 10.19).
Here’s the retention data for the next 5 days:
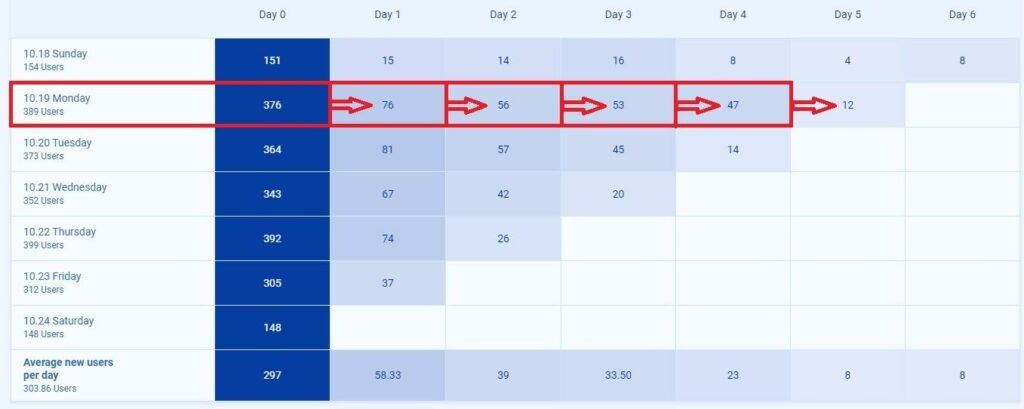
As you can see, on Day 1, 76 of the 376 users performed the action again. That number gets progressively lower, with a big drop between Days 4 and 5.
Conversion rates
Conversion rate is the percentage of users who take a desired action on your site or product, like:
- Completing an onboarding tutorial.
- Opening a newly released feature.
- Making an in-app purchase.
Your site or app likely has many important flows, each one with its own conversion rate and issues that lead to drop-offs. This means you’ll need to analyze each one, find out its conversion rates, and remove its bottlenecks.
You can do this in Smartlook by combining funnel analysis with session recordings.
Funnels are sequences of steps (i.e., events) users go through to complete a goal. Building funnels lets you analyze user behavior through these key flows, find out where users drop off, and calculate conversion rates.
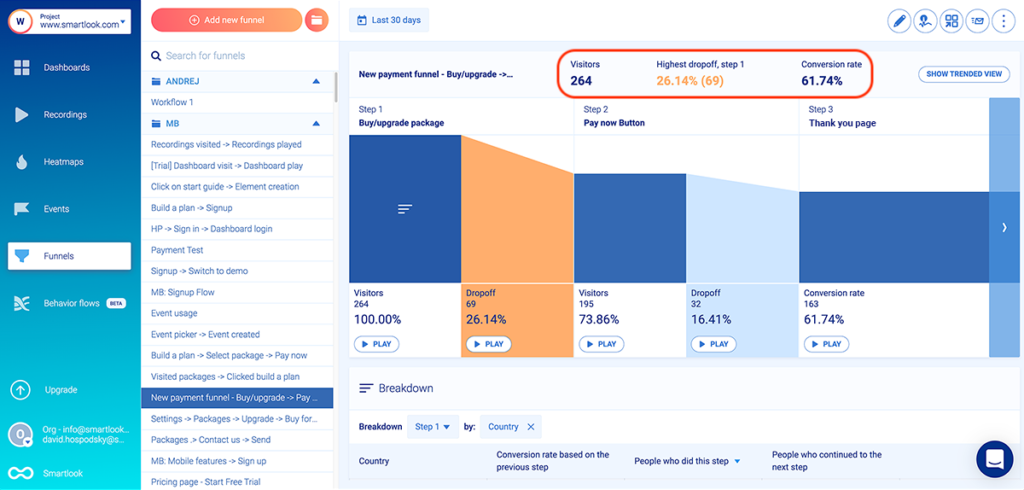
You can also jump into session replays of people who dropped off to find out why.
For example, the screenshot below shows a Smartlook session recording of a mobile user’s journey while navigating an onboarding sequence.
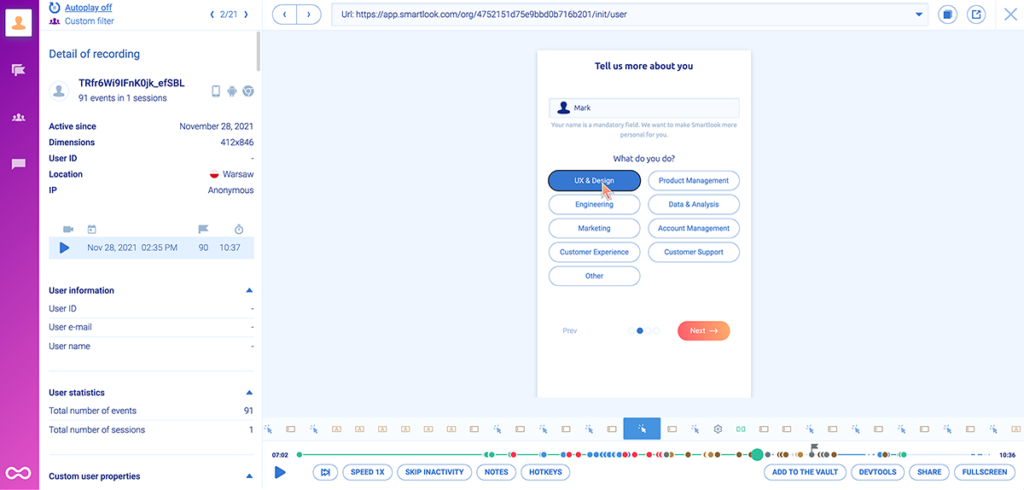
During the roughly 10-minute session, the user completed 91 events. If you look at the drop-off rate between each step, you can find where the sharpest drop-off happens.
Perhaps there’s a technical error there or users simply get bored with the tutorial. Either way, watching session recordings of users who dropped off at a specific stage can help you uncover why they did so.
For more detail on this topic, check out our funnel analysis guide.
How to set up mobile analytics tools on websites and native mobile apps
Tracking mobile users’ interactions with a website usually requires the same setup process you’d use for tracking users on desktop or laptop devices. The setup is simple — you just install a JavaScript snippet in your site’s code and they start collecting data.
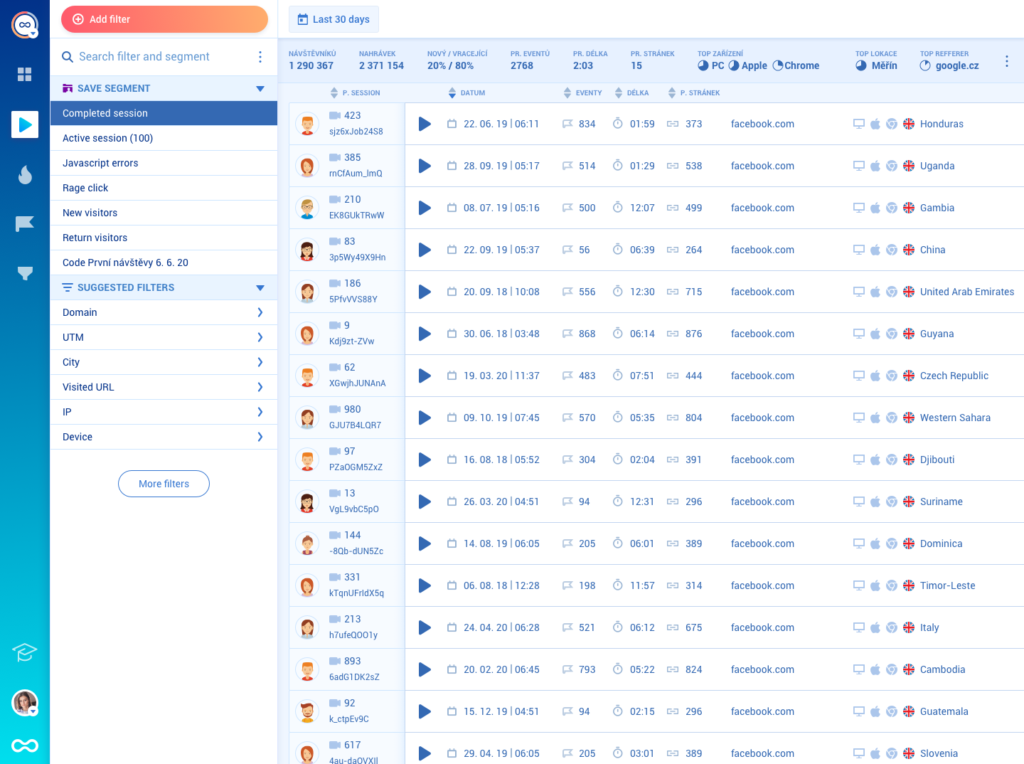
For example, once you install the Smartlook code snippet, our tool starts recording all mobile (and desktop) user sessions on your site and collecting data about page views, referrers, locations, devices, taps, and more.
A few minutes after the snippet is installed, session recordings will start appearing in the “Recordings” tab.
Then, you can further analyze your users’ behavior with:
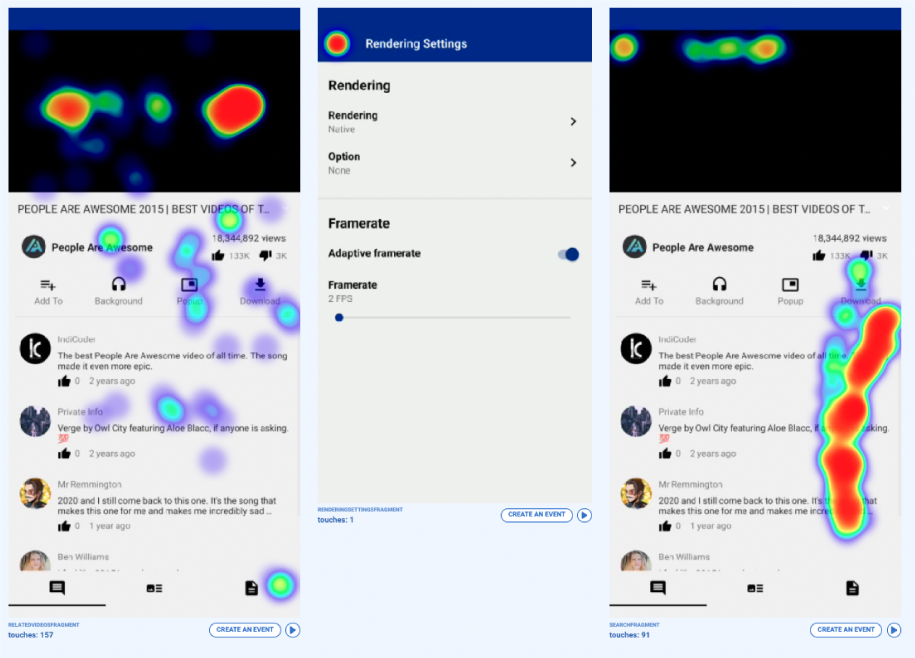
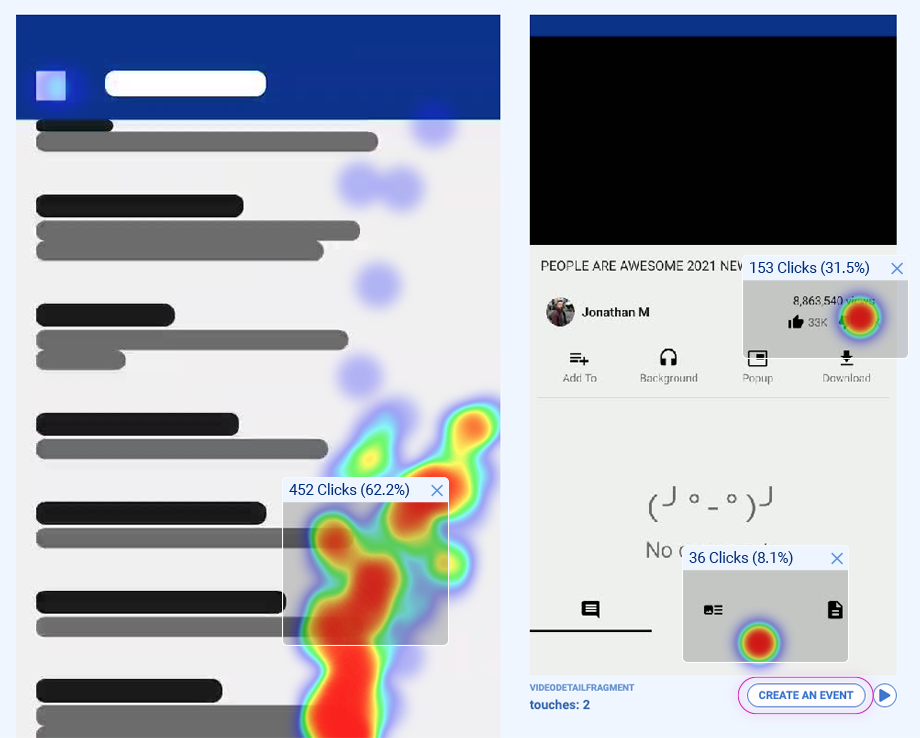
- Heatmaps, which show you where users click (or tap), scroll, or move their cursor. They’re easy to create and interpret, making them a great starting point for analyzing user behavior. If you’re looking for an easy entry into mobile analytics, learn more about the use cases for mobile app heatmaps.
- Event tracking, which lets you monitor specific user interactions like button clicks, text inputs, and page visits. Tools like Smartlook offer several ways for you to track these interactions without coding, such as selecting from a list of standard events or even turning a hot spot on a mobile heatmap into an event.
- Funnel analysis, which we discussed earlier.
You can learn more about these and other useful analytics features in our guide to tracking user activity on websites.
Tracking user behavior on a mobile app requires a little more effort in the setup phase.
Mobile analytics tools have to be integrated into the app’s code with a software development kit (SDK) by an experienced developer.
For example, Smartlook has SDKs for 9 popular platforms, frameworks, and engines: Android, iOS, React Native, Flutter, Cordova, Ionic, Xamarin, Unity, and Unreal Engine.
Once the correct SDK is integrated, Smartlook starts recording all user sessions on the mobile app. From here, you can watch session recordings and utilize other analytics features, like:
- Custom events, which let you track pretty much anything you want outside of standard events like button taps or navigation between screens. Custom events usually have to be created via JavaScript. However, they give you immense flexibility in analyzing user behavior.
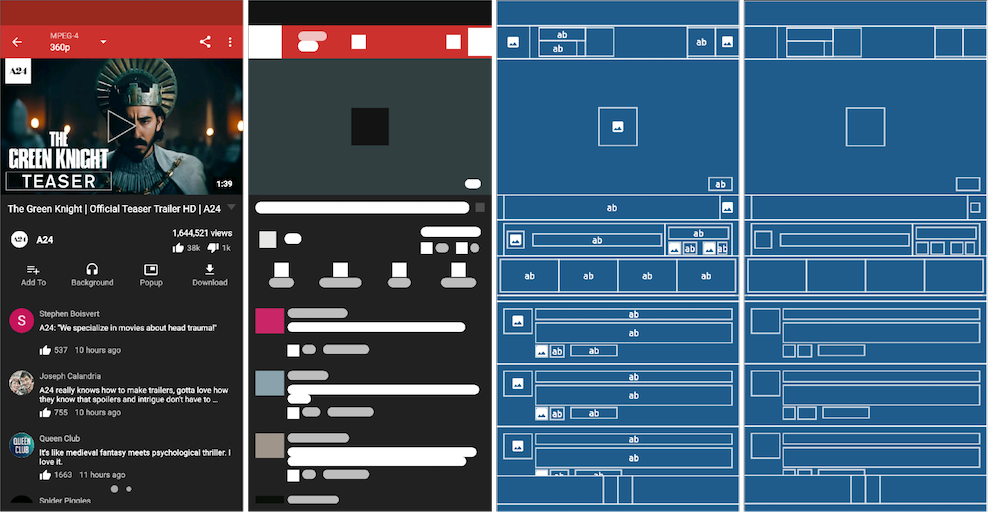
- Wireframe rendering modes, which let you record users’ sessions without affecting their experience and endangering their personal data. Instead of recording the UI as users see it, these rendering modes draw a representation of the content on a screen. This is much less taxing on users’ devices and is also a great way to protect their personal data since none of it ever gets captured.
- Retention tables, which we already discussed.
To learn more, check out our in-depth guide to mobile app tracking.
Analyze and improve your conversion rates, revenue, and retention with Smartlook
Smartlook gives you robust analytics that show what your users are doing — paired with session recordings and heatmaps that show why — all in one place.
Our platform can be used on:
- Websites and web apps, including ones built with popular CMSs like WordPress, Joomla, and Shopify.
- Mobile apps built with popular native mobile app platforms, frameworks, and engines, including iOS, Android, React Native, Flutter, Unity, and Unreal Engine.
Smartlook also has integrations with A/B testing platforms, like Google Optimize and Optimizely, traditional analytics solutions, like Google Analytics and Mixpanel, and other widely-used tools, like Slack, Zendesk, Salesforce, and many more.
If you don’t want to spend time setting up Smartlook, you can see it in action by booking a free demo here. Оur team will give you a detailed Smartlook presentation that’s tailored to your business at a convenient time for you.
You can also try Smartlook with a full-featured, 30-day trial (no credit card required).