Google Analytics (GA) and Hotjar are two of the most popular web analytics tools.
While both can help you analyze user behavior on your website, they do so in very different ways. In fact, many organizations use them together to get a complete picture of their site’s performance.
In this article, we’re going to break down the differences between GA and Hotjar and discuss what insights you can get with each tool.
We’ll also explore situations where Smartlook — our combined product analytics and visual user insights platform — can be a great addition or alternative to both GA and Hotjar.
Before we dive into the details, let’s quickly cover the key differences between GA, Hotjar, and Smartlook:
- GA is a free quantitative analytics tool that provides detailed stats and metrics about your website’s traffic. GA’s reports are useful for understanding who your users are (their devices, countries, gender, etc.), which sources drove them to your site, and which pages they visit. However, due to the lack of qualitative data, GA can’t tell you why users do what they do or what issues they’re facing.
- Hotjar is a behavior analytics tool with a focus on qualitative analytics. Hotjar’s session recordings (also called session replay or visitor recordings), surveys, and feedback widgets let you watch the journeys of individual users and ask them questions. This makes Hotjar a popular complementary tool for teams looking to go beyond GA’s raw numbers. In fact, Hotjar usually must be used in combination with a traditional analytics tool like GA, due to its limited quantitative capabilities.
- Smartlook combines both quantitative and qualitative analytics so you can track what your visitors do and uncover why they do it. Smartlook gives you a high-level overview of your site’s traffic (users’ devices, countries, browsers, etc.), lets you monitor key user actions and flows, and helps you drill down into the journeys of individual visitors via session recordings. Smartlook is also available for websites and native mobile apps, while GA and Hotjar can only be used on websites.
In the next sections, we’ll explore GA, Hotjar, and Smartlook in more detail, so you can get a better idea of what you can do with each tool.
Smartlook captures every user interaction on your website or mobile app and lets you watch session recordings, define events, build funnels, create heatmaps, and much more. Try it for free with our full-featured 30-day trial (no credit card required) or book a demo with our team to see how Smartlook can benefit your business specifically.
The differences in how Google Analytics and Hotjar work (& how Smartlook combines the best of both worlds)
GA and Hotjar have a similar setup — you create an account and install a JavaScript code snippet (with a few more miscellaneous steps in GA). After that, they start collecting data about your website’s visitors.
However, the types of data they gather are very different.
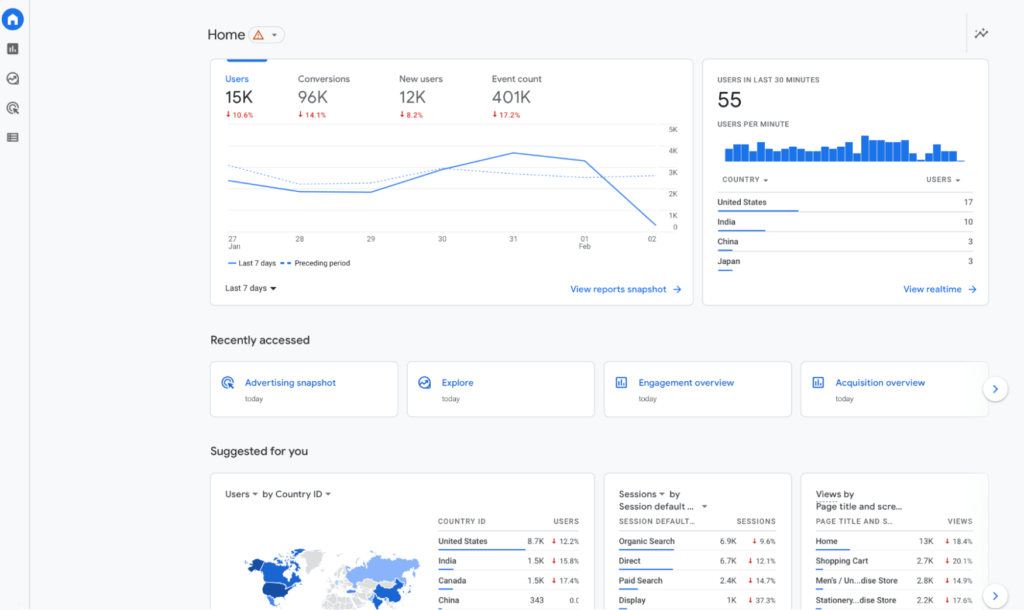
GA focuses on aggregate, anonymized, quantitative data about your site’s visitors.
This data is ideal for understanding who your visitors are, how they got to your site, and which pages they visit. GA organizes some of these data points into dashboards and reports. However, you can also use GA’s customization capabilities to segment your reports, visualize data in different ways, build funnels, and much more.
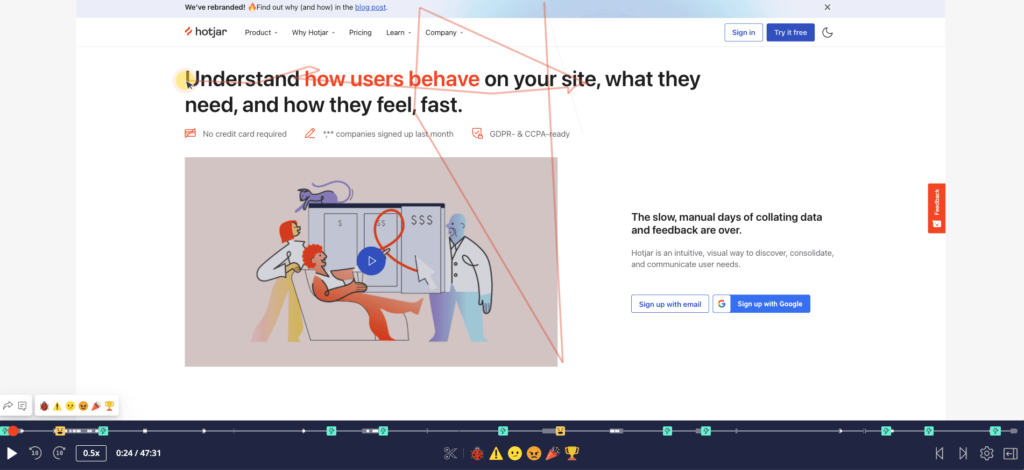
Hotjar is primarily a qualitative analytics tool.
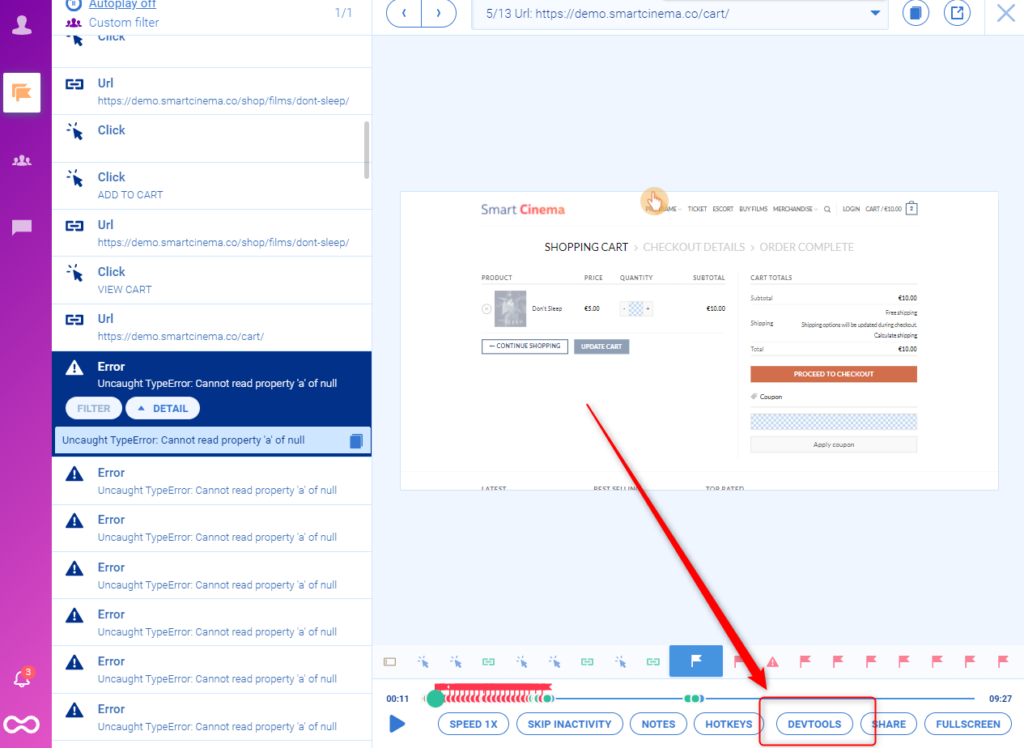
Instead of providing detailed reports and tools for analyzing numerical data, Hotjar relies on session recordings (shown in the screenshot below), heatmaps, and surveys to gather qualitative data. This helps you get a more nuanced view of your customers’ experience compared to GA.
Now, Hotjar does collect some basic stats and metrics about websites, such as the most visited pages, bounce rates, and average session duration. However, these can’t match GA’s breadth and depth of quantitative capabilities.
For example, Hotjar doesn’t have a funnel analysis feature, so you can’t use it to monitor how users navigate important flows such as checkouts or onboarding tutorials. These limitations often force teams to look for alternatives to Hotjar or use it only as a complementary tool in their analytics stack.
As you can see, GA and Hotjar are fundamentally different, which is why they’re often used together. GA provides information about who your visitors are and what they do, while Hotjar tries to capture the “why” behind their actions — why they bounce from certain pages, why they don’t convert, etc.
Due to their limitations, neither one alone can give you the full story behind your users’ experience. This is where Smartlook comes in.
Smartlook is our product analytics and visual user insights platform that combines four key quantitative and qualitative analytics features:
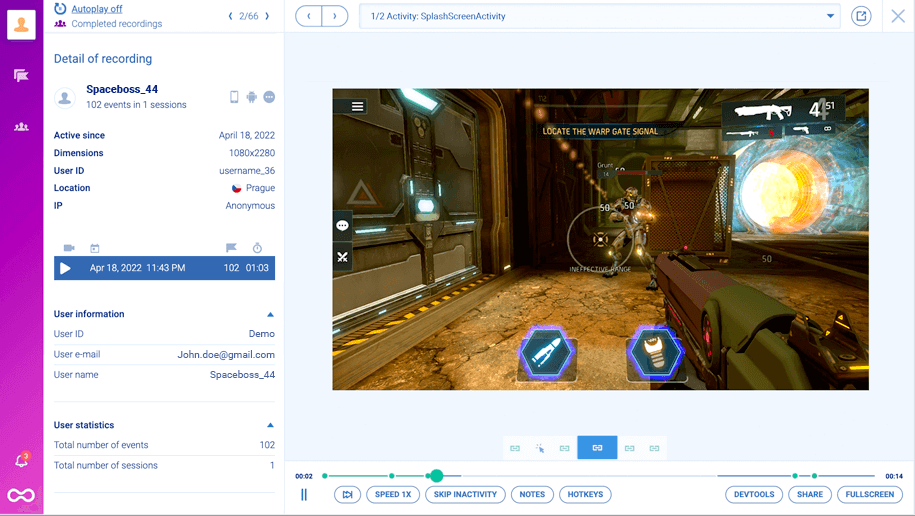
1. Session recordings. Similar to Hotjar, Smartlook captures every user session on your website or mobile app by default. You can watch how individual users navigate your site or app, which is invaluable for fixing bugs faster, uncovering why users do what they do, and much more.
For more information, refer to our guide: How to record website visitors: Practical tips, tools & examples
2. Events. Smartlook automatically indexes every user interaction, including pageviews, button clicks, and text inputs. This functionality lets you track key actions as events without coding or needing a third-party tool, as we’ll discuss in the next section.
3. Funnels. Funnels allow you to analyze how users navigate important flows (like checkouts) and calculate conversion rates. Since Smartlook also has session recordings, you can zero in on the sessions of users who dropped off between specific steps and see what’s hurting your conversions.
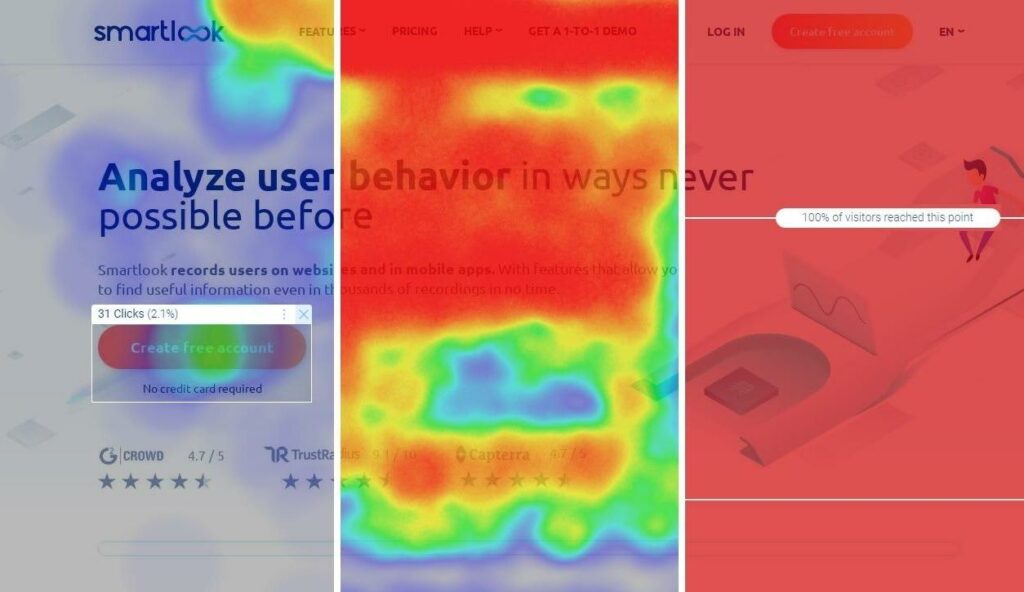
4. Heatmaps. Heatmaps show you an overview of a typical user’s behavior on a page or screen. Smartlook supports the three main types of heatmaps that Hotjar also offers — click maps (left in the screenshot below), move maps (middle), and scroll maps (right).
For a practical introduction to heatmaps, refer to our guide: How to read a heatmap and get actionable UX insights
In short, Smartlook combines quantitative and qualitative analytics capabilities, so you can:
- Track important stats and metrics, like your users’ devices, countries, the pages they visit, the actions they take on your site, the conversion rates for certain flows, and more.
- Automatically record the journeys of all individual users.
- Find out why they do what they do.
In the next sections, we’ll look at three use cases where Smartlook can collect crucial quantitative data (like GA), while also providing key qualitative insights (like Hotjar).
Use case #1: Track events without coding or using a third-party tool
Tracking specific actions (i.e., events) lets you quantify user behavior and answer important questions like:
- Which navigation links do users click the most?
- How often do visitors click on the “Add to Cart” button?
- How many times was each call-to-action (CTA) on the homepage clicked during a marketing campaign?
Hotjar and GA both have event tracking capabilities, but those come with a few issues:
- The event tracking setup in GA often requires programming skills or the use of an extra tool — Google Tag Manager (GTM) — that has its own setup and learning curve.
- With Hotjar, you either have to write custom JavaScript code to track events or send the events you’re already tracking in GA, GTM, or Segment. Again, this makes the process more time-consuming and reliant on developer assistance.
In contrast, Smartlook removes the most tedious parts of the event tracking setup by:
- Indexing user interactions automatically (via its always-on session recordings).
- Letting you track events retroactively without coding.
This means you don’t need to write any code or use a third-party tool like GTM.
Instead, you only have to select which interactions appear in your dashboard as events — a process we call “defining an event”. For example, you can define events by simply clicking on your site’s UI, as shown in the screenshot below:
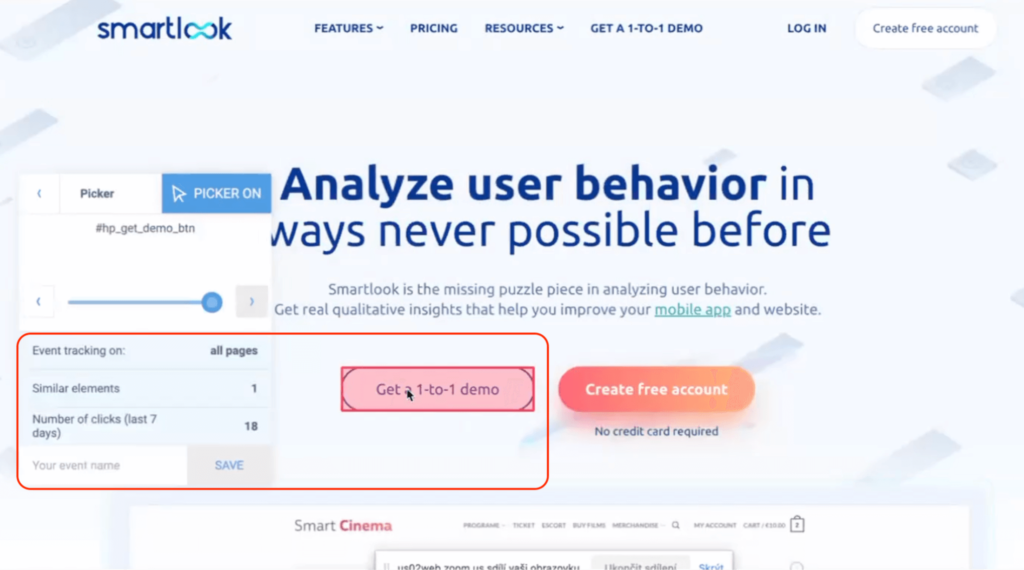
Because the interaction data is already collected, you can see the number of clicks just by hovering over each element.
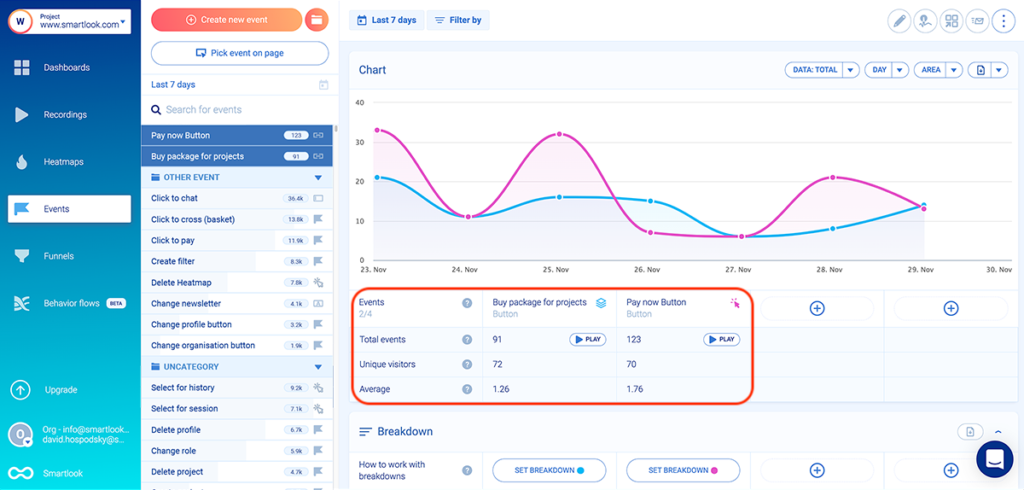
You can also combine Smartlook’s event tracking with session recordings.
For example, the screenshot below shows two click events. The little “Play” button under each one takes you straight to all sessions where it occurred.
This capability lets you watch the full context behind certain events, i.e., what users did before and after triggering them.
Plus, it’s a much faster way to find relevant sessions than watching hours of random videos. Smartlook also starts the session replay video five seconds before the event takes place, so you don’t have to sit through the entire session.
Use case #2: Analyze how users navigate your most important flows and find out why they don’t convert
One of the most important uses for events is building funnels. Funnels are sequences of steps (i.e., events) users take to complete a goal, like:
- Buying a product.
- Signing up for your newsletter.
- Completing an onboarding tutorial, and so on.
Hotjar retired their Forms and Funnels feature back in 2020. This actually prompted StoragePug to switch to Smartlook.

GA still has a funnel exploration tool, but due to its lack of qualitative insights, you can only use it to see where users drop off, not why. This makes it very difficult to find and fix the issues that are hurting your conversions.
For example, the conversion funnel from GA shown below tells you that 23% of the users who added an item to their cart completed their purchase.
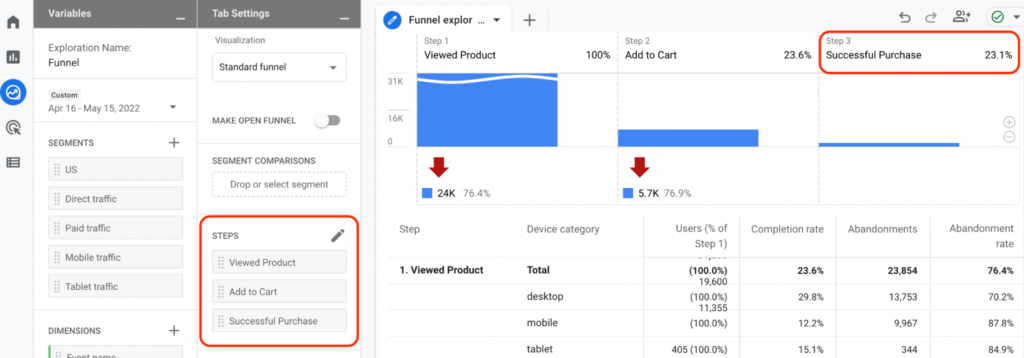
If you wanted to see why the other 77% didn’t convert, you’d need another tool. You can use Hotjar to filter the recordings of all users who viewed a product or added an item to their cart. However, that still leaves you with lots of unnecessary recordings, because you can’t filter only the sessions of users who dropped off.
You can avoid this problem by combining Smartlook’s funnel analysis capabilities with its session recordings.
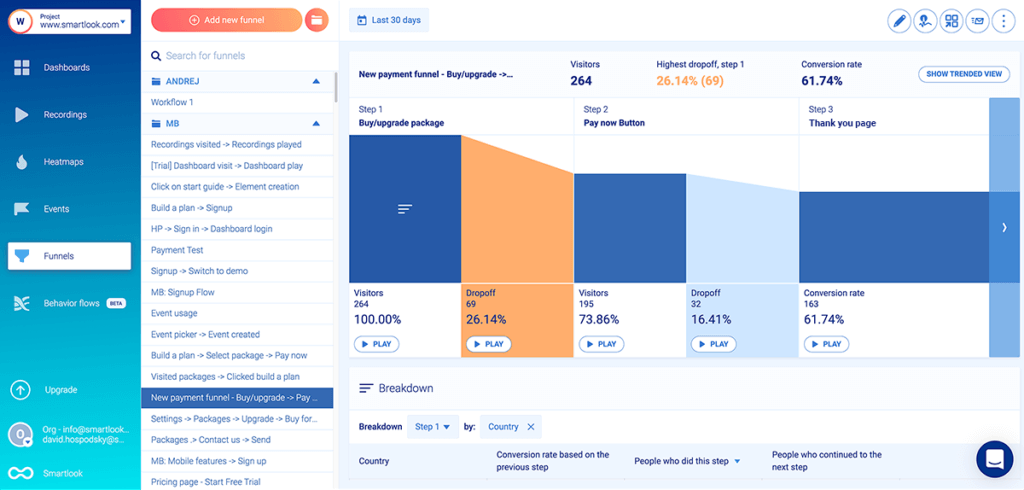
First, you can build any funnel by simply placing events in the order you believe your users follow. For example, an e-commerce store may want to monitor the checkout process with a funnel, as shown in the screenshot below:
This three-step funnel can be built without any coding:
- Step (Event) 1: Users click on the button for buying a package. (You can select the button with our no-code event picker.)
- Step (Event) 2: They click on “Pay now” (Again, use the no-code event picker.)
- Step (Event) 3: They arrive on the “Thank you” page (Use the “Visited URL” standard event and enter the page URL.)
As you can see, there’s a “Play” button under each step, including the drop-offs. This lets you narrow down hundreds or thousands of sessions to a few guaranteed to show a point of friction in your checkout.
In fact, AstroPay — a fintech company and Smartlook customer — used this exact combination of features to improve conversions for one of their key flows by 56%.
Use case #3: Help different teams gather crucial behavioral insights
Smartlook’s combination of session recordings and no-code event tracking opens tons of opportunities for different teams.
For example:
- Marketing teams can analyze the effectiveness of copy and design changes without needing constant developer assistance. Let’s say your marketing team tries to boost conversions by changing a landing page’s above-the-fold copy and button placement. With Smartlook, they can set up an event to track each click on the CTA and understand how their changes affect user behavior.
- User experience (UX) teams can filter session recordings based on a specific event and see what users do before and after triggering it. They can also watch the entire customer journey, from the moment users open your site or app to the moment they close it.
- Product teams can automatically collect all user interactions in the product with a single snippet, which makes the product analytics process much easier. They can also use session recordings to show UX issues and back up their suggestions for improving the product experience, instead of relying only on hard-to-understand dashboards with quantitative data.
- Customer support teams can watch session recordings to easily understand problems reported by users. They can use our Identify API to locate sessions using an identifier, such as the user’s email or username. As a result, when an identified user reports a bug, the support team can see exactly what went wrong, without guessing or nagging the user for an explanation.
- Development teams can watch session recordings to see the exact situations in which bugs occurred, which drastically simplifies bug reproduction. Developers can often skip reproduction altogether by using the session recordings plus the data sent in the background (available by clicking on the “DevTools” button).
Google Analytics vs Hotjar vs Smartlook: Each tool’s unique capabilities
GA, Hotjar, and Smartlook all bring unique capabilities to the table. In this section, we’re going to explore how each tool stands out from the other two and how that impacts the type of insights you can get.
Google Analytics: Free tool with advanced quantitative analytics features
It’s no secret that GA has an insurmountable advantage over most website analytics tools — it’s completely free.
GA also automatically collects lots of useful data about your website’s visitors and organizes it into convenient reports. For example, the Acquisition report gives you an in-depth view of your visitors, with a focus on how they got to your site.
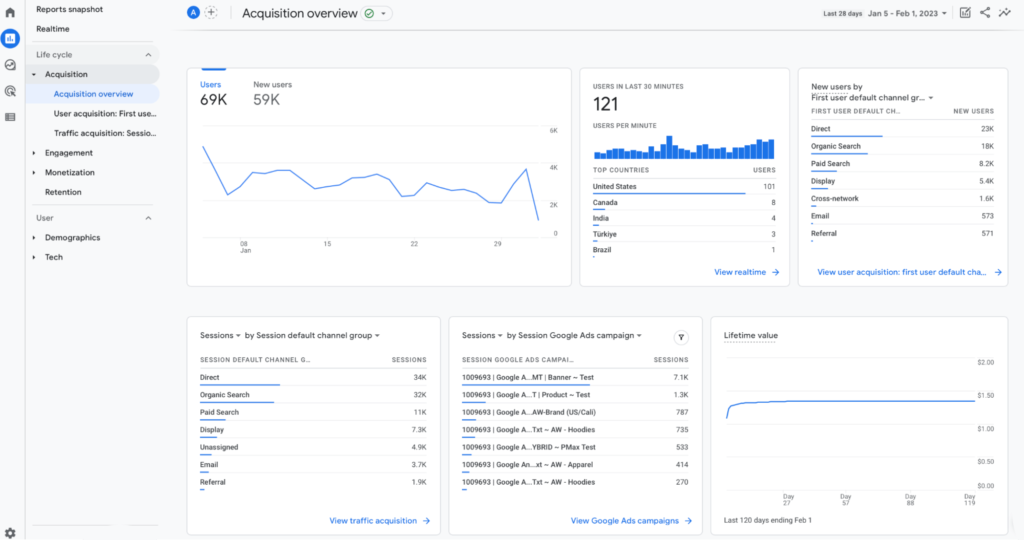
This information can be valuable for marketing teams when planning campaigns and analyzing results. The same goes for the Engagement, Monetization, and Retention reports — they can be super useful, provided you take the time to learn how they work.
Put simply, GA’s quantitative analytics capabilities are unmatched by both Hotjar and Smartlook (as well as many other analytics software tools). This, alongside its native integration with Google Ads and the fact that it’s free, makes GA the default option for website analytics.
It’s also worth noting that in July 2023, all GA users will automatically be required to use a new version (GA4) as the older one (Universal Analytics) will stop processing data. However, this transition has so far been rocky.
GA4’s new UI and features have further increased its already steep learning curve. Plus, there are complaints about GA4’s limited data visualization capabilities and missing reports. This has caused lots of organizations to look for an alternative to GA.
Hotjar: Surveys, feedback widgets, and user interviews
Compared to GA and Smartlook, Hotjar’s biggest advantage is in collecting user feedback. Hotjar actually has two separate products for this:
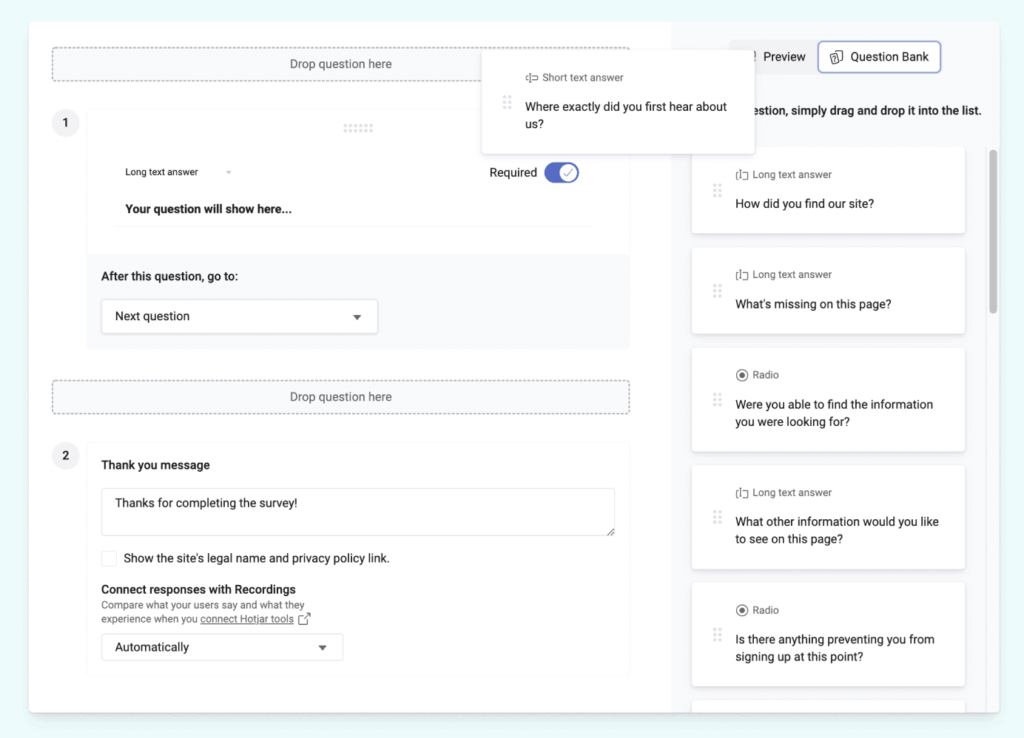
- Ask, which lets you create surveys with different question types or use real-time feedback widgets. For example, you can create a pop-up to ask users how they feel about the experience on a certain website page. Or, you can build more elaborate surveys with open-ended questions to gather more details.
- Engage, which helps you interview users and automates admin tasks like interview recruitment and scheduling. This tool, which is still in beta, became a part of Hotjar’s stack after their acquisition of PingPong — a user testing and interview platform.
Hotjar’s ability to gather feedback through surveys, widgets, or interviews can surface useful insights for product, marketing, and UX teams.
Smartlook: A combination of quantitative analytics and qualitative insights, extensive integrations, and mobile app compatibility
With Smartlook, you’re not choosing between quantitative and qualitative analytics. Instead, you get both in one convenient place, so you can:
- Save time and effort from constantly switching between different tools.
- Track specific user actions and build event-based funnels without coding.
- Monitor aggregate stats and metrics or zero in on the sessions of individual users. For example, say you build a funnel to monitor your checkout process and notice that its conversion rate drops significantly in one day. You can quickly jump into the sessions of users who dropped off during that day to see the reason (e.g., a broken checkout button or another technical issue).
If you’re curious, you can learn more about Smartlook’s key features in these resources:
- Our guide to tracking user activity on websites.
- Our article on implementing mobile app tracking and analyzing user behavior.
Smartlook can also be used on websites and native mobile apps, unlike GA and Hotjar, which can’t be used on mobile apps.
Our platform is currently compatible with Android, iOS, React Native, Flutter, Cordova, Ionic, Xamarin, and Unity apps. We even support cross-platform analytics — the process of tracking the behavior of users as they move between website browsers and native mobile apps.
Lastly, Smartlook’s extensive integrations let you easily incorporate it into your workflow. Here are three of our most popular integrations for digital marketers, product managers, and UX professionals:
- Google Analytics: GA is a powerful and free tool, so we’re not trying to discourage anyone from using it. In fact, this integration helps you take full advantage of both GA and Smartlook’s strengths. You can use GA to analyze your website’s traffic, then play the relevant Smartlook session recordings right from your GA dashboard.
- Survicate: Survicate is a user feedback product, similar to Hotjar’s Ask tool, but with more versatile capabilities. With this integration, you can jump straight into the Smartlook session recordings of users who gave a specific answer to a survey question. For example, you can watch the sessions of all users who answered “No” to a question like “Was your checkout experience good?” to see what went wrong.
- Optimizely: Optimizely is a powerful experimentation platform. By integrating Optimizely with Smartlook, you can watch how users interact with each variant you’re testing. As we explained in our article on the top 10 A/B testing tools, this is crucial for validating the accuracy of your tests.
Google Analytics vs Hotjar vs Smartlook: Pricing comparison
As we said, GA is a free tool. However, there’s an enterprise version that costs $150,000/year for Universal Analytics (the old GA) and around $50,000 for GA4 (the new GA). You can read more about this enterprise analytics platform and its pricing in this article.
This premium version is only for enterprises and the vast majority of GA users rely on the free version instead. That’s why we’ll focus our pricing comparison only on Hotjar and Smartlook.
Hotjar’s pricing
Hotjar offers different pricing plans, depending on the tools you want to use.
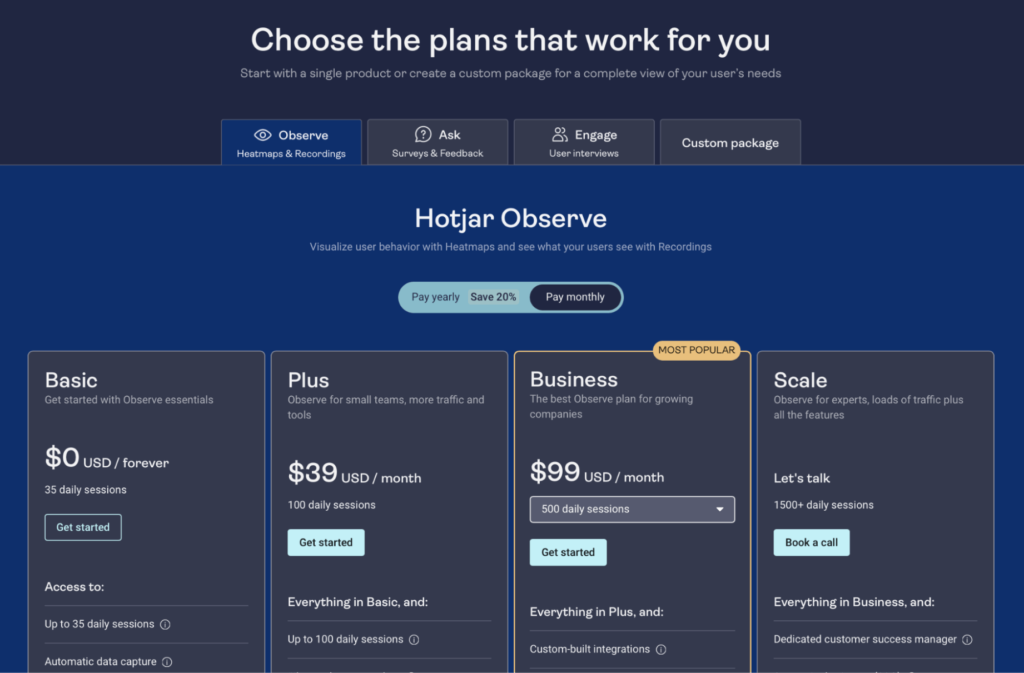
- Observe, the session recording and heatmap tool, starts at $39/month for websites with up to 100 daily user sessions (or around 3,000 sessions/month).
- Ask, the survey and real-time feedback tool, starts at $59/month for up to 250 monthly responses.
- Engage, the user interview tool, starts at $90/month for up to five monthly user interviews with one observer. Again, note that this tool is still in beta, so its features and pricing may change.
Each of these tools has a free plan that you can use without a time limit. For example, the Observe product’s free plan lets you capture up to 35 daily user sessions (or around 1,000 sessions/month).
Additionally, you can build a custom plan, depending on how many daily sessions (for Observe) or monthly responses (for Ask) you need.
Smartlook’s pricing
Smartlook takes a simpler approach to pricing than Hotjar, with a free plan, one preset paid plan, and an option to build a fully tailored enterprise plan.
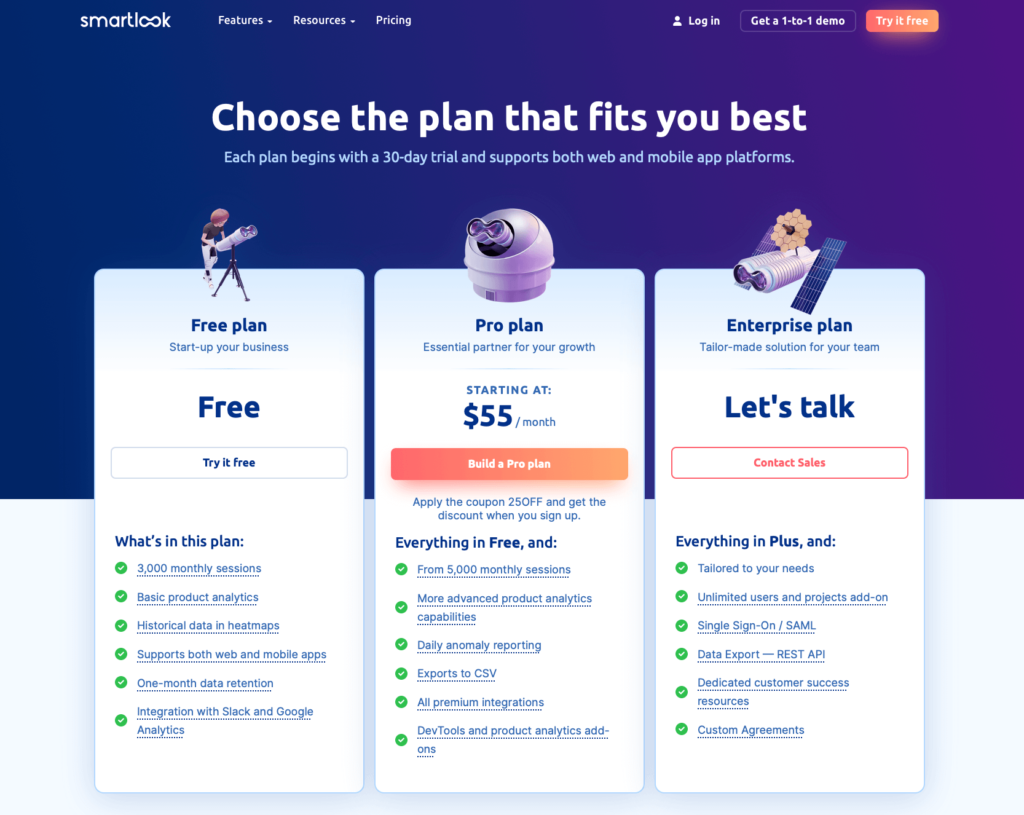
The Free Plan (available without a time limit or credit card) captures up to 3,000 monthly sessions on your website or mobile app. It comes with all of Smartlook’s core features — heatmaps, session recordings, events, and funnels — and supports integrations with tools like GA, Slack, and Salesforce.
The Pro Plan starts at $55/month and captures 5,000 monthly user sessions. You can also customize it to your needs by selecting a different session limit.
Besides recording more sessions, this plan offers additional heatmaps, events, funnels, more integrations with tools like Mixpanel and Jira, and advanced features like our DevTools and Session Vault.
Improve your website or mobile app’s UX, conversions, and revenue with Smartlook
Smartlook gives you robust analytics that show what your users are doing — paired with session recordings and heatmaps that show why — all in one place.
If you already use Google Analytics, you can easily integrate Smartlook and get the context needed to understand your users’ behavior.
Many teams also find that Smartlook comes with the quantitative analytics features they were missing in Hotjar, while the session recordings and heatmaps provide the qualitative insights that GA lacks.
If you want to see how Smartlook can benefit your business, schedule a 1-on-1 demo with our team. We’ll give you a detailed presentation of our platform that’s tailored to your use cases and business needs.
Lastly, you can try Smartlook yourself with a free full-featured 30-day trial (no credit card required).