App experience analytics is the process of collecting and analyzing data on how users interact with your app — the features they use, the flows they go through, the problems they encounter, and so on.
The goal of this process is to get a clear, detailed view of your users’ actual experience, so you can improve your app’s UX, retention, and revenue by:
- Boosting user engagement.
- Finding and removing points of friction.
- Optimizing each part of the user journey.
However, achieving this goal requires more than just tracking metrics like active users, retention, or churn.
While these metrics do a good job of indicating your app’s performance at a high level, the app experience analytics process is about diving deeper into individual user journeys and gathering subjective insights about users’ wants, needs, and pain points. This process requires the collection of a lot more (and different types of) usage data.
This article will guide you through everything you need to know about app experience analytics, including the features and capabilities you need to collect and analyze usage data.
Here’s what we’ll cover below:
- Session recordings: Watch how users interact with your app
- Heatmaps: See the typical user behavior on an app screen
- Events: Monitor business-critical user actions
- Funnels: Analyze how users navigate key flows
- Crash reports: Understand when and why app crashes occur
Smartlook can help you analyze and improve your app’s UX, conversions, retention, and revenue. Book a free demo with our team to see how Smartlook can benefit your business or try it yourself with a full-featured, 30-day trial (no credit card required).
How does app experience analytics work?
App experience analytics (sometimes called digital experience analytics) is a multi-step process that relies on accurate product usage data. This data shows you how end users interact with your app — where they click, which features they use, how they navigate the onboarding flow, and so on.
The more of this data you collect, the better you can understand your users’ experience (provided you know how to analyze it).
However, the volume of data isn’t the only relevant factor. You also need to collect two different types of data to get an accurate representation of users’ journeys and experiences:
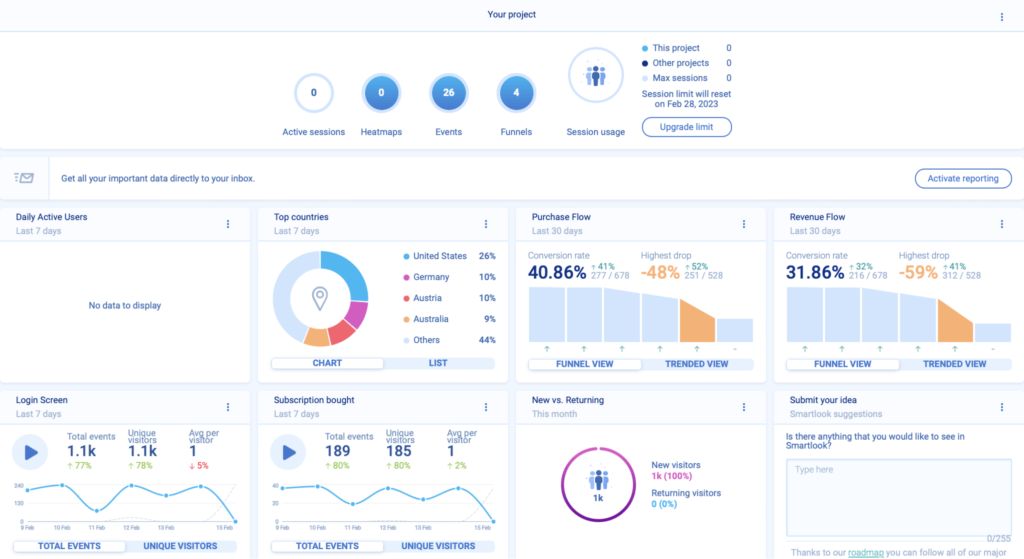
1. Quantitative data, which is a numerical measurement of what’s happening in your app. You can use it to quantify user behavior and answer questions like:
- How often do users from this segment log into the app?
- What’s the conversion rate for our checkout?
- How many subscriptions did we sell in Q3?
This data is usually displayed in charts, reports, and dashboards, like the Smartlook dashboard shown below:
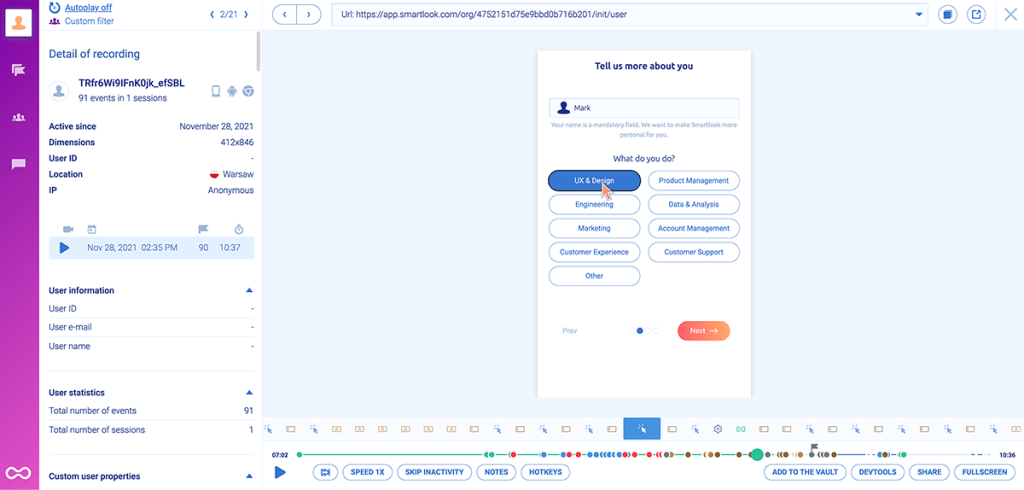
2. Qualitative data, which is rich in context and detail about the behaviors, pain points, and needs of individual users.
This makes it ideal for understanding why users do what they do, e.g., why they purchased a specific product or why they don’t convert after adding an item to their cart.
Qualitative data is usually collected via session recordings (shown below) and surveys.
Today, there are tons of product analytics tools that can help you gather and analyze both types of app experience data.
Modern solutions like Smartlook make the process simple by automatically recording all user sessions and interactions in your app. This auto-capture method prevents you from having to accurately predict each interaction you’ll need to track in advance because all the interaction data is collected by default.
More traditional analytics solutions like Amplitude and Mixpanel rely on a manual event tracking setup. This means you need to define which user interactions (events) you want to track and set up the tracking for each one individually.
Both methods can help you gather the app usage data you need, but the manual method requires more time, effort, and technical skills compared to auto-capturing.
We’ve discussed this in more detail in our product analytics guide.
5 essential features of an app experience analytics tool
In this section, we’ll show you five essential capabilities that you need for the app experience analytics process. We’ll also use real-life examples to demonstrate how each one can benefit various teams inside your organization.
Note: We’ll be using Smartlook— our product analytics and visual user insights platform — to demonstrate how these tools work. However, if you’re interested in learning about other solutions, check out our article on the top free and paid mobile app analytics tools.
#1. Session recordings: Watch how users interact with your app
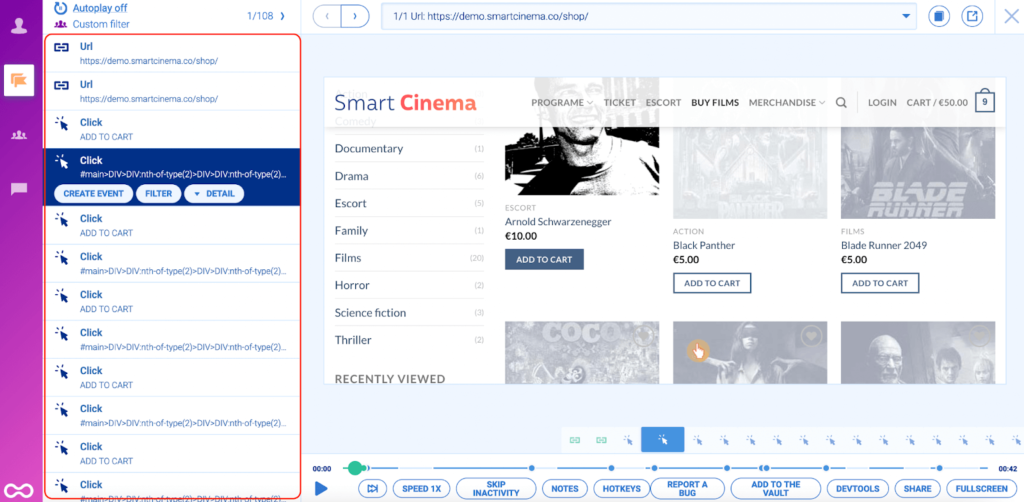
Session recordings (also called session replays or session playback) are visual representations of users’ sessions in your app. They show you everything a user does during their session — which features they use, which app screens they open, where they get confused, and so on.
For example, check out the screenshot below:
On the right, there’s the actual session replay video of a user navigating a checkout flow. On the left, you can see useful details like the user’s device, location, and other sessions. Finally, there’s a timeline containing all user actions under the session recording.
Here’s how session recordings, along with the additional data they capture, can be helpful for different teams:
- Product teams canuse session recordings to show others exactly what’s going on with the product and communicate their findings, vision, and strategy. This is a huge improvement over traditional dashboards filled with stats, metrics, and key performance indicators (KPIs) which aren’t intuitive for most people.
- Marketers can watch how customers use the product, instead of focusing only on what brought them to it (i.e., attribution). This can give them ideas for which features and benefits to highlight in their campaigns.
- UX designers and researchers can see how users interact with the app in the wild, instead of relying solely on interviews, usability testing, and surveys for user research.
- Customer support teams can watch how bugs and other issues occurred, instead of relying on users’ explanations (which are often inaccurate). Hookle’s support team even uses session recordings to provide proactive customer service when they see users struggling.
CricHeroes — the largest network for cricket players in the world — is a great example of a company that uses session recordings to improve user engagement and retention rates.
For example, they used session recordings to uncover new points along the customer journey where users were likely to contact other users. They added extra nudges at these points, which resulted in an 11% increase in the number of messages sent by users.
They also use session recordings for a host of other tasks, such as analyzing how users navigate certain screens or uncovering where they get stuck.

For more details on their approach and results, check out our CricHeroes case study.
#2. Heatmaps: See the typical user behavior on an app screen
Heatmaps show you how most users navigate a page or app screen, including where they click, how far down they scroll, and where they move their cursor.
Smartlook, like most other heatmap software tools, supports three types of heatmaps: click maps (left in the screenshot below), move maps (middle), and scroll maps (right).
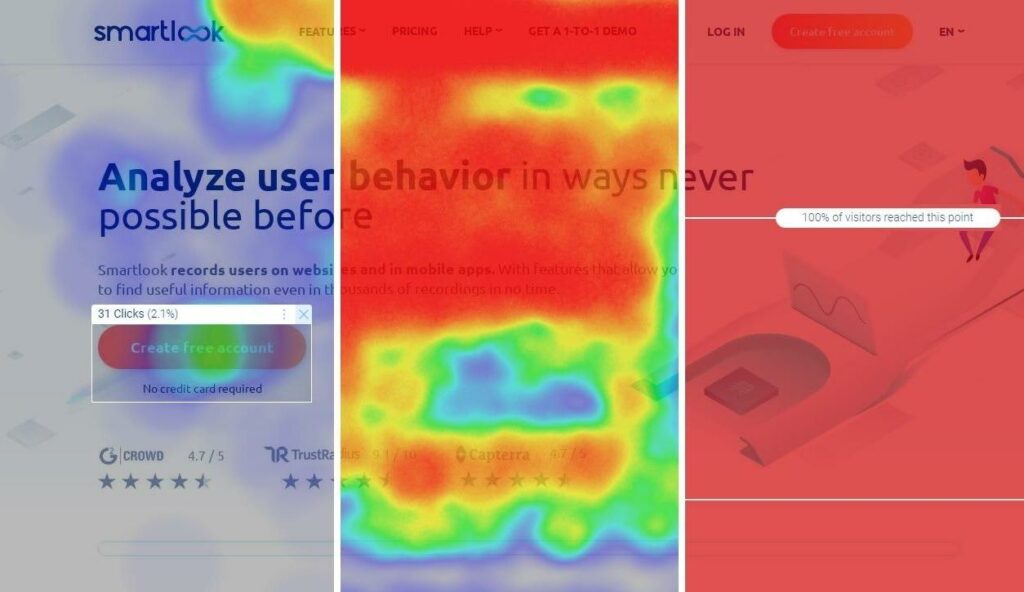
- Click maps show where users click (or tap on mobile) and how often they interact with call-to-action (CTA) elements.
- Move maps show where users move their cursors while navigating a page.
- Scroll maps show what percentage of users reach each part of a page.
Because they’re so easy to create and read, heatmaps are a great starting point for analyzing user behavior. For example, you can use a scroll map to quickly see which elements on a screen most users see without scrolling. This can help you determine if you should move important buttons or copy higher up so that more people see them.
Sewio actually used heatmaps to find a few key issues on their homepage:
- The buttons in the hero section were actually below the fold for some visitors.
- Almost no one clicked on the client logos that led to customer success stories.
- There was a big visitor drop-off in one section on the page, indicating that people didn’t find it useful or interesting.
Once they implemented changes based on these findings, Sewio’s team saw a 276% boost in clickthrough rate for their “Go to store” button and a 3x increase in clicks to their customer success stories.
Learn more about heatmaps in our guide: How to read a heatmap and get actionable UX insights
#3. Events: Monitor business-critical user actions
Events are user actions like button clicks, text inputs, or pageviews.
Tracking these events lets you quantify user behavior and monitor the occurrence of business-critical interactions. For example, you can use events to see:
- How many clicks each feature button gets.
- How often people tap on the “Add to cart” button.
- Which buttons on your app’s homescreen people tap on most often.
With Smartlook, you can track many events without any coding, since the user interaction data is collected automatically. All you have to do is decide which interactions appear as events in your dashboard — a process called “defining an event.”
We’ve created three ways to define events without coding:
1. Use our no-code event picker. This method lets you define an event by clicking on elements in your app’s UI.
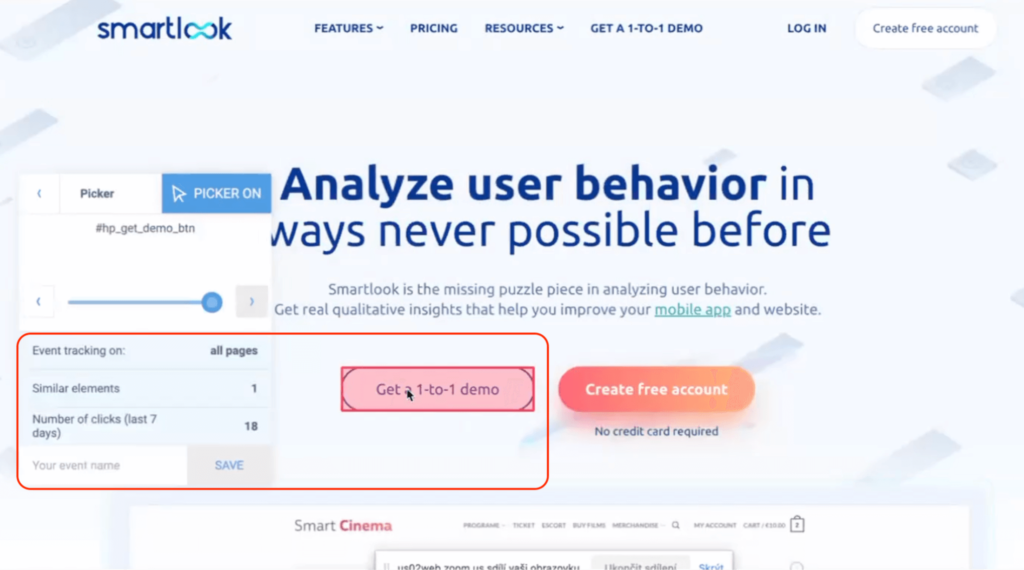
2. Choose from a template list of standard events, including clicked on URL, clicked on text, typed text, clicked-on CSS selector (allowing you to select any element on the page).
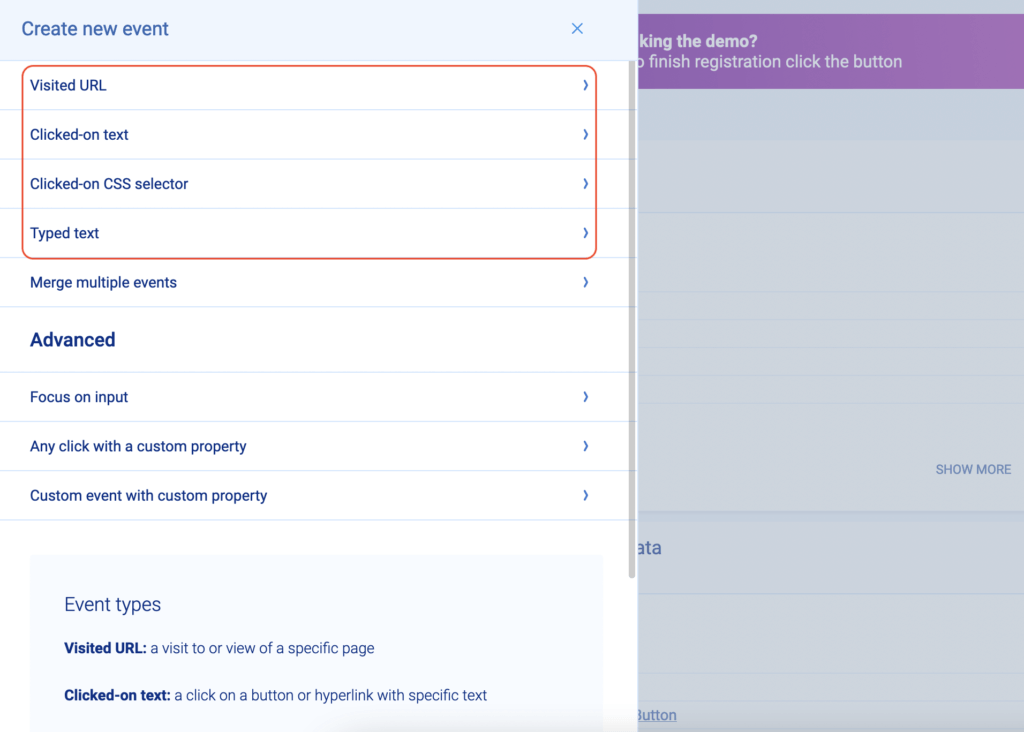
3. Define an event from a recording. Oftentimes, you may notice an action you’d like to track while watching a recording. You can pause the recording, click on the “Session events” tab, and easily turn that action into an event.
You can also define custom events via JavaScript to track pretty much any other activities in your app.
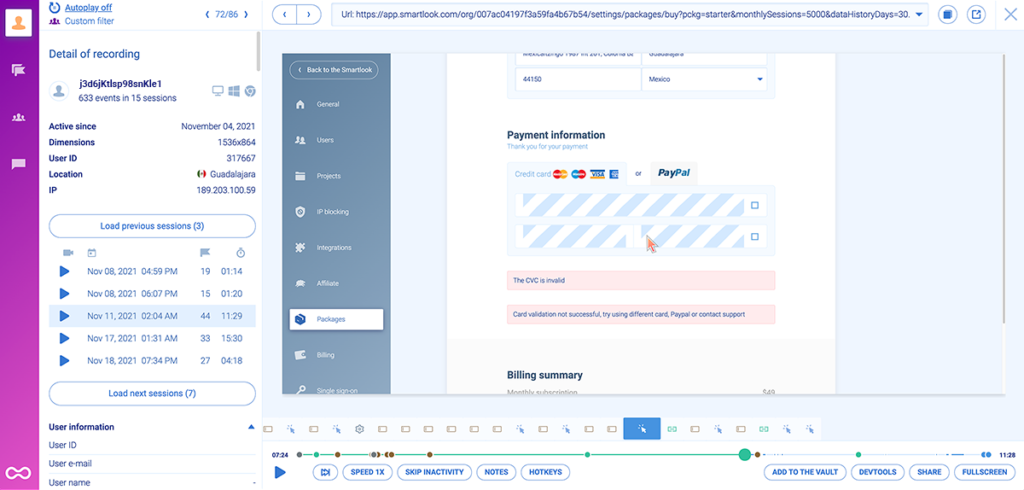
Additionally, Smartlook lets you combine the power of event tracking and session recordings. For example, the screenshot below shows two events being tracked on the same screen.
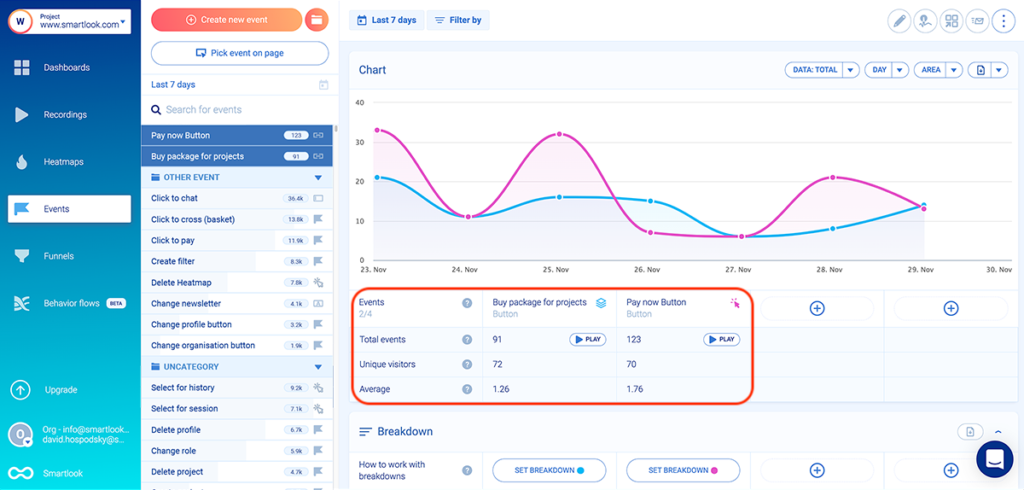
You can click the “Play” button under each event to jump straight into all the sessions where it was triggered. This lets you watch the full context behind each event, i.e., what users did before and after triggering it.
Disivo — an app that automates product pricing for e-commerce stores — uses events to understand how users interact with their product and where they struggle. They also combine events and session recordings to:
- Quickly find the relevant session recordings with event-based filters.
- Jump straight into the part of each session where certain events were triggered.

#4. Funnels: Analyze how users navigate key flows
Most applications have a few critical flows — sequences of steps that users take to complete a goal — that are closely tied to revenue. Analyzing how users navigate through these flows is essential to understanding their experience and improving the app’s performance.
This is where funnel analysis comes in.
Funnel analysis is the process of mapping out these flows, so you can see how many users complete each step and where they get stuck.
With Smartlook, you can create all kinds of funnels by simply placing two or more events in the order you believe your users follow. The funnel visualization will then appear instantly, as shown in the GIF below.
For example, you can map each step of your onboarding sequence to an event and build an onboarding funnel. This will show you points of friction in your onboarding, which may be hurting your activation and retention rates.
Or, you can map out your checkout process and see which steps cause users to abandon it. For instance, the checkout funnel below has a conversion rate of 61.74%, with most drop-offs (26.14%) coming between Steps 1 and 2.
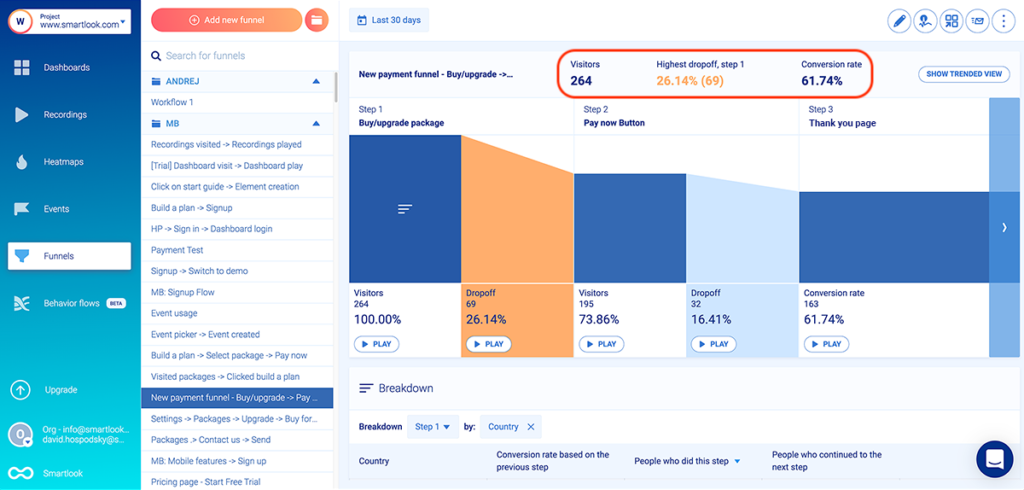
You can build this funnel with three events, without any coding:
- Event 1: Users click on “Add to cart” (select the button with our no-code event picker to define the event).
- Event 2: Users click on the “Pay Now” button (again, select that button with the no-code event picker).
- Event 3: Users land on the “Thank you” page (use the “Visited URL” standard event and enter the page URL).
And because Smartlook also offers session recordings, you can watch the sessions of users who dropped off at a specific stage by clicking on the “Play” button.
In the example above, you can watch the drop-offs between Steps 1 and Step 2 (26.14% of all users), as well as between Step 2 and Step 3 (16.41% of all users) to see why drop-offs happen and increase conversions.
AstroPay — a fintech payment app — actually used this process to improve the conversion rate of one of their most important funnels.
They mapped out the funnel and then they jumped into the session recordings of users who dropped off. The sessions revealed obvious points of friction, which AstroPay’s team was able to quickly fix, leading to a 56% boost in conversions.
Check out our AstroPay case study for more details on their challenges and the impact of working with reliable product usage data.
#5. Crash reports: Understand when and why app crashes occur
It’s essential to know when and why crashes happen, so you can find their root cause before they affect too many of your app’s users. Tools with crash reporting capabilities help you do that.
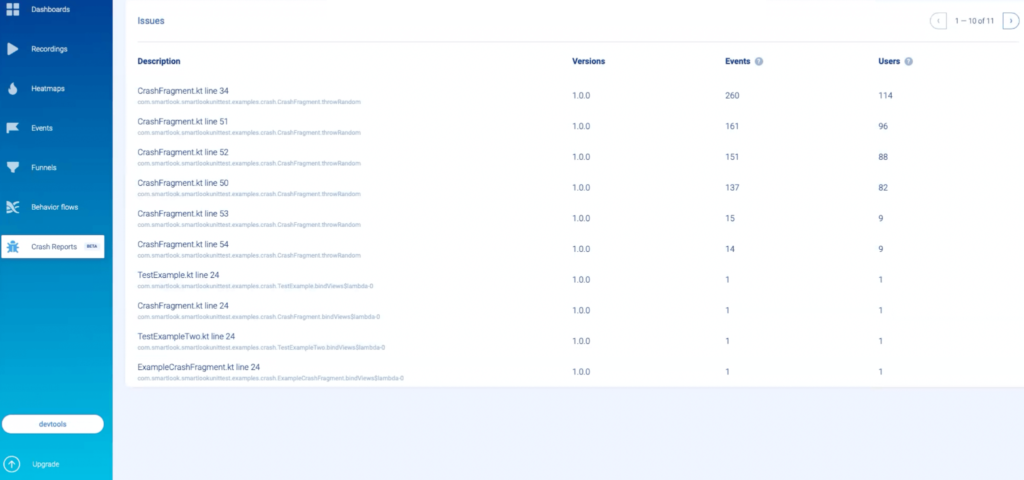
For example, Smartlook’s Crash Reports (available for Android apps) give you a list of all app crashes, grouped together by the first three lines of the stack trace.
You can also see how many users experienced a crash, as well as which versions of your app the crash occurred in.
From here, you can dig deeper by clicking on each crash fragment, analyzing the entire stack trace, and seeing the user’s platform, device, date, and country.
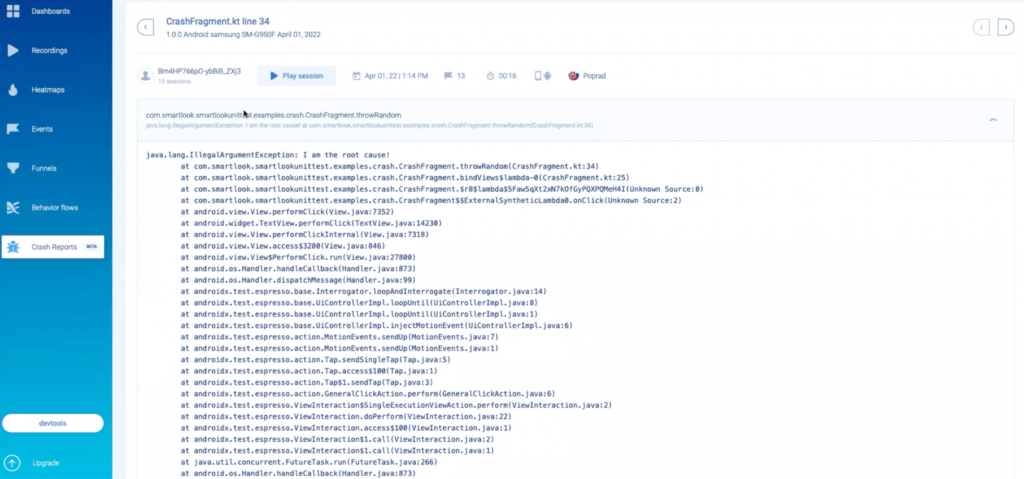
This information is useful, but usually not enough for developers and quality assurance (QA) professionals to diagnose the problem.
That’s why with Smartlook, you can click on the “Play session” button above the stack trace to watch all sessions where a certain crash happened.
As a result, devs and QAs can see exactly what led up to the crash, instead of guessing or trying to reproduce the issue via trial and error. This makes debugging much easier and lets your team fix crashes that they otherwise couldn’t have.
Vertigo Games — a game development studio — is a perfect example of the power of being able to see how issues occur. In the early stages of developing their Critical Strike game, their product and dev teams lacked essential information about:
- The paths and user actions that led to crashes and other bugs.
- The number of new users who completed the onboarding guide.
- How players completed the game’s missions compared to the initial design.
These blindspots made their development process very time-consuming and inefficient, which is why they turned to Smartlook. Having session recordings that show the actual customer experience transformed Vertigo Games’ process of finding and fixing problems.

Start collecting and analyzing app experience data with Smartlook today
Smartlook gives you robust analytics that show what your users are doing — paired with session recordings and heatmaps that show why — all in one place.
Our platform can be used on:
- Mobile applications built with many popular platforms and frameworks. Our mobile SDK is currently compatible with Android, iOS, React Native, Flutter, Cordova, Ionic, Xamarin, and Unity apps.
- Websites and web apps, including ones built with popular CMS like WordPress, Joomla, and Shopify.
Smartlook also has integrations with A/B testing platforms, like Google Optimize and Optimizely, traditional web analytics platforms, like Google Analytics and Mixpanel, and other widely-used SaaS tools, like Slack, Zendesk, Salesforce, and many more.
If you want to see Smartlook in action before you set it up on your app, you can book a free 1-on-1 demo here. Оur team will give you a detailed Smartlook presentation that’s tailored to your business at a convenient time for you.
You can also try Smartlook yourself with a free 30-day trial (no credit card required).