We’ve updated this topic to prove to you that analyzing customer behavior in-app isn’t as tricky as you might think.
But before we get started, let’s discuss the following:
- Marketing professionals know how to use Firebase mobile analytics. But because Firebase involves numerical data and metrics, some find it difficult to justify the choice of key metrics. Furthermore, numerical data doesn’t reveal insights connected to customer experience or explain how users are led to purchase decisions
- A mobile customer journey is often complex, including many touchpoints. There are taps, interactions with video content, buttons, and drop-down menus. Not to mention, numerical data from Firebase doesn’t give you the ‘why’ behind buying behavior or customer churn
In reality, most marketers know what happened, but they don’t know why it happened. Consider the following examples for clarity:
- A group of valuable customers (based on customer lifetime value) just abandoned their cart. Why?
- Various types of customers located in the Netherlands contacted support because they can’t log in. Why?
- A user base that joined during the spring campaign signed up but churned a couple of months later. What’s behind their decision-making process to churn?
Want to know why? Chances are, you do, and you’d also like to discover:
- Leaky sales funnels, including how to fix them so they result in higher customer satisfaction
- Friction points and UX issues as well as ways to remove them so they result in better customer loyalty
- Buying behavior of consumers so you can talk to your target audience at the right stage of the buying journey and respond to their customer needs in a better manner
This knowledge helps you correct flaws leaving users with a high-functioning app complete with a rock-solid UX and a clear path to accomplishing desired tasks.
Throughout this post, we’ll show you how to combine numerical (quantitative data) and non-numerical (qualitative data) so you get a clear picture of your app.
But first, let’s start with the fundamentals of analytics so you have context for more practical use cases later on.
3 key topics you need to understand to begin analyzing customer behavior in-app
Jumping straight into the data dashboards won’t help you kick off a customer behavior analytics project.
Instead, focus on:
- Performing solid market research. Don’t be afraid to dig into customer data, recent marketing strategy, types of customer segments, and demographic data
- Expressing doubts with internal experts. Discuss marketing campaigns that succeeded and failed and talk about customer retention and past customer behavior analyses
- Preparing a plan that follows a specific marketing strategy. For example, if you’re marketing a B2B SaaS mobile app and you know the customer journey map, you’ll have a different approach than if you were marketing an MVP app that’s focused on B2C
Such an approach will help you discover what materials and data sets are ready, and what you’re missing.
Be sure to also consider the following 3 aspects:
- The tools in your marketing stack
Tools are an important part of analytics initiatives.
There are plenty of them at your disposal:
- Analytics tools help you collect numerical and non-numerical data regarding in-app customer behavior
- Media monitoring tools provide you with real-time social trends and sentiment towards your brand
- Customer feedback tools help you understand what users think about you app
- Spreadsheets help you organize assets and keep data in order
- Customer relationship management tools help you reach missing information about customers, find the ideal customer profile, analyze geo data, and attach customer lifetime value
- Project management tools help you better share your outcomes with team members
- Simple to-do lists allow you to organize your work better
Depending on what you need to learn, you’ll rely on different tools to gather specific data.
- An analytics plan based on strategic key performance indicators
To achieve your goals, you have to know where you’re heading with your in-app optimizations. Discuss the direction of mobile app optimizations with other teams, including BI, product, and sales teams and C-level executives.
Before you begin performing a customer behavior analysis, discuss individual customer profiles with support and source information regarding your ideal customer profile (ICP).
You’ll get a lot of information regarding:
- Current customer base
- Patterns of user behavior
- Customer lifetime value
- The market direction of your app
- And key performance metrics tied to the business
This knowledge will give you a clear view of what type of optimizations you should focus on.
Say you’re working on a well-established e-commerce mobile app. The business has already reached significant market share and market penetration. You know the buying habits of your customer database.
Now you need to consider the following:
- The optimization of in-app flows that increase sales volume or spend per customer
- Improvement of user engagement, so the app is more sticky and retains users better
- Maintenance involves improving the stability of an app. Detecting potential critical bugs that may deteriorate the user experience is essential
- Customer behavior tracking. This refers to tracking anomalies and cooperating with other teams on small optimizations
Because they are not expecting that every day or every week something wrong would happen.
So for them, it’s super helpful to have something that automatically implies that if there is a spike they get notified.
If you’re optimizing e-commerce apps, it’s better not to break anything in the purchase flow because the company may lose revenue and users.
So for these customers, it’s really crucial to have, like the tool actually offer some kind of proactive detection of these anomalies, especially on the negative side.

- Skills in basic hypothesis testing
If you really want to learn customer behavior analysis, start by coming up with a hypothesis, then look for data that either supports or disproves it.
Null and alternative hypotheses are used in statistical hypothesis testing:
- A null hypothesis states that there is no statistical relationship between the variables that you’re testing (e.g., there may not be any dependency between the color of your buttons with conversion rates)
- An alternative hypothesis is often expressed as a correlation or statistical relationship between variables (e.g., there may be a dependency between shortening the purchase flow and conversion rates)
To formulate an alternative hypothesis, use this formula:
- If we [reduce/increase] [a specific variable like price, steps in funnel, button number] by [X%], then we’ll see [increase/decrease] in [variable like sales volume, free to paid ratio, revenue] [greater/smaller] than [numeric value] in [timeframe].
In other words, “If we reduce the number of steps in the purchase funnel by 2, then we’ll see an increase in the number of purchases greater than 15% in 2 months.”
Here, the null hypothesis tells us that the alternative hypothesis is wrong. It may always turn out that reducing the purchase funnel by 2 steps will decrease the number of purchases in 2 months.
You have to test it out to be sure that you’re making informed decisions. If you’d like to dive deeper into hypothesis testing in marketing, we recommend this article. A nice addition to being able to run A/B tests is data visualization later on. It will help you showcase your findings and justify potential changes.
I will add these buttons because it will make my flow or it will make the flow in the product easier and more understandable.
But maybe your users think it won’t be a good solution and the numbers will tell you. Basically you have to confirm your ideas with the real data.
So that’s what you can learn by tracking your customers data: you can learn if the change you made in an app led to improvement so the alternative hypothesis was true or not.
This mindset will help you avoid possible pitfalls when making sense of the data obtained from your analytics tool.
Think about what you need to learn, and then look for ways to check it out. For example, Firebase analytics will help you acquire data for your hypothesis testing.
But there is also another way. By using qualitative data, you can detect critical in-app issues. For example, after watching 10 session recordings, you’ll get context for numerical data so you can understand what happened and why users acted in a specific way.
What in-app behaviors you can track: basics of analytics and data scopes
Here, we’ll show you what to do with event, session, and funnel-based analytics.
Analyze specific user interactions by diving into event-based mobile analytics
Events are an important element of any analysis. It doesn’t matter if it’s an automatic event or a custom event you have to add manually. Events give you information regarding whether a user action happened or didn’t happen.

The analytics tool collects information about all general events: from the mobile screens where they happened to user data like location, OS, and browser.
There are many types of user behavior you can track:
- Clicks
- Text input
- Taps
- Scrolls
- Moves
- Views
- Crashes
- Messages appearing
At the beginning stages of analytics implementation, ask yourself, “which events are key for the mobile app I’m working on.” This will help you focus on the events that matter most.
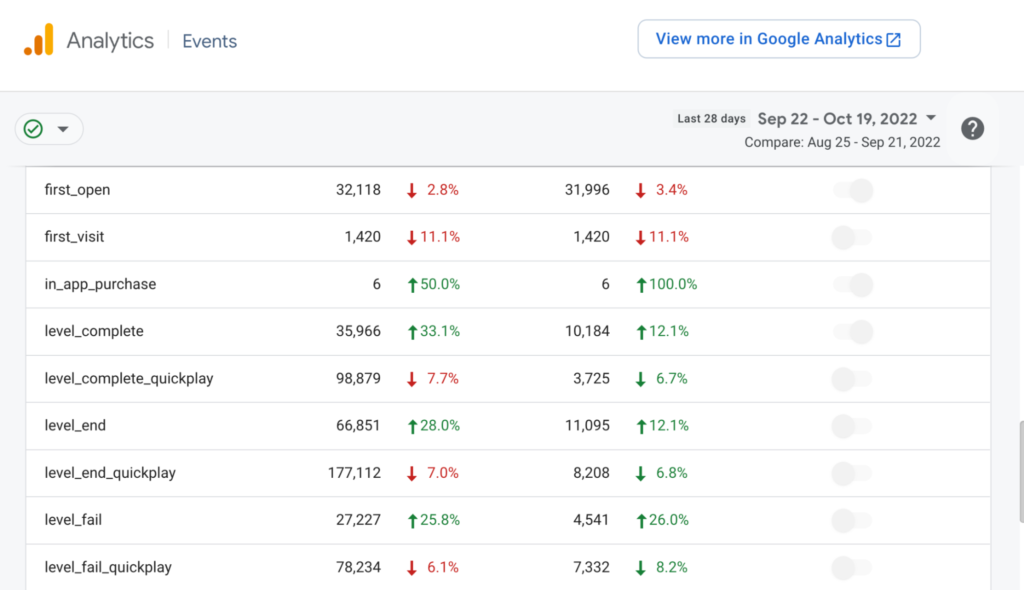
Let’s look at Firebase. Here you’ll find events like “first_open,” “in_app_purchase,” and “level_complete_quickplay.” These are general events that might be a good fit for an app that features in-app purchases or video.

By clicking on 1 event, you get more details about this type of user interaction. You can see how many users completed the event, including the amount of revenue attributed to it.
Let’s get more practical. Say you’re working on a mobile banking application. If you are, you’d definitely want to track events like “user_account_validation” or “user_identity_verification.”
But as mentioned above, your banking app will also have events that are common across different verticals. These can be events like “plan_purchase_success” or “dashboard_login.”

When it comes to the “dashboard_login” event, let’s take a look at the details.
In Smartlook, the chart containing the data is similar to Firebase. The key difference between Firebase and Smartlook is that here you can see the session recordings of all the users that completed the “dashboard_login” event.

Now, let’s talk about session-based analytics and the benefits it brings in the context of user behavior analysis.
Analyze users and get the big picture thanks to session-based analytics
A session-level view is like a frame for events. While events are small data points, sessions are where events happen. Take a look at the image below for clarity.

Here, you have a session that lasts for 1:05 minutes. Throughout this session, you can see colored dots on the timeline — these are the events that one user performed during this 1-minute session.

While events let you zoom in on one specific user action, sessions show you the full in-app user journey. During in-app sessions, you can spot how users move between screens, where they tap, where they get stuck, and on what screen they close the app.
By watching user sessions, you learn how customers use your app.
Let’s get practical.
This is a video streaming platform. By observing this session recording, you can see that a user interacted with the keyboard and typed a phrase into the search bar, “people are awesome.” It looks like the user wants to watch a video about the topic.
Thanks to such an overview, you can see how your search bar works. Does it return relevant results, causing the user to want to stick with the app? Or are they not getting the results they’re looking for, encouraging them to quit the app?
Combine multiple sessions to see the full in-app user journey. You can see all session data connected to one user from this view.
This can be helpful if, for example, you know your ideal customer profile. By watching the entire journey of ideal customers, you can get insights into what behavior patterns they have in common.
Based on this, you can plan a couple of experiments to improve your app based on the needs of these customers.

By observing what users do inside your mobile app and reviewing session-by-session data, you can spot specific patterns of behavior.
For example, after watching 10 users’ sessions via a session-level view, you might notice that they encountered a bug that stopped them from upgrading their plan.
Or, by watching session recordings of users to whom you rolled out a new feature, you’ll be able to see how they interacted with it and whether they’re using the feature according to how you designed it.
Analyze the most important user paths by creating a funnel analysis from event sequences
Sessions provide you with a lot of insights, but they don’t give you a view surrounding how many people completed a specific step-by-step path.
Events are also helpful, but as a standalone feature, they provide you with a rather narrow view of your analytics tools. As a single event only shows you aggregated data regarding a specific interaction, they must be placed in a sequence to unlock their true power.
Marketers call this a funnel analysis.
It’s a common analytics method to verify whether users take in-app navigation paths the way you intended.
You can build a funnel analysis from whatever sequence you want. In Smartlook, you can build 50-step event funnels. Curious about whether this has been attempted? Look no further — this mobile game development company has both 30 and 60-step funnels.
In general, the most common example of user flow is login and purchase funnel analysis.
Say you’d like to know the common user path for individuals located in Saudi Arabia. Perhaps you’d like to know how many users pressed the “upgrade plan button” and completed purchases.
To do so, build a funnel out of 2 events: “Upgrade_button” and “Package_change_any.”

It looks like, in the last 12 months, out of 68 users in this funnel, 8 completed the sequence.
If you think there might be a friction point, watch the session recordings of the 60 users that didn’t accomplish the flow. Thanks to these qualitative insights, you’ll be able to set a hypothesis, test it, and either accept or reject it.
To watch the session recordings of those 60 users, just press the “Play” button. You’ll see real user behavior through the lenses of the session recordings.
Now that you understand mobile analytics data scopes let’s dive into more practical, structured ways to crunch data and get insights.
3 analytics scenarios to help you nail down in-app user behavior
We talked about the key things you need to start analyzing customer behavior. Further in, we talked more about analytics fundamentals and data scopes. Now, it’s time to take a look at some practical use cases.
Scenario 1: Team up with product teams to observe the adoption of a new feature
We think that, as a marketer, you should closely work with your product team. Here’s what Emilia from Userpilot thinks about product and marketing team cooperation:
New feature and product launches should also be planned long in advance, to ensure there are the right marketing assets ready to promote them – both outside the app, for new leads and prospects, and in-app for existing customers.
Also, product people aren’t copywriters and they don’t have to be – that’s where the marketing team comes in. But in my experience, this is the area where there’s often a lack of alignment between the teams – and the product team just keeps launching and writing their own in-app microscopy, without any consultation with the marketing team.
It often results in convoluted “techspeak” that is hard to understand for the users, and inconsistencies between the in-app, website and blog terminology.

Speaking about the feature launch. When your product team ships a new feature, it’s good to keep an eye on the data with them and observe what happens after release.
Will app users benefit from the features? Will their willingness to pay (WTP) be high because the feature solves an important pain point for them?
Although product managers are the target audience for the article below, consider reading it to learn how product teams should prioritize features. It might give you context regarding your marketing activities and ensure smooth cooperation in cross-team endeavors.
Check out how to use a product value matrix to prioritize features in roadmaps.
Also, it’s important to embrace a learning culture by sharing insights from analytics tools with product teams. In modern organizations, marketing and product teams work tightly together. Working with the same analytics tool ensures you remain on the same page.
To get answers to the questions above, use behavioral analytics tools. Let’s say you’re working for a ride-hailing company.
The product team just added a new feature that connects the app with a food delivery app. Cooperate with the product team and share the insights from your analytics tools during the first couple of weeks after feature rollout.
For example, watch session recordings with folks from product teams to discover if users engage with the new feature or if they prefer to use the app the traditional way (ride-hailing).

Create a couple of funnels to see from which area in the app users process the food application. Test out how many of these users select a restaurant, add food to the cart, and proceed to checkout.
See how many of them actually complete the whole flow.

Check which step has the highest drop-off rate and watch session recordings of those who drop off. From the session recordings, which patterns of behavior are the users who drop off exhibiting?
Maybe they don’t know how many steps await them and have lost the motivation to complete the flow?
You should set alternative and null hypothesis as follows:
- Alternative hypothesis: If we add a progress bar with steps until purchase, the number of purchases will increase by 15% in 3 months
- Null hypothesis: if we add a progress bar with steps until purchase, the number of purchases won’t change/will decrease in 3 months
With this experimental mindset, you’ll always make sure to test when you suspect friction in the app.
The Funnels feature was removed from Analytics for Firebase as of December 2021. If you think funnel analysis might be a crucial step in understanding user behavior, check how funnels work in Smartlook.
Scenario 2: Catch bugs with crash reports and session recordings and pass them to your developers
Firebase Crashlytics is one of the most popular tools for detecting and potentially fixing app crashes.
But it has one shortcoming: although it shows you where something went wrong in your code, it doesn’t show you the exact circumstances in which bugs and crashes occurred.
This may lead to problems with bug reproduction. The other option is to rely on information from users that you’ve asked to reproduce the steps that led to a crash.
While this may work, there is an easier way.
By using qualitative session recordings tied to a crash report, you’ll see what led to a crash and what type of information you should pass on to your dev team within minutes.

Scenario 3: Analyze user flows and see how customers make use of coupon code offerings
Say you’re working for a well-known meditation app.
Your colleagues in marketing decided to do a Black Friday promotion for those who register with your app for the first time. It’s a Black Friday promo code that offers 40% off for yearly subscriptions.
This campaign aims to attract new users and turn them into paying subscribers within a couple of days.
With numerical and non-numerical data, you can check if the Black Friday marketing campaign is leading to an increase in the number of paid users. Say you set up everything from a technical standpoint — you’re sure everything works, including the promo code.
It’s been 4 weeks since the beginning of the campaigns:
Step 1: Check the event you set beforehand: “event-typed text” — this means someone typed the promo code into the dedicated box.
Step 2: Press “Play” and watch the session recordings of what happened before they typed in the code and what happened after.
Step 3: Bucket user behavior patterns. For example, you may see that a group of users typed in the promo code but didn’t proceed further.
You could also see that a group of people typed in the promo code, but the promo code failed to work. This is a big issue that needs to be verified and resolved by the dev team. It’s worth checking if the issue is global or on a small scale.

Step 4: Get a bigger picture with funnel analysis. Input the following sequence of events to create a funnel:
- “Event – Typed text”
- “Packages: Home screen”
- “Plan purchase”
By doing so, you’ll see the journey of those who typed in the promo code, proceeded to choose a package, and followed the path to completion.
By performing this small but powerful analysis, you’ll see what user behavior looks like when people are given a 40% off promo code. Later on, you can check if the campaign generated leads that retained users in the coming months.
Other questions to ask yourself: do 40% off promo codes lead to a higher volume of purchases? Is it worth giving a discount to mobile app users if they retain and have high customer lifetime value?
Should you optimize the discount next time? Maybe it was high but still didn’t generate many purchases? How will this campaign influence your company’s revenue in the long run?
These are questions that encourage you to experiment with analytics further. Instead of viewing hypothesis testing and experimentation as a one-time event, think of it as a continuous experiment.
By nurturing such a culture, you’ll be able to optimize your app for the long run.
Ensure cross-team analytics collaboration is a breeze
It is extremely important to continuously explore and analyze customer behavior.
The growth potential of your app is determined by your growth experimentation. Start with a basic analysis and proceed to more complex ones over time.
And never underestimate the power of analytics. Firebase is a must-have. But at some point, you may realize that you need more context. In this case, you’ll need a tool like Smartlook that utilizes the power of qualitative data in combination with numbers.

Lastly, cooperate with other teams. Support is a great source of knowledge when it comes to customers and their pain points. Your product team is a great source of knowledge regarding the positioning of features.
Thanks to cross-team efforts over data from the same source, you can build powerful mobile applications. And what’s more, you’ll understand:
- Why some users abandon their carts, including which team to connect them with to solve the issue
- Why a group of users from the Netherlands contacted support. Maybe in the future, users won’t reach out to support as often thanks to some simple adjustments
- Why some users didn’t take advantage of a Black Friday promo code, including what stopped them from completing a purchase
Schedule a free demo or try Smartlook today with our full-featured, 30-day trial (no credit card required).