


All you need to know about mobile app analytics

“There must be an app for it!” How many times over the past several years have you asked yourself this? Aside from being a great business opportunity, mobile apps have become an integral part of everyday life. The question is, “Why do so many apps fail year after year?” The answer is simple — mismanagement. Thankfully, we now have access to mobile app analytics tools that increase the odds of success with valuable insight into user behavior.
Over the past ten years, smartphones and tablets have gradually become ubiquitous, spawning a new branch of software development: native mobile applications, or “apps.”
Now, apps fit seamlessly into our everyday lives. We use them to check our e-mail over breakfast and practice foreign languages while commuting to and from work. We use one to exercise in the morning, then log into another to track the quality of our sleep.
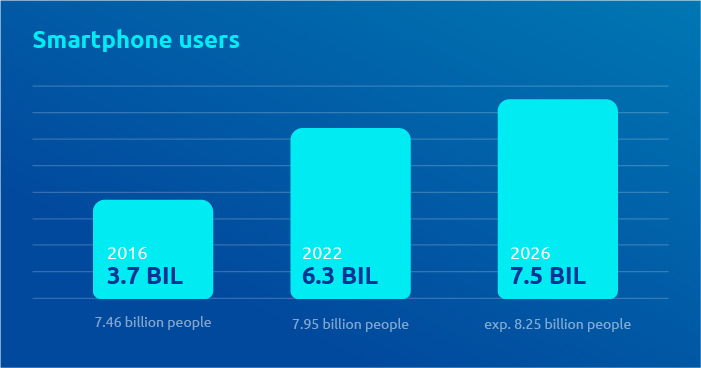
Smartphone users
Everyone who has a smartphone uses apps. There are over 6.3 billion smartphone users worldwide (over 80% of the world’s population). This number is growing exceedingly fast (back in 2016, there were only 3.7 billion smartphone users) and is predicted to expand to 7.5 billion users by 2026.
Apps have blurred the line between personal computers and phones beyond recognition. The rise of the smartphone and mobile software has forever changed the way we shop, consume media, socialize, play games, work out, and travel. Some retailers report more conversions via apps than mobile websites. If the predictions are accurate, there’s no doubt this will become the norm in the future. Perhaps, it’s time we all adapt to the new age?
The world of mobile apps is highly competitive due to the fast-developing, ever-changing market. In December 2021, the App Store reported 30 thousand (!) new apps — that’s an insane amount of competition. To make your app stand out, it has to be exceptional. Users only want the best of the best.
So, how does one create a unique product in an ocean of apps? To put it simply, you have to hone the user experience. Perfect it, make it sticky, and improve your key business metrics immediately and considerably.
Have questions about providing the best experience to your users? Then you need mobile app analytics.
1. What are mobile app analytics?
Mobile app analytics refers to tools that track, observe, and evaluate user behavior within a mobile app. The data obtained with mobile app analytics tools can help you improve your app across various aspects (more on this to come).
How many people have downloaded your app? How much time do they spend on it? Are significant drop-offs occurring? If so, at what point and why?

Features
This is a small example of the data you’ll have access to with mobile app analytics — there’s much more to discover. Advanced mobile app analytics tools record user sessions and allow you to play them back. You can use them to create funnels and heatmaps to understand how users navigate your app.
Mobile analytics tools provide valuable demographic-related data and track revenue from in-app purchases. They tell you everything you need to know about your users and their behavior. With this data at your disposal, you can constantly improve the user experience, not to mention your marketing strategy.
2. Why do you need mobile app analytics?
The number of individuals that rely on apps for day-to-day tasks has been steadily increasing (the pandemic and the subsequent lockdowns certainly contributed to this). Online banking, grocery delivery, e-commerce, exercise and educational-related apps, games — virtually every category of mobile software has seen a dramatic increase in daily usage, with an average increase of 30% since 2019. At the same time, over one-third of surveyed marketing professionals reported they would increase their budget for analytics.
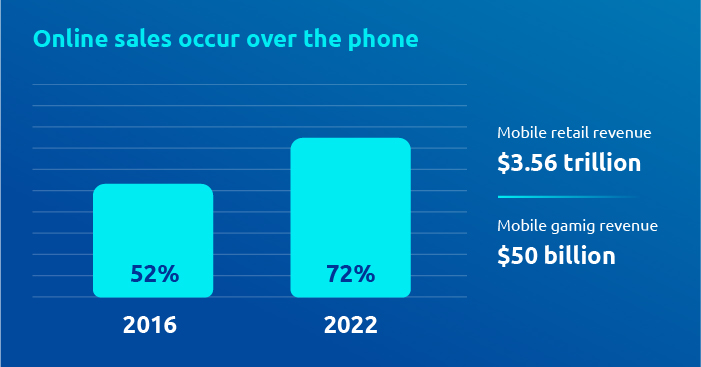
Online sales occur over the phone
Mobile software is becoming the dominant force in the online world. Speaking in numbers, over 72% of all online sales occur over the phone. This is a dramatic increase from just 52.4% in 2016. The mobile retail sector alone accounts for $3.56 trillion in turnover. And mobile gaming constitutes the largest portion of total gaming revenue — over $50 billion.
It doesn’t matter whether your business model relies entirely on mobile platforms or if your app is simply an extension of your online presence to keep a more direct relationship with your customers. In either case, you’ll want to:
- Acquire accurate user behavior-related data
- Use data to guide development
- Measure the impact of new features
- Improve the user experience (UX)
- Increase revenue
Mobile app analytics help you transform data into insight. Whether you’re interested in improving performance, marketing more effectively, increasing in-app purchases, boosting sales or user acquisition, there are countless ways to use analytics to polish almost any aspect of your app. To focus on what’s most important to your users, you need to make informed, data-driven decisions and say “no” to speculation.
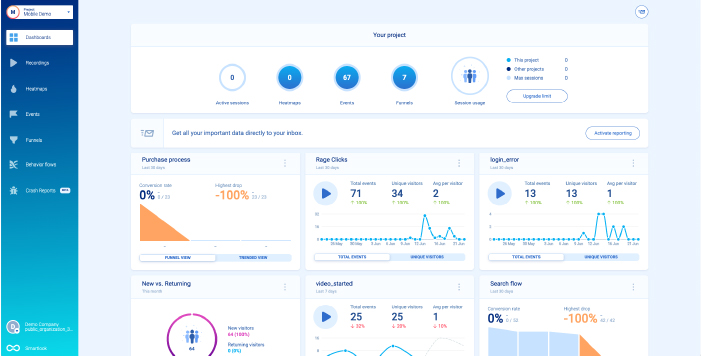
Smartlook dashboard UI
Typically, the main tools deployed for UX analysis consist of screen recordings, heatmaps, and funnels. These provide a direct view into how users interact with your app. When used right, they’ll leave you with a better product in your hands. Consider this: every dollar invested into UX has a return of $100.
Analytics tools combining quantitative and qualitative research methods deploy across teams and various niches. Whether it’s gaming, SaaS, e-commerce, or the rising star of “quick commerce.”
Collect performance and crash data using events and funnels. Place your ads strategically with the help of heatmaps. Resolve customer tickets quickly and effectively by viewing screen recordings. No matter the task — mobile app analytics can be very useful.
3. Mobile app analytics: use cases
Let’s look at some examples of how mobile app analytics tools can help you with some issues you may be dealing with. These examples are not illustrative. They are real use cases experienced by clients of Smartlook — a web and mobile analytics tool.
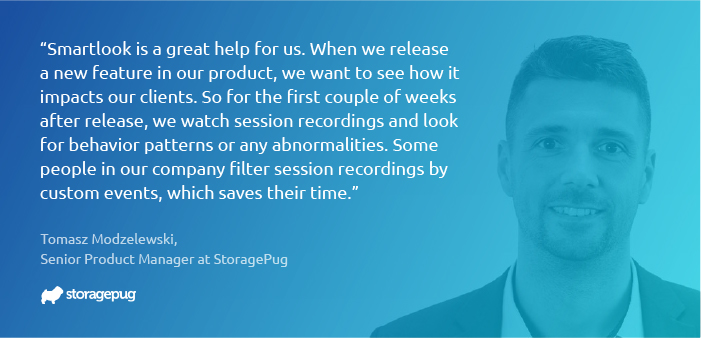
StoragePug
After the tech start-up, StoragePug, offered a new release, some of their clients stopped receiving orders. Without the assistance of an analytics tool, their development team would have had to wait days to collect enough data to resolve the issue. However, their product manager (growing wary due to the lack of orders) opened Smartlook. He watched the session recordings and immediately determined that the new user interface was not rendering correctly. The manager informed the engineering team, and they fixed the bug in no time. Thanks to Smartlook, their client’s orders were delayed only hours instead of days.
Sometimes, what may seem like a destructive bug at first, may only be a minor inconvenience. This happened to another Smartlook client — a hospitality start-up.
A user reported a bug that seemed like a severe problem at first glance. But after reviewing the user’s session recordings with Smartlook, it became apparent that the individual made a simple mistake that wasn’t recoverable.
Mobile analytics tools can detect more than bugs and user errors. They’re also great at improving in-app performance. Using Smartlook’s session recordings, a UX design manager for an entertainment company noticed that their users often continued browsing their catalog after placing items in the shopping cart. However, their app was designed to lead users to the checkout after placing items in the cart. After observing this behavior, they made some tweaks to make returning to the catalog more straightforward and intuitive.
As you can see from the examples above, mobile app analytics tools can assist developers, product managers, customer support professionals, UX designers, and others.
4. Analyzing data with mobile app analytics tools
You can measure and explore so much with mobile analytics that it may feel overwhelming at first. Newcomers are often intimidated by the amount of information, having no idea how to sort and interpret it.
It’s helpful to know the types of mobile analysis you can perform with analytics. All trackable mobile metrics fall under 1 of the following 4 categories:
- User engagement
- Customer acquisition
- App performance
- Customer satisfaction
Let’s go through them one by one.
A) User engagement analytics
This data displays whether or not users find value in your app. To paint a clear picture of your app’s user engagement, focus on the following data:
- Number of downloads
- Number of in-app shares
- Active users daily, weekly, and monthly. Goals may vary depending on the type of app.
- User retention. Do users return and use your app frequently?
- Time spent in-app
We can’t list all of the relevant metrics for user engagement as it’s closely tied to your objective. For example, if you have an e-commerce app, concentrate on basic shopping metrics like the number of “add-to-cart” events, purchases, and viewed items.
Conversely, if you have a gaming app, focus on how much time your users spend on your app, what levels they reach, what secret features they unlock (especially if users have to pay for them), etc.
Remember, the most valuable users are the ones that are the most engaged, as they’re most likely to return, buy and share.
B) Customer acquisition
This provides valuable data relating to how you acquire new users, including where they’re from, demographics-wise (user age, country of residence, etc.), and data surrounding how and which marketing channels are driving new users to your app.
You’ll also want to know the cost per acquisition (how much a new user costs you on average), including their average revenue or lifetime value. We’ll get to this later.
Tip: try not to be strictly numbers-oriented when analyzing customer acquisition. For example, if you notice that a particular marketing channel brings you the most users — that’s quantitative information. Don’t forget to add a qualitative layer, too. Do these users tend to stick around? What’s their retention rate? How engaged are they? Although another marketing channel may provide you with fewer users, you may find that they are “longer-lasting.”
C) App performance
This type of analysis speaks volumes about the health of your app. As such, it’s crucial when it comes to optimizing and improving your app. It displays crash-related information, errors, and carrier/network latency.
When analyzing performance data, bear the following statistic: a 2013 study shows that 79% of users will give an app a second chance even if it fails to work the first time. Only 16% of users will attempt to relaunch an app if it fails more than twice. In summary, the responsiveness of an app, including its speed and crash rate, is paramount to driving new users.
D) Customer satisfaction
A satisfied customer is a returning customer. They’re also more likely to recommend your app to friends, family, and business associates. Even if you test an app thoroughly before launch, it’s not uncommon to learn that individuals may use it differently than anticipated. Only mobile app analytics tools can depict authentic user behavior.
Customers will be satisfied with your app if it meets their expectations and allows them to complete the task it’s designed to do. If they get stuck and frustrated, not knowing what to do next, they won’t hesitate to move on. Mobile app analytics tools highlight crucial performance problems so that you can address them quickly and effectively.
5. Track Key Performance Indicators (KPIs)
Do your homework before setting up and performing any analysis. First, decide what you want to measure and why — set goals based on the objective of your app. Have a clear vision of what success looks like for your app.

Key Performance Indicators (KPIs)
For example, many gaming apps thrive off in-app purchases that enable users to unlock secret features that give them an advantage. If you have such an app, ask yourself, “Do your users make such in-app purchases?” Say you have a language learning app that drives success from ads and upgrading to a paid version. Do your users convert willingly? How long does the process typically take? Do they request a free trial first? If they don’t convert — do they continue to use the free version daily?
To set your analytics-related goals correctly, you need to know the answer to the following questions (depending on your line of business):
- What is the objective of your app? Is it designed for purchasing goods? Perhaps you wish to entice users to make in-app purchases in exchange for an ad-free experience (common with gaming apps)? Is it intended for ad monetization? Or is it simply a tool to lead potential customers to your website?
- How can you tell if you met the objective of your app? What makes your app successful? This is closely tied to your definition of the objective. For example, if your app exists to generate leads to your website, track the number of customers who go there, including how much money they spend. Be sure to follow the users that don’t end up on your website. Try to determine what’s stopping them.
Answering these questions will provide you with an outline of the KPIs you should focus on. From here, try experimenting with some additional KPIs. Be sure to set your goals before diving into the analytics and metrics.
Once you have your goals in mind and know exactly what needs to be measured, it’s time to choose which metrics you want to engage. It’s beneficial to understand that all metrics for mobile app analytics fall into 1 of the following 3 groups (generally speaking):
- Revenue KPI metrics
- Engagement KPI metrics
- UX and performance metrics
A) Revenue KPI metrics
These highlight whether your app generates enough money to be sustainable, if you’re experiencing a positive ROI, and how much you spend on marketing. These metrics are closely (but not exclusively) tied to customer acquisition, which we discussed earlier.
When deciding which revenue KPI metrics to observe and measure, consider the following:
- Average revenue per user
- Purchases (including the time to make the first purchase)
- User lifetime value
- Conversion rate
- Cost per install
- Customer acquisition cost
B) Engagement KPI metrics
As the name suggests, these metrics mirror your app’s user engagement. The more engaged your users are, the more revenue you’ll receive.
Engagement metrics that most app owners or developers follow include:
- Daily/monthly/weekly active users
- Session length and depth
- Average screens per visit
- Retention rate
- Churn rate
C) UX and performance KPI metrics
These metrics mirror performance analysis. They indicate how your app is performing, including how users navigate it. Most commonly, they include:
- Load speed
- Devices and operating systems
- Screen resolution
- Crash reports
- User error rate
- Task success rate
- Time spent in-app
Various people on your team (or across groups) will be interested in different types of KPIs. Product managers, digital marketers, and developers might all require access to metrics according to their field of expertise (although they may meet across some areas). Let’s take a closer look.
KPIs for product managers
Clearly set KPIs are crucial for any product manager. Without them, product managers are left in the dark. You can’t market a product successfully without a clear definition of what success means to you.
We recommend carefully assessing which metrics are the most important to track and report at the beginning of your app’s lifecycle. Your indicators must be set correctly to build a strong business case and identify trends and issues. Whatever you do, don’t overdo it. The general recommendation is to focus on 5 or 6 key metrics initially. Feel free to add more metrics as you move forward.
We’re cautious about discussing the exact metrics product managers should analyze as they differ from product to product. However, general recommendations include the following
Average Revenue Per User (ARPU)
This metric displays how much a user spends on your app on average (during a set period – most often monthly or annually). Indirectly, it tells you how solvent your audience is. Knowing the average revenue gained per user is essential for laying out future business and marketing plans (you need to know how much value a user brings to set prices accordingly).
ARPU is calculated based on the following formula:
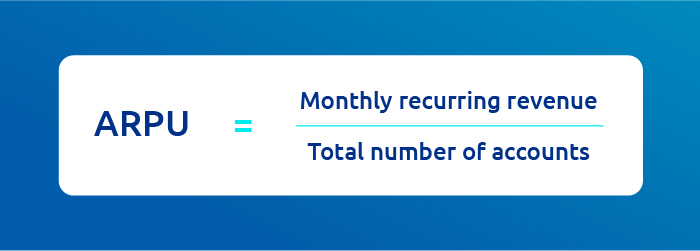
ARPU = Monthly recurring revenue / Total number of accounts
ARPU is an effective tool to evaluate the health of your business and financial sustainability. It’s especially valuable for SaaS businesses with a subscription-based model (you need to know your ARPU to set reasonable subscription fees).
Customer Lifetime Value/User Lifetime Value (CLTV or just LTV)
This is very similar to ARPU but viewed from a long-term perspective. How much does a user spend in your app before deleting it/unsubscribing on average?
CLTV is essential for setting successful and profitable marketing campaigns. (Without CLTV, it’s challenging to determine what constitutes a reasonable campaign budget.)
Use this formula to calculate CLTV:
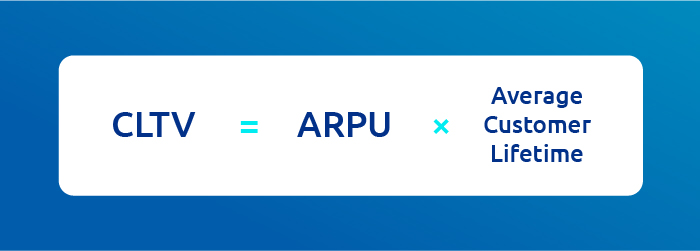
CLTV = Average Revenue Per User (ARPU) × Average Customer Lifetime
Customer Acquisition Cost (CAC)
This goes hand in hand with CLTV as CAC tells you how much money you spend acquiring new users. This includes how much it costs to market and sell your products (sometimes, even the salaries of the marketing and sales teams are included).
Multiple formulas can be used to calculate CAC. The following is the most straightforward:
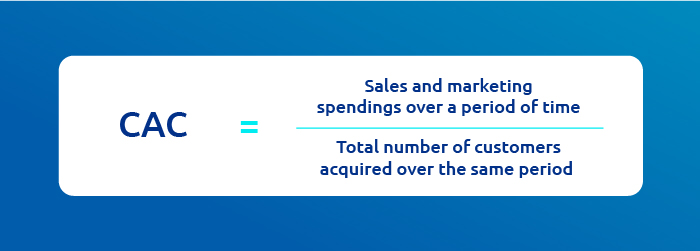
CAC = Sales and marketing spendings over a period of time / Total number of customers acquired over the same period
Conversion Rate
If your goal is primarily to acquire purchases within your app, you need to analyze your conversion rate (the ratio of users vs purchases). Thousands of users mean nothing if they don’t convert.
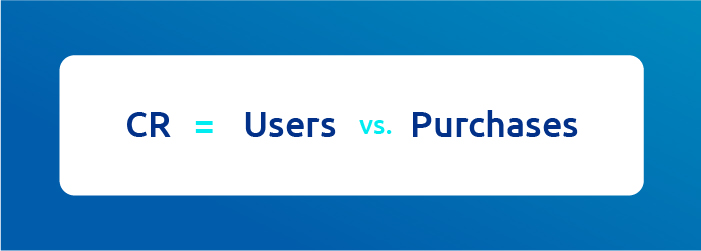
Conversion Rate = Number of users that converted / Total number of users
Daily / Monthly Active Users
Similarly to conversion rate, this metric gives you valuable data about your active users. For example, your marketing campaign can’t be considered successful if it generates thousands of users, but very few of them use your app after they’ve installed it.
The ratio of daily active users vs. monthly active users
We recommend paying close attention to the definition of an “active” user — this depends on your goals. An “active user” generally refers to an individual who performs valuable actions within your app, including making purchases, subscribing, and clicking on leads to your website.
Also, consider that not all apps are meant to be used daily. Take food delivery apps for example. If users use a meal delivery app once a week on average, this number could be sufficient.
Retention Rate and Churn Rate
These metrics are two sides of one coin.
The retention rate gives you an idea of whether or not your app provides users value. If your users tend to return after initial use, they most likely find it valuable.
The formula for calculating the basic retention rate is:
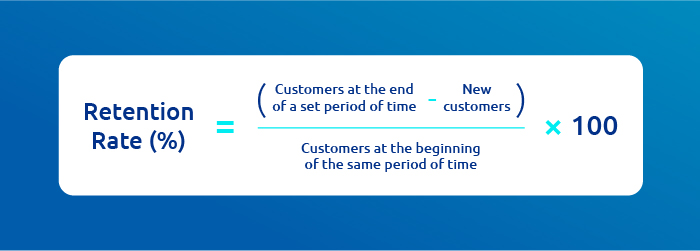
Retention Rate (%) = [(Customers at the end of a set period of time − New customers) / Customers at the beginning of the same period of time] × 100
The formula for churn rate is:
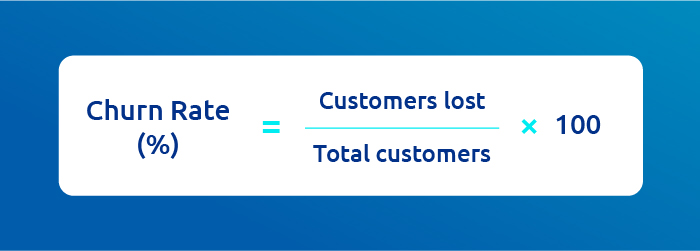
Churn Rate (%) = (Customers lost / Total customers) × 100
KPIs for product managers can also include metrics like bounce rate, number of sessions per user, customer satisfaction score, etc.
In summary, KPIs for product managers should engage both revenue-based KPIs and user engagement KPI metrics. For a holistic-based approach to KPIs — analyze the details but always try to see the big picture, including how different metrics relate to one another.
KPIs for digital marketers
What KPIs are valuable to digital marketers? Similar to product managers, we think a good digital marketer should always aim to see the big picture. In other words, the same KPIs we suggested for product managers should be the focus of digital marketers. Think about it — what good comes from generating new users from an online marketing campaign if there’s a high churn rate and no one gets around to actively using your app?
Many of the KPIs mentioned in the product management section are paramount to digital marketing success, especially concerning churn rate, retention rate, bounce rate, and active users. Digital marketers should also consider the conversion rate, even if it means something slightly different to them vs. product managers.
Regarding app-related digital marketing, the conversion rate could be App Store-related. In this case, the conversion rate will tell you how many users saw your app in the App Store vs. how many users downloaded it.
Some other KPI metrics digital marketers should observe:
Click-through-rate (CTR)
This metric tells you how many users saw a particular ad compared to how many clicked on it. This data tells you how successful an ad is — is it interesting enough to entice potential users to click on it?
Click-to-install (CTI)
This refers to the ratio of users who installed your app compared to the number of users who clicked on an ad. This gives you insight into whether your app seems interesting enough for users who visit via an ad. If the click-to-install rate is low, you may need to reconsider your landing page or app description.
Cost per install
To distribute your marketing budget reasonably and effectively, you need to know how much it costs to acquire a new user.
Cost per action
Similar to cost per install, you may be interested to see the cost of a specific action within your app (typically, in-app purchases). This is especially true if you provide a free trial. Consider tracking how many new users subscribe to your paid version.
Tip: Avoid setting identical KPIs for all marketing channels. Different channels may contribute uniquely when it comes to acquiring new users. Although it may seem like one channel isn’t performing marketing-wise, it’s not uncommon to see a dramatic drop in your KPIs once shut down. If you notice that a channel is not generating enough revenue, consider A/B testing before shutting it down.
KPIs for UX designers
When setting relevant KPIs for UX designers, focus primarily on UX and performance-related KPIs and user engagement KPI metrics. (These are often referred to as user experience KPIs.)
As a UX designer, you want your app to be sticky. Carefully set KPI metrics will undoubtedly help you ascertain whether you’re meeting this goal. Moreover, they’ll help you identify weak points and places for improvement. Widely used KPI metrics for UX designers include session number, length, and depth.
Session length tells you how much time a user spends on your app (on average) and gives you an idea of how engaging (sticky) your app is. Session depth shows how close a user comes to a target action (making a purchase, subscribing, completing a level, etc.).
Google Analytics
How does this apply to UX? For example, you may need to reconsider an update if you notice an increased dropout rate just before users make in-app purchases right after updating your app. There’s a good chance that your update needs some additional work.
Churn rate and retention rate
We’ve already spoken about these metrics in detail, but we need to briefly mention them again as they are of interest to UX designers. If you’re experiencing a high churn rate, always do your best to determine what’s causing it and why.
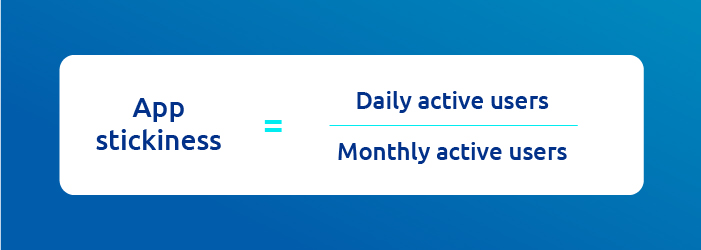
Stickiness rate
No one is more concerned with stickiness than game designers — a game that isn’t sticky quickly ceases to exist. A game that provides a poor user experience will be taken over by another with a better UX design.
The user experience is the most critical factor when it comes to stickiness. But how do you measure whether your app is sticky enough?
The so-called stickiness rate is determined by the ratio of daily active users vs. monthly active users. This number will give you an idea of how your app performs regarding stickiness.
The ratio of daily active users vs. monthly active users
Consider this: a 20% stickiness rate is considered suitable for a mobile gaming app. Anything less than 7% is deemed to be problematic. Let’s put this into perspective: if you have 10,000 active app users per month, you’d want at least 2,000 active daily users to achieve the magical 20% stickiness rate.
It must be said that UX designers should also be looking at the big picture. KPI metrics should not be evaluated separately. For example, solely from a sales/marketing/UX design point of view. Always strive to find connections among KPI metrics and do your best to interpret them. For example, if you only focus on purchases, you risk missing the mark on brand awareness, which won’t help you in the long run.
6. How to choose the mobile app analytics tool that’s right for you
There’s an abundance of tools on the market designed to help you analyze your app, track users, and provide you with valuable data. But how do you know which one is right for you? This question needs to be addressed as you don’t want to be switching back and forth between tools.
Mobile analytics tools may appear similar in some aspects (standard functions are often identical), but they differ in ways that don’t seem evident at first. If you lack previous experience with these tools, it can be challenging to determine what matters most.
Let’s take a look at some standard features and properties you should be aware of before making a decision.
Mobile app analytics tools: features
In our book, The Sacred Four of mobile app analytics, the most important features are session recordings, events, funnels, and heatmaps. If you’re serious about mobile app analysis, these features should be at the top of your list.
Let’s take a closer look.
Session recordings
Session recordings are crucial. Many other features of analytics tools are based on them.
Most mobile analysis tools record users to visualize some parts of the user journey. However, more advanced analytics tools, such as Smartlook, record virtually everything. Moreover, it records everything immediately after setup.
If you’re a designer or developer, you probably know your app inside and out — as you should. However, this can be a handicap when it comes to detecting deceptive problems.
With session recordings, you see every user action, including clicks and scrolling patterns, directly from the moment of installment. You’ll be able to catch crashes and attempted clicks — even when there’s nothing to click. This knowledge is crucial as it helps you identify flaws and bugs to improve the overall user experience.
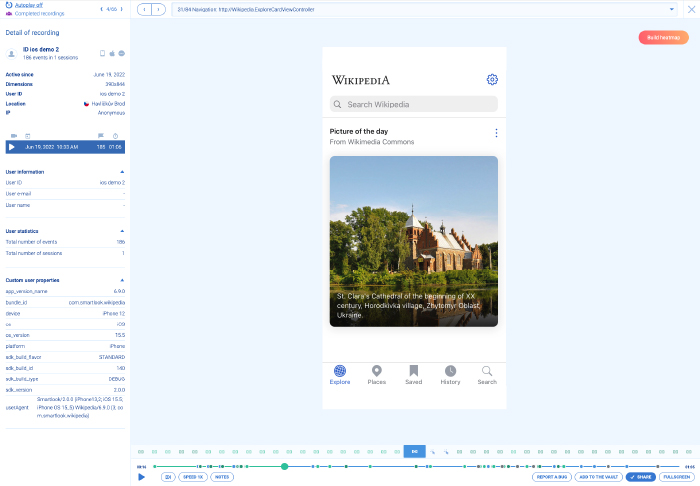
Smartlook Session recordigs UI
Using session recordings still contains an element of guesswork as you can only see users’ actions, not their thoughts. You can only guess why they did what they did. You need to understand how to read and interpret session recordings to come to the correct conclusion.
With advanced mobile analytics tools, you can even identify users with session recordings via their name or e-mail. But only on the condition they give their consent (more on this to come).
Here’s a list of some session recording features to watch for:
- Always-on recording mode
This feature begins recording all user interactions immediately after setup. Once you’ve created your events and funnels, you can instantly view all gathered data. Other analytics tools only begin collecting data once new funnels and events are created. In this case, It’s not uncommon to wait weeks to view the data. - Share recordings with timestamps and notes
Add a note to your recordings. For example, if you spot unusual or otherwise problematic behavior, you can tack on a note and share it with your developers (e.g., via Slack) so that they can fix it ASAP. - Additional information about a visitor
This includes information regarding a user’s operating system, resolution, and device. This is valuable information as there are often remarkable differences between iOS and Android user behavior.
Events
Think of events as the individual building blocks of an analysis. Events can be purchases, completing or unlocking levels (in gamified apps), page visits, etc. They can also be simple actions like clicks, taps, double-taps, pinching, scrolling — virtually any interaction a user can perform within an app.
The best tracking tools allow you to specify events and group them into categories: e.g., rage clicks, errors, link-related clicks, etc. Events can also be filtered by user characteristics and event types.
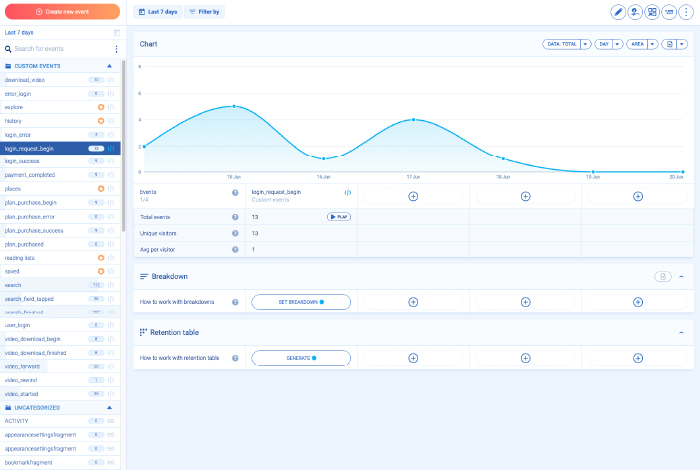
Smartlook events UI
Think twice about the events you intend to track if you want a reliable analysis complete with valuable data.
We recommend looking for “features within features.” By this, we mean a tool that includes additional add-on event functions. For example, Smartlook offers:
- Custom events
The possibility to define any screen as an event. Only you know which screens are important to you. You can even segment events with other information (custom property events). For example, you can zero in on the type of account (e.g., free version vs. paid subscription). - Event statistics
These show how users interact with your app over time. You can choose to view data from the last week, month, or year — any given period. - Recordings from events
An advanced analytics tool will allow you to play recordings of selected events. In other words, you can use events as a filter for your recordings. By doing so, you won’t have to watch recording segments that are not relevant at a given moment.
Tip: one of the best practices relating to event setup is to name each event in the following pattern: Object + Action. For example, “purchase completed” is clearer than “purchase.” This will alleviate any confusion.
Funnels
Think of funnels as a visual aid that depicts a user’s journey throughout your app, including in-app purchases, completed levels, and logging in and out. Often, a user’s journey is not as straightforward as you think. As we mentioned earlier: only you have in-depth knowledge of your app — what’s clear to you may not be so apparent to the average user.
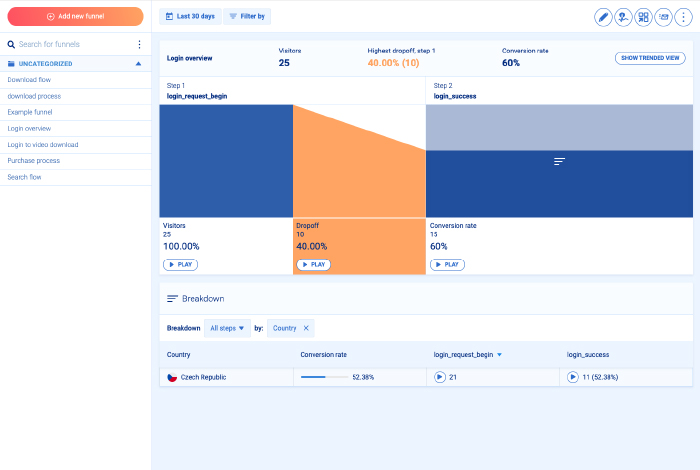
Smartlook Funnels UI
Funnels help you identify your app’s strong points and weak points. This can help you identify the exact point users tend to drop off. Perhaps they’re confused about what to do next? The data collected from funnels is indispensable when optimizing and improving your app.
Common examples of funnels include:
- App registration
It usually looks like this: a user sees the welcome screen, taps the “register” button, fills in the registration form, then logs in for the first time. - Purchase
Whether an e-commerce or gaming app, there are typically purchasing options. Insight into how users navigate the purchasing process is vital. - Event-based funnels
These can be helpful when implementing a new function. For example, let’s say you set up a new filter that allows users to filter goods according to price. You’ll want to create two funnels, both leading to making a purchase: one for users who filter according to price and the other for users who don’t. Simply compare and analyze them to determine whether the new filter has positively affected your conversion rate.
Another useful feature included with advanced mobile analytics tools is the ability to create funnels retrospectively. With automatic event tracking, advanced analytics tools can collect data automatically. Even if you’ve just created a funnel, it will show you how it’s working immediately, based on data collected in the past.
Heatmaps
Mobile heatmaps are a great way to visualize aggregated data within a single image. A heatmap displays all user interactions, including swipes, button taps, scrolls, etc.
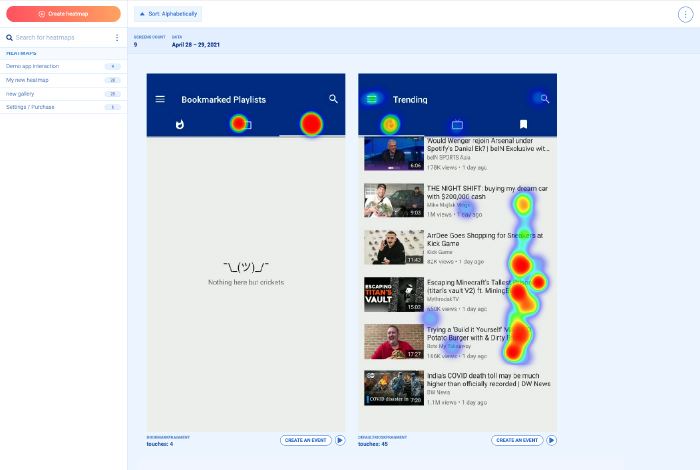
Smartlook heatmaps UI
An overlay of colors depicts which parts of the screen users interact with the most and which are neglected. Colors can variate by hue or intensity. For example, in Smartlook, areas that experience the most interaction are displayed in bright red. Green represents less interaction, and blue expresses little interaction. The intensity of these colors changes according to the level of user engagement.
Heatmaps are a valuable tool when it comes to improving the user experience. They allow you to:
- Easily visualize your app’s interface
- See how users engage with interactive and non-interactive elements
- Confirm or deny any hypothesis relating to user interaction
- Form ideas about making your user interface more intuitive
- Come up with ways to increase conversions.
Click here to study some actual scenarios where heatmaps came into play.
Technical parameters of mobile analytics tools
When choosing the mobile analytics tool that’s right for you, we recommend thoroughly inspecting its main features first, including session recordings, events, funnels, and heatmaps.
Check all available software development kits before settling on an analytics tool. (We’ll talk more about software development kits in the next section.)
You should also consider other properties and tools for quantitative and qualitative analysis of a particular mobile analytics tool.
From a more technical point of view, these can include:
- API integration
Smartlook offers over 50 integrations making it the perfect match for plenty of other tools you may be using. Smartlook interconnects with Slack, Google Analytics, Shopify, WordPress, WiX, and more. Here’s a list containing all of Smartlook’s plug-ins and integrations. - Advanced crash reporting
Smartlook identifies crashes autonomously and allows you to review them in real time. Conveniently, recordings begin 5 seconds before a crash occurs, so you don’t have to watch the entire session — just the parts that interest you. - Secure database
Is all data collected by mobile analytics tools secure? For example, Smartlook stores its data on a secure cloud server. Be sure to inquire about acquired data and how it’s stored before settling on an analytics tool. - Look for an analytics tool that features custom properties that you can set up.
From a customer’s point of view:
- Does the mobile analytics tool you’re interested in have accessible (and preferably fast) customer support?
- No strings trial: It’s always a safer bet to test a tool before purchasing it. Preferably, this shouldn’t require your credit card information.
- Does the free trial enable you to test all functions? Sometimes, free trials are limited. For example, they may limit the number of session recordings you can view in a day. You won’t get the complete picture of how a tool operates with limited functionality. We recommend choosing a tool equipped with a free trial that enables you to test all functions to the max.
- Does the analytics tool that you’re interested in have sufficient (or more than sufficient) educational resources? Smartlook, for example, has an entire section on its website (Smartlook school) where you can find all of the answers you’re looking for regarding deployment.
- What’s the price point? Does the tool offer value for your money? Let’s be honest — a small local business probably doesn’t require the most expensive mobile analytics tool on the market. Take the time to define what needs to be measured before investing.
Mobile analytics tools: implementation
Even with the most advanced tools, implementation isn’t complicated. Every tool includes a comprehensive to-do list — all you have to do is follow it. Smartlook, for example, offers detailed guides for every operating system on its website.
Integrating a mobile analytics tool into your app is often done via a Software Development Kit (SDK). If you’ve never heard of them: picture an IKEA cupboard that comes unassembled, neatly packed into a box, including hardware, various tools, a foolproof manual, and a direct line to customer support.
Software Development Kit (SDK)
SDKs contain everything you need to integrate your mobile analytics tool with your app, including codes, tools, guides for developers, libraries, processes, and relevant documentation. Thanks to SDKs, setting up mobile analytics tools takes minutes.
Is there anything in particular to keep an eye out for when shopping for a software development kit?
Software development kits (SDK): properties
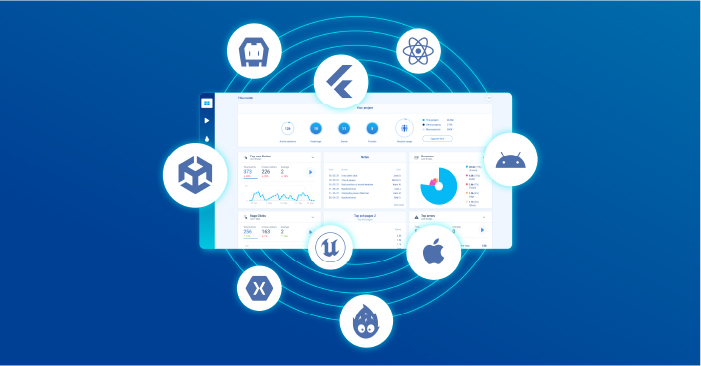
Most advanced mobile analytics tools rely on multiple software development kits (SDKs). Simply pick and choose based on your needs. Smartlook offers SDKs for popular operating systems (iOS and Android) and React Native, Unity, Unreal, Flutter, Cocos, Cordova/Ionic, and Xamarin. If your app runs on multiple platforms, check out this list of SDKs for various operating systems. To date, Smarlook seems to offer the most comprehensive selection.
When shopping for an SDK, look for a lightweight model. These don’t take up much space and won’t slow your device down. Smartlook takes two screenshots every second at 0.5 MB per minute. This makes it lightweight enough for state-of-the-art 3D games. As far as the gaming world is concerned, Smartlook is one of the best tools available. It even compiles screenshots into videos using a built-in recorder.
Some developers appreciate Smartlook’s wireframe mode which is even more lightweight as it doesn’t take screenshots but renders a wireframe instead. This feature is helpful for more “static” apps, like mobile banking applications and apps that are not overly complicated, graphics-wise.
User consent on mobile
If you own a mobile app, gaining user trust should be at the forefront of your business. Increase it by how you collect and store their data.

User consent on mobile
The list of data protection and privacy legislation worldwide is long. It’s up to you to understand the laws and nuances that apply to your circumstance. Familiarize yourself with laws including GDPR, CCPA, and LGPD. They’re the gold standard for the protection of consumer information.
Understanding how to collect consent under specific jurisdictions helps your business remain compliant. Also, apps must remain in line with application store policies, be sure to check App Store and Google Play policies.
When do you need to ask for user consent?
You should display users a consent box before collecting any data. Although workflows differ, the most common approach regarding mobile apps is to ask for consent the moment a user sets up their account.
If you plan to implement a mobile analytics tool that collects data, you need to ask for permission before collecting the following data:
- Names
- Identification numbers
- Location data
- Online identifiers
Users must be aware of what data you collect and why. Data collection for purposes such as a/b testing, analytics, remarketing, or on behalf of a third-party should remain separate. By default, consent boxes should remain unticked.
If your users don’t give their consent, they should still be able to use your app.
Let’s take a look at how you should collect user consent under GDPR. Recital 32 of the EU GDPR states that “Consent should be given by a clear affirmative act establishing a freely given, specific, informed and unambiguous indication of the data subject’s agreement to the processing of personal data […].”
Mobile analytics tools and user consent
Mobile analytics tools collect large quantities of data and store it in mobile SDKs.

Mobile analytics tools and user consent
Look for an analytics tool that follows privacy by design principles. Typically, such tools will provide you with several options that help you protect user privacy.
This includes:
- Obfuscation of native visual elements that may contain private information. This means password boxes and credit card details.
- Minimization of data collection (the wireframe mode option). Wireframe mode guarantees that end-users remain anonymous. It also masks sensitive fields in the session recording feature
- Hosting analytics data in a safe cloud environment. This could be Amazon Web Services in Europe or the United States
Note: your mobile analytics provider should never sell, use, or track your data across other apps.
Take Smartlook for example — after you implement the mobile SDK it’s your responsibility to start or stop recording your users. You can also make use of its open-source Consent SDK for iOS and Android. This enables you to collect user consent to gather data for analytics purposes.
The value of first-party data
First-party data is accurate. It gives you independence from third-party data. As you’re more in control of first-party data, remaining compliant with applicable laws is way simpler.
Collect first-party analytics data and combine it with other first-party data (e.g., from your CRM) to remain a step ahead of the competition. Using first-party data for reporting and data analysis purposes ensures it remains at the forefront of the decision-making process.
Data privacy and security
With such a big emphasis on user consent when collecting data, it goes without saying that all collected data must be protected and secure. Advanced mobile analytics tools use various methods to keep this promise, including:
- Encryption
SSL/TLS encryption (Secure Sockets Layer/Transport Layer Security) - Secure Data Storage
Smartlook’s infrastructure is hosted by AWS, which is ISO27001, and SOC2 certified. All data is backed up daily to assure security. (SOC2 certification is the highest standard in data security, similar to GDPR concerning user consent.) - Secure Account Accessibility
Ideally, access to a mobile analytics tool’s account should be authenticated with passwords stored in a hashed format. Authentication is required to access any internal resources.
7. Mobile app analytics: case studies
Developers, digital marketers, product managers, and customer support professionals are often so busy collecting, measuring, and comparing data that they forget to stop and think about interpretation. We’ll admit, it’s not always an easy task. But you don’t want to rely on assumptions and lucky (or not so lucky) guesses.

Mobile app analytics case studies
On that note, we’d like to add a few words on analyzing user behavior.
Mobile analytics tools provide the perfect base for analyzing user behavior. Without such data, understanding and interpreting user behavior is very limited. Instead, you would have to rely on intuition or unreliable questionnaires.
Analyzing user behavior with mobile analytics tools allows you to:
- Understand your users. Learn as much as you can about them. Who they are, what they do, etc. From here, create a marketing persona.
- Understand your users’ needs. What is the overall goal for your users? What do they wish to accomplish with your app? Can they achieve this goal quickly? Do they appreciate it?
- Analyze your app’s performance. Are there common patterns that stand out in cases where users fail to complete a desired action? If so, you need to ask yourself why.
- Spot weak areas. We mentioned rage clicks earlier, but they’re the perfect example of weak spots that need to be addressed ASAP.
- A/B test. Whether you like it or not, any new feature should be A/B tested to ensure success. It can be costly, but it will be worth it in the end.
- Always analyze and interpret data based on your business goals. Don’t hesitate to reconsider them if necessary.
Let’s look at some use cases that illustrate how mobile analytics tools help your app succeed.
Gaming apps
Vertigo Games, a game development company based in Istanbul and Tallinn, states that Smartlook saves them roughly 10 to 12 hours of development time on each new release.

Vertigo Gaming
Before deploying Smartlook, they struggled to locate drop-offs in their game funnel. At first, they attempted to find them independently (without an analytics tool) — a time-consuming process consisting of lots of trial and error. Their funnels are lengthy (some consisting of 60 steps) and include many variations, such as upgrade popups, show offers, game tutorials, etc.
With Smartlook, Vertigo Games can immediately spot when the drop-off rate increases and pay special attention. The funnel now points them to the exact point in the game where this occurs. In addition, Vertigo Games say they appreciate Smartlook’s SDK as it’s very lightweight and a “time saver in terms of development.”
Payment apps
AstroPay is a fintech payment application. They use Smartlook to help them analyze user behavior. Initially, they relied on Smartlook to assist them with their native app and Hotjar to help with their web applications. They quickly learned that switching between tools was complicated and confusing. Eventually, they opted to use Smartlook to assist them with their web and mobile app (Hotjar didn’t offer an analytics tool suitable for native apps).

AstroPay
AstroPay’s main concern was its sales funnel. After observing user data collected by Smartlook, they determined that most users were dropping off at the first step in their 3-step sales funnel. Based on these observations, AstroPay set to work optimizing their funnel, making it more straightforward. They recently stated that their drop-off rate has decreased by 42.72%.
Improving their sales funnel was not the only achievement attributed to Smartlook. It also helped increase the conversion rate in cryptocurrency purchases by 56%.
Interested in the details of these achievements? Read the entire case study here.
Social media management apps
A Finnish company, Hookle, developed a social media management app for Facebook and Instagram. They developed their app using Flutter, a development kit that not many mobile app analytics tools support.

Hookle
Their app needs to work smoothly and enable users to interconnect various social media accounts easily. The onboarding process involves setting up a Hookle account and connecting it with social media. This is crucial — if it fails, users may never return. Hookle appreciates Smartlook’s session recordings as they can easily observe user behavior throughout the onboarding process, spot potential problems right away, and fix them. According to Hookle, they now save 10 hours a week locating bugs and reproducing them thanks to Smartlook.
Furthermore, they say that Smartlook consistently allows them to improve their user experience and has helped them build a more intuitive user interface, which is their ultimate goal.
8. Conclusion
We hope you’ve enjoyed reading our complete guide dedicated to setting up mobile app analytics tools and using them to the maximum of your ability.
As this guide has been quite lengthy, we’ve summarized the essential takeaways below:
- Know your business goals. If you don’t know them yet, take your time to think them through
- Don’t rely on guesswork. Instead, rely on valuable data to make good decisions
- Start with a few KPI metrics, then gradually add more over time
- Engage KPI metrics from all main groups
- Approach your KPIs holistically. See the big picture
- Choose your mobile app analytics tool carefully. Don’t rush it
- Pay special attention to user consent and data protection/privacy
- Learn to interpret collected data meaningfully
When selecting a mobile app analytics tool, download the free trial first (preferably a full version, without limitation). Access Smarlook’s free trial below.
