Over the last few years, IT and product teams have realized that traditional monitoring and observability tools don’t paint a complete picture of their users’ experience.
That’s because these traditional solutions are built to monitor app performance from a technology point of view, not from the end user’s perspective.
And nowadays it’s becoming increasingly difficult to tie these technical data points to the actual user experience.
For example, a traditional monitoring solution can give you information about your app’s infrastructure, uptime, outages, or other similar details. At the same time, users may be having a totally different experience with your app, depending on their device, location, network, and many other factors. This can lead to problems that directly affect business outcomes, such as users on a specific device not being able to submit a form or complete a purchase, for example.
But without data about the end-user experience (which traditional monitoring tools weren’t built to collect), you’re in the dark when it comes to finding and fixing many of these issues. In that sense, traditional monitoring tools only tell half the story, which is where digital experience monitoring comes in.
Digital experience monitoring (DEM) — a term popularized by Gartner in their Market Guide for Digital Experience Monitoring — refers to monitoring application performance and functionality from the end user’s perspective. The end user can be anyone interacting with a digital product — a website visitor, a customer of an e-commerce app, an employee using a company tool, and so on.
In this guide, we’ll discuss the benefits of DEM, as well as the importance of both synthetic and real-user monitoring technologies. We’ll also explore the emergence of a new technology inside the DEM stack — session recordings (or session replays).
Lastly, we’ll review four tools with DEM capabilities — Smartlook, Datadog, Dynatrace, and ThousandEyes.
Here’s everything covered below:
- The benefits of DEM
- The technologies that make DEM possible
- How session recordings enhance traditional DEM solutions
- 4 tools with DEM capabilities (quick review)
Smartlook records everything users do on your website or mobile app and shows you their exact experience via session recordings. Additionally, Smartlook’s crash reports (available for Android apps), DevTools, and anomaly alerts can help you find, fix, and get notifications about potential user experience problems.
Schedule a free demo or try Smartlook today with our full-featured, 30-day trial: no credit card required.
The benefits of DEM
While each organization and team can get different benefits from adopting DEM solutions, three of them apply across the board:
- DEM provides an understanding of users’ actual experience, as well as visibility into app performance from their point of view. This is perhaps the biggest promise of the entire DEM solutions market. You get an end-to-end picture of users’ experience with your product, allowing you to pinpoint problems and evaluate their impact on your bottom line.
- DEM helps find, prioritize, and fix performance problems. Because DEM solutions focus on the users’ point of view, they allow IT, development, and QA teams to start troubleshooting by determining if the device, network, or app is causing the problem. This makes it much easier to isolate and prioritize performance problems.
- DEM gives employers and IT teams visibility into the endpoint, network, and service, regardless of their workers’ location. As we said, in the context of DEM, the end user of a service is often an employee interacting with company resources. Because many employees today work from home, from coffee shops, or from coworking spaces, having visibility into these interactions is crucial in terms of user experience and security.
The technologies that make DEM possible
DEM’s emergence over the last few years was made possible by many different technologies, which we can place in two broad categories:
- Synthetic monitoring, which refers to using scripts to simulate user behavior across device types, geographic locations, network conditions, and other variables. Synthetic monitoring solutions typically work via a robot app installed on a device or browser. This app simulates user behavior and sends back data about your product’s performance under specific circumstances. Synthetic transaction monitoring (STM) is another commonly-used term for this process. In general, synthetic monitoring can be very useful for observing system availability and detecting problems during the development process.
- Real-user monitoring or RUM (sometimes called end-user experience monitoring or EUEM), which refers to collecting data from real users interacting with an app. RUM solutions typically use a JavaScript snippet to collect real-time data about page load times, HTTP requests, response times, events, app crashes, and more. This data is invaluable for finding problems that affect the customer journey and experience, as well as for performing root cause analysis. This makes RUM ideal for finding problems that affect the user experience for apps that are in production. In the context of analyzing employee experiences, this category also includes features for monitoring endpoints, i.e., desktops, laptops, smartphones, servers, and other computing devices.
Again, the goal of combining all of these technologies is to understand the actual user experienceby getting an outside-in perspective into application problems.
This is something that behavior analytics tools have done for years, although typically with less focus on the technical aspects of app performance. And recently, a key technology that’s traditionally been a part of behavior analytics solutions has entered the DEM mix — session recordings.
How session recordings enhance traditional DEM solutions
Session recordings (sometimes called “session replay”) show you how users interact with your app in production, from the moment they open it, to the moment they close it. This makes them valuable for finding and fixing problems that can only be seen from a user’s point of view.
For example, the screenshot below shows a session recording in Smartlook:
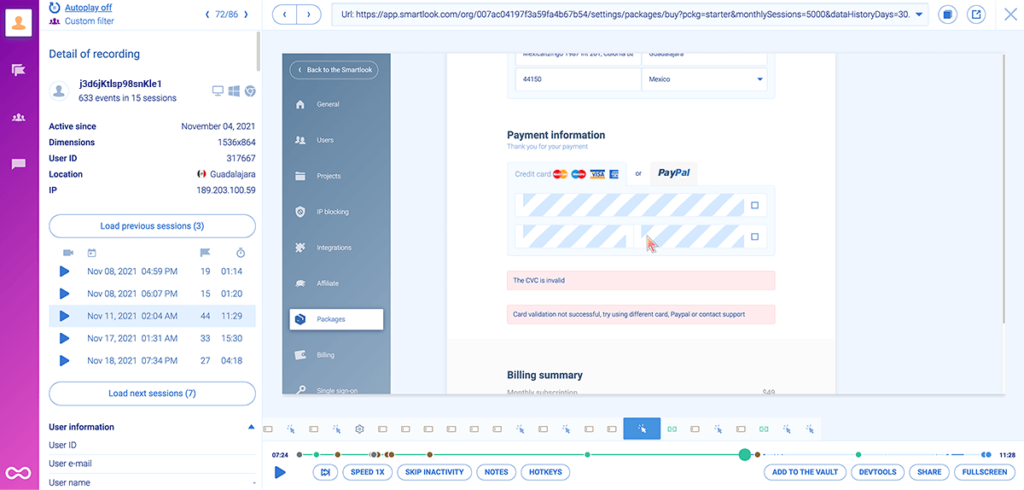
As you can see, the session replay shows a user navigating through a checkout flow and encountering an error. By itself, this information is important for marketing, product, and UX teams as it provides useful behavior insights.
But there’s also additional information that helps you find and fix technical problems:
- To the left of the session replay, you can see the user’s device, operating system, and location, as well as all their other recorded sessions.
- Under the session replay, there’s a timeline of all the events the user triggered, like clicks, pageviews, and text inputs. While Smartlook tracks many events automatically, we also support custom JavaScript events for tracking pretty much any other action, such as when users receive a notification, when they log in, etc.
- The DevTools section has information about network activity, JavaScript errors, console logs, warnings, and more.

Put simply, because session recordings show your users’ actual experience with every interaction in it, you don’t have to rely solely on what you see from the code execution data on the back end.
Due to their usefulness, session recordings are becoming a staple in DEM.
For example, Datadog — a popular observability service for cloud-scale apps — introduced a session replay feature in 2021 to help organizations build better digital experiences.
Dynatrace — a platform that combines deep observability, AIOps, and application security — also launched a session replay product in 2019 as part of their digital experience management offering.
At Smartlook, we launched our session recording feature in 2016. Since then, thousands of organizations have used it to gain an in-depth understanding of their users and the problems they encounter.
Based on our experience, we’ve seen two massive benefits of combining session recordings with traditional DEM technologies.
#1 Speed up debugging and fix more bugs
Bugs and app crashes are two of the most common issues that hurt the user experience. However, most tools for detecting them have a blindspot — they only show where something went wrong in your code, but not the exact circumstances in which problems occurred.
This forces dev and QA teams to rely on a combination of user explanations and trial and error to reproduce crashes. For example, let’s say a user reports a bug that you haven’t encountered before. The traditional approach in these cases is to ask them a bunch of questions, like:
- When did the bug occur?
- Has it happened before?
- What were you doing immediately before it occurred?
Based on their responses, you’d then try to reproduce the bug.
Besides being annoying for users, this troubleshooting method often doesn’t produce a result due to the lack of necessary context for IT, dev, and QA teams.
Session recordings help you avoid this problem by simply showing you everything users did leading up to a bug.
For example, say you’re using Smartlook’s crash reports (available for Android apps) to track app crashes. Crash reports provide a list of all app crashes, grouped together by the first three lines of the stack trace.
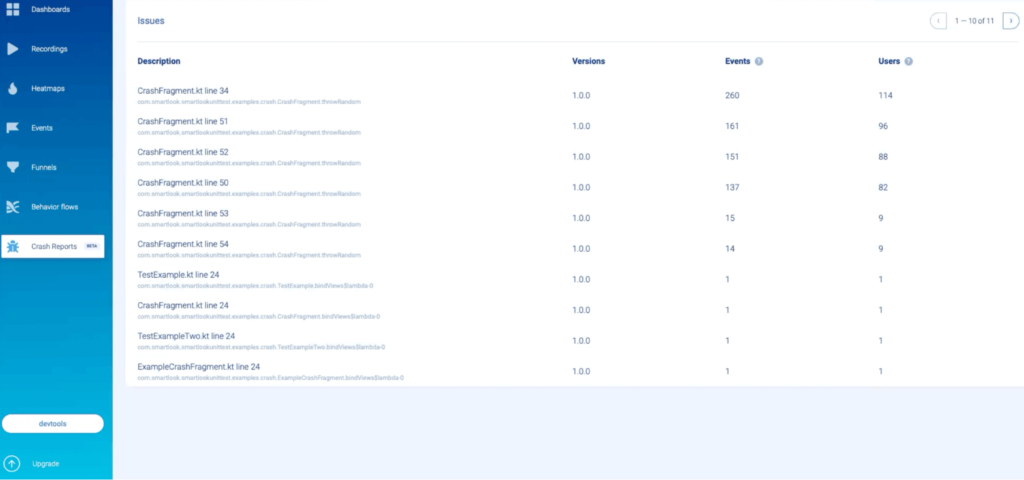
You can see information about the version (or versions) of your app where a crash occurred and the number of users that were affected.
To get additional information, you can click on a crash fragment. This takes you to a new screen with the entire stack trace and details about the number of sessions this crash happened in, the user’s country, platform, device, and date.

All of this information is useful for debugging, but it’s often not enough to find the root cause of problems that are only visible from a user’s point of view.
That’s why Smartlook lets you watch all session recordings where a crash happened by clicking on the “Play session” button above the stack trace.
Having a stack trace and relevant session recordings allows dev and QA teams to:
- Debug much faster, since they don’t have to reproduce problems via trial and error or rely on users’ explanations. Instead, they can see how the crash happened (via the session recording) and where it occurred (via the stack trace). Plus, they get other useful details, such as the user’s device, operating system, location, and more.
- Fix crashes and other bugs that would otherwise remain unsolved. For example, say you have a finance app that crashes when users open a feature and try to turn on the camera. Without session recordings, you’d only see that the crash happened on the line of code where the camera was initialized. When that information isn’t enough for debugging, the bug goes into the non-reproducible pile. But with session recordings, you can find details that would’ve been impossible to spot without seeing the user’s point of view. For example, you might see that the user disabled permissions for the camera, which the app can’t handle correctly and crashes as a result. These details help you resolve bugs that you couldn’t have with a stack trace.
Additionally, Smartlook also has an Identify API, which can help you instantly find session replays of users who reported a bug.
You can use this API if your site or app collects user identification details, like username or email. When the API is set up, the identifier will show up in users’ session recordings (as you can see in the lower left-hand corner.)

As a result, once the Identify API is set up and a user reports a bug, you simply look up their session recordings and see the problem from their point of view.
#2 Making UX insights available to everyone in the organization
Most of the DEM technologies we mentioned — like synthetic and endpoint monitoring — are used exclusively by IT operations, dev, and other technical teams because these technologies require specialized skills to implement and utilize. However, the high barrier to entry also prohibits everyone else from taking part in the DEM process.
At the same time, empathizing with users, ensuring customer satisfaction, and finding ways to optimize the UX should all be company-wide initiatives, which is hard to establish when insights are available only to some teams.
In that sense, session recordings bring something unique to the table — anyone can watch them and easily see the problems that users face. Product managers, UX researchers, digital marketers, and customer support professionals can all use the insights that session recordings provide in their day-to-day. This makes it easier for teams to collaborate and create better experiences, based on their shared understanding of the problems users are facing.
4 tools with DEM capabilities (quick review)
Because DEM is such a broad field, there isn’t one complete digital experience monitoring solution that covers every technology or use case.
This is something Gartner mentioned in their 2022 Hype Cycle for Monitoring, Observability and Cloud Operations:
“There are very few DEM vendors that provide functionality across all three pillars of DEM (synthetic monitoring, endpoint visibility and real-user monitoring), making it difficult to choose a vendor that can provide a complete solution.”
That’s why in this section, we’ll look at four solutions that offer various DEM capabilities, like synthetic monitoring, crash reporting, session replay, and more.
#1 Smartlook
- Key DEM features: Session recordings, crash reports, DevTools, and anomaly alerts.
- Pricing: Smartlook has a free plan that captures up to 3,000 user sessions/month. Paid plans start at $55/month and come with a full-featured, 30-day free trial (no credit card required).
Smartlook is our platform that brings product analytics and visual user insights under one roof.
You can use it to analyze user behavior on websites, web applications, and native iOS and Android mobile apps built with popular frameworks and engines — including React Native, Cordova, Flutter, Ionic, Unity, Xamarin, and Unreal Engine.
As we said, Smartlook offers a few key DEM features:
- Session recordings, which show you users’ exact experience with your product, as well as details about their device, operating system, location, and more.
- Crash reports (available for Android apps), which automatically track app crashes and provide access to the stack trace and relevant session recordings for fast debugging.
- DevTools, which gives you technical data directly from users’ browsers, including network activity, console logs, JavaScript errors, and latency issues.
- Anomaly detection, which sends you notifications in case of a sharp increase or drop-off in the occurrence of events or in funnel conversion rates. This can help you react to issues in production before they affect too many users.
Lastly, Smartlook also has many other quantitative and qualitative features for analyzing the user journey, like heatmaps and funnels. We’ve discussed how to use these in other articles, so if you’re interested, check out:
- Our guide to tracking user activity on websites.
- Our guide to setting up mobile app tracking to analyze user behavior.
#2 Datadog

- Key DEM features: Session replays, customizable real-user monitoring (RUM) dashboards, and API tests for checking endpoint availability.
- Pricing: Datadog has different pricing models for each of its products. Their synthetic monitoring product starts at $7.20/month per 10,000 test runs for API tests and $18/month per 1,000 test runs for browser tests. Their RUM and session replay offer starts at $2.60/month per 1,000 user sessions.
Datadog is a monitoring service for cloud-based apps. It’s one of the leading APM and observability solutions, thanks to its extensive product set, ranging from infrastructure and network performance monitoring to distributed tracing, database monitoring, and log management.
As we said, in 2021 they upgraded their DEM capabilities (which already included synthetic monitoring, RUM, uptime monitoring, and more) by releasing a session replay feature. However, at the time of this writing, the feature is not yet available for mobile apps.
#3 Dynatrace

- Key DEM features: Session replays, front-end monitoring, synthetic monitoring, and real-user monitoring.
- Pricing: Dynatrace has different pricing models for each of its products. Their DEM offering starts at $11/month for 10,000 annual DEM Units. Synthetic, Real User Monitoring, and Session Replay all contribute to your DEM Units, so apps in production need much more than 10,000 annual units to monitor all users. Fortunately, the unit price decreases as your monitoring coverage increases.
Dynatrace is a software intelligence platform focused on observability, application performance monitoring, security, and AIOps. It supports all major cloud providers and technologies and provides metrics, logs, traces, distributed tracing, entity relationships, performance benchmarks, and behavioral data.
The platform is broken down into six modules — like Digital Experience (which includes synthetic monitoring and session replay), Infrastructure Monitoring, and App Security — which can be purchased separately.
#4 ThousandEyes

- Key DEM features: Endpoint agents for end user monitoring, scheduled network synthetics, WiFi visibility, and automated session testing.
- Pricing: Available upon request to their sales team.
ThousandEyes is a visibility platform that combines four products:
- Browser Synthetics, which simulates user interactions and provides detailed page metrics and waterfalls, as well as underlying network and Internet issues to help you find root causes of app downtime.
- Internet and WAN, which gives you insight into how Internet and WAN connectivity impacts the customer experience.
- End User Monitoring, which uses endpoint agents to help IT teams troubleshoot performance issues related to Wi-Fi, VPN gateways, and other sources, while also measuring key performance indicators like page speed.
- Internet Insights, which provides near real-time insights into the SaaS apps and networks that digital businesses rely on.
While ThousandEyes is one of the most comprehensive solutions for technical teams, it doesn’t have a session recording feature, which limits its potential use cases.
Start building your DEM stack with Smartlook
Smartlook lets you monitor how users interact with your website or mobile app and find points of friction that hurt their experience.
Our session recordings show you everything your users do, while the crash reports and DevTools provide the back end data necessary for debugging.
Our platform can be used on:
- Websites, including ones built with popular CMSs like WordPress, Joomla, and Shopify.
- Mobile apps built with 10 different native mobile app platforms, frameworks, and engines — including iOS, Android, React Native, Flutter, Unity, and Unreal Engine.
Additionally, Smartlook has integrations with tons of commonly-used tools and platforms, like Jira, Sentry, Intercom, Zendesk, Slack, and many more.
You can try Smartlook with a full-featured, 30-day trial (no credit card required).
If you don’t have time to set it up, but still want to see it in action, you can book a free demo using this form. Оur team will give you a detailed Smartlook presentation that’s tailored to your business at a convenient time for you.