There are two types of user activities that all website owners need to track: URL visits, to see which web pages users go to, and actions like button clicks or text inputs to see how users interact with a page.
By far the most popular tool for the job is Google Analytics (GA). While GA reports on lots of useful metrics — like real-time traffic, pageviews, sessions, and bounce rate — it has big limitations when it comes to tracking user actions, making it difficult to find user experience issues that hurt your conversion rates.
Specifically:
- GA doesn’t automatically track user interactions like button clicks and text inputs. Instead, it requires you (or a developer) to manually set up tracking on every element you want to analyze, like buttons or text fields. GA starts collecting interaction data after the tracking is set up, so there’s always a delay between realizing you need to analyze a particular action and having the data to do so.
- GA can only tell you what users do, not why they do it. For example, GA may show you that most users don’t complete their order after adding an item to their cart. However, you can only guess why that is, as there’s no way to watch these users’ sessions and see every interaction in them. For that, you need session recordings, which GA doesn’t offer.
In this guide, we’ll show you a much easier way to track user activity on your site with our tool — Smartlook. We’ll also show you how to quickly find insights for improving the user experience and your conversion rates.
Here’s everything you’ll learn to do:
- Track all your users’ activities automatically with session recordings
- Create heatmaps to see where users click, scroll, and move their mouse
- Analyze business-critical user actions and filter session recordings with events
- Build funnels to track users’ journeys through your site and calculate conversion rates
- Combine session recordings with funnel analysis to find why users drop off
- Track a cohort of users over multiple visits with Retention Tables
To start tracking user activity on your website today, sign up for a free Smartlook account (no credit card required). Our tool can show you what your site’s users do and more importantly — why they do it.
Track all your users’ activities automatically with session recordings
As we mentioned, GA (as well as many other user activity tracking tools) doesn’t offer session recordings and doesn’t collect user interactions automatically. Instead, it requires you to manually set up tracking for each element before it starts collecting user interaction data.
The lack of a session recording tool means you can’t watch users’ entire experience from their point of view. In other words, you can’t get the full context behind their behavior.
In addition, GA’s setup process for tracking user actions is slow and tedious, often requiring a developer. Plus, you also have to predict what you need to track in advance. If you don’t foresee an interaction you’ll need in the future, you’ll have to go through the tracking setup again and wait for data to accumulate.
In contrast, Smartlook starts recording all user sessions and interactions automatically once our code snippet is installed.
This means you don’t have to configure tracking separately for each element or manually start and stop session recordings. And, unlike some session replay and web analytics tools, Smartlook’s session recordings are always on, so they capture all your website traffic, not just a sample.
On that note, if you want to see how Smartlook compares to other SaaS session replay and website tracking tools (like Crazy Egg and Hotjar), check out our article on the topic.
Once our tool is set up, session replays start to appear in the “Recordings” tab in your Smartlook dashboard.
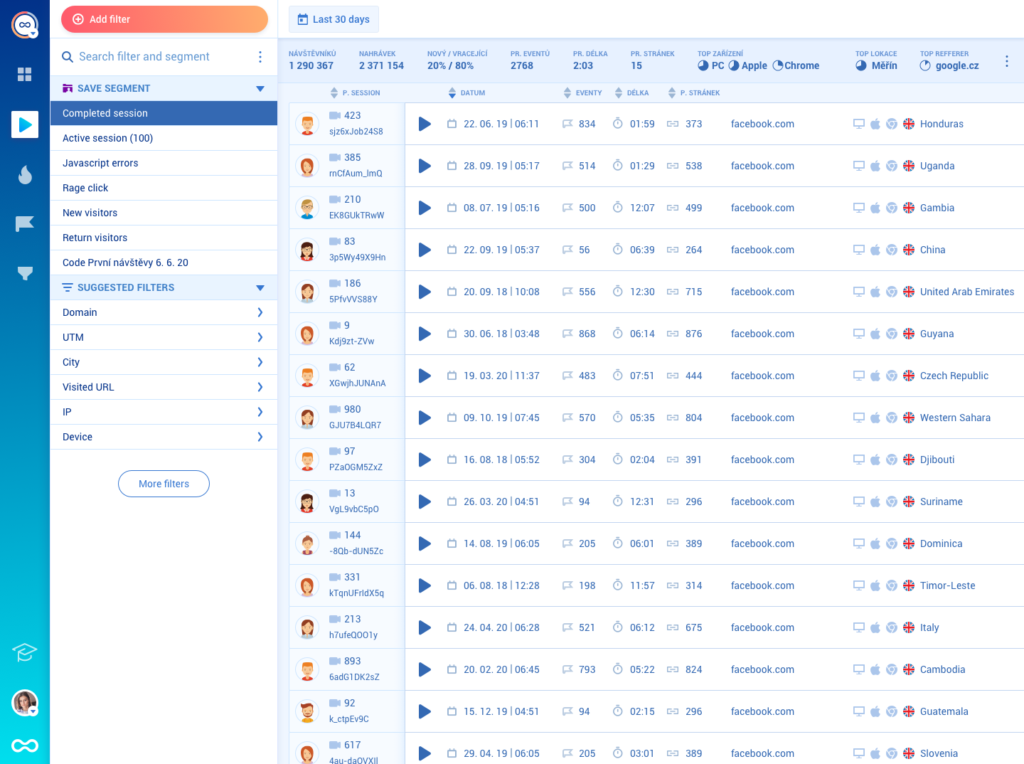
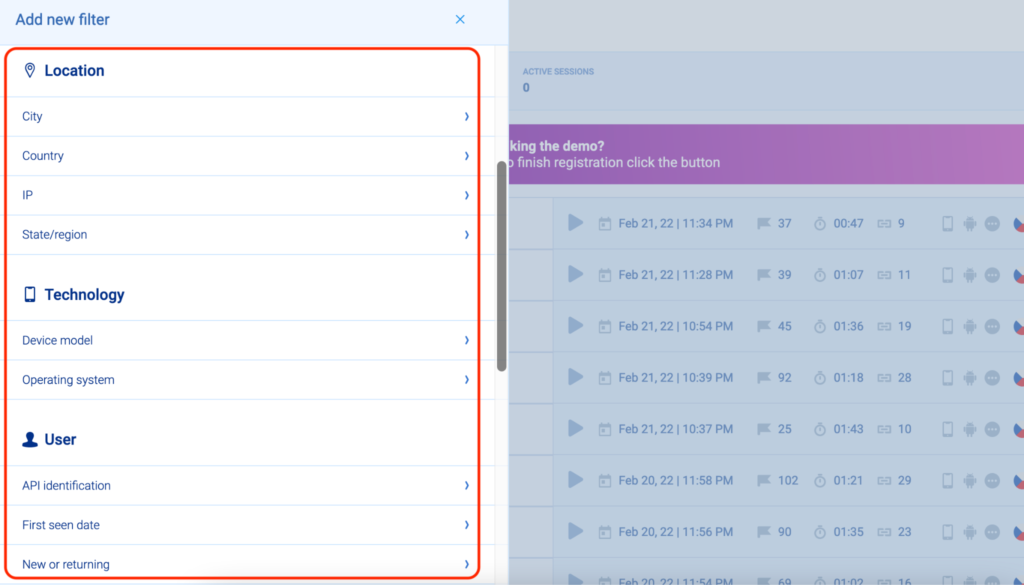
You can use 30+ filters to find relevant session recordings fast, like device, operating system, country, IP address, and more.
Smartlook automatically tracks JavaScript errors and rage clicks, so you can quickly find session replays of users who were frustrated or experienced an error. In fact, one of our clients used session recordings to find 15 bugs on their website in three hours.
Additionally, Smartlook offers you the ability to establish masks on input forms, effectively excluding sensitive user data from the transmission to Smartlook servers.
By recording all users’ sessions, our tool also captures every interaction, including URL visits, clicks, scrolls, mouse movements, and text inputs. You can use that interaction data to create heatmaps and analyze business-critical actions like CTA clicks or form submissions.
Create heatmaps to see where users click, scroll, and move their mouse
The term heatmap encompasses three types of tools — click maps (left in the screenshot below), move maps (middle), and scroll maps (right).
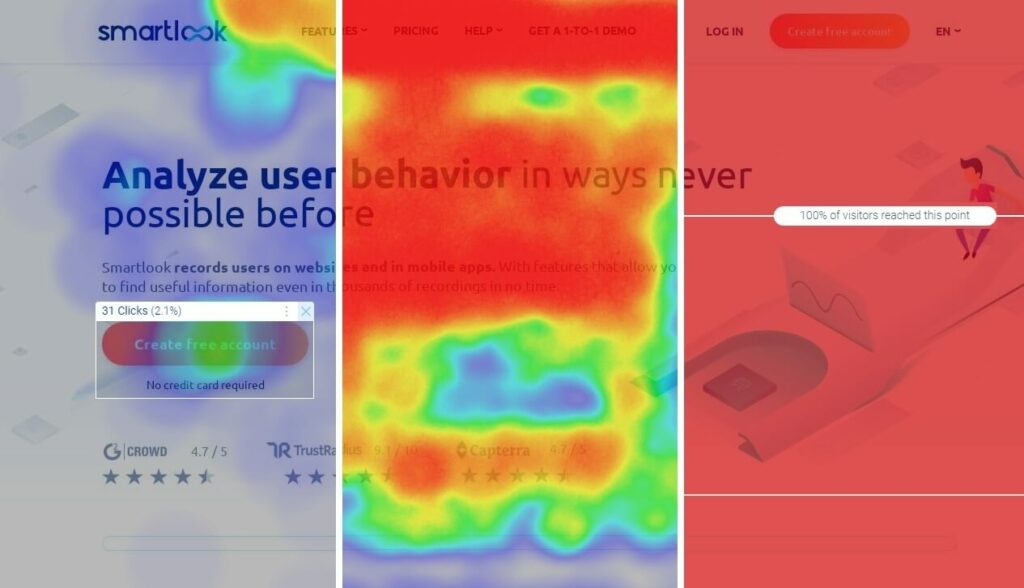
As you can see, these interactions are represented with a hot-to-cold color scheme, going from bright red (for the most popular parts on a page) to blue or gray (for the least popular ones).
Heatmaps are a great way to get an overview of the typical user experience on a page. For example, one of our clients’ scroll maps showed that most users weren’t scrolling enough to reach their “Go to store” button and client success stories. After moving those above the fold, they saw a massive click-through-rate (CTR) increase of 276%.
Heatmaps are also practical when comparing how design changes affect user behavior. Since design changes are usually based on a hypothesis (e.g., “moving our CTAs and changing their text should lead to more clicks”), comparing a heatmap of an old page versus a new one is a great way to get an overview of how real users’ behavior changes.
While heatmaps provide a useful overview at a glance, they’re also limited, as they only show aggregate trends. There’s no way to track an individual user’s interactions on your site and figure out how to improve their experience. For that, you need events.
Analyze business-critical user actions and filter session recordings with events
In the context of web analytics, an event represents an instance of a user interaction that you may want to track, such as a new user clicking on a button or filling in a form.
Again, with most tools, you need to manually set up event tracking for every type of user interaction (typically requiring the help of a developer), while Smartlook automatically collects all user interactions.
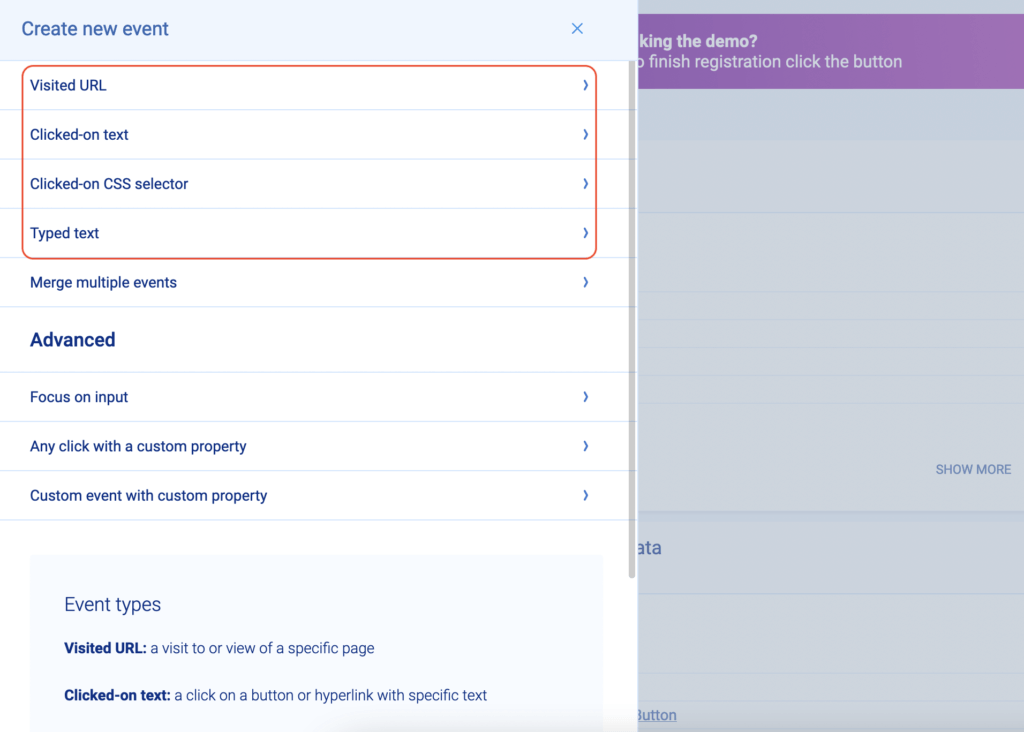
To add the user interactions that interest you to your Smartlook dashboard where you can track them, you have to define the events you want to analyze. You can do this without coding in one of three ways:
- Choose among pre-selected standard events: URL visits, button clicks, text input, or clicked-on CSS selector (allowing you to select any element on the page).
- Use the no-code event picker: This allows you to define an event by clicking on your website’s UI.
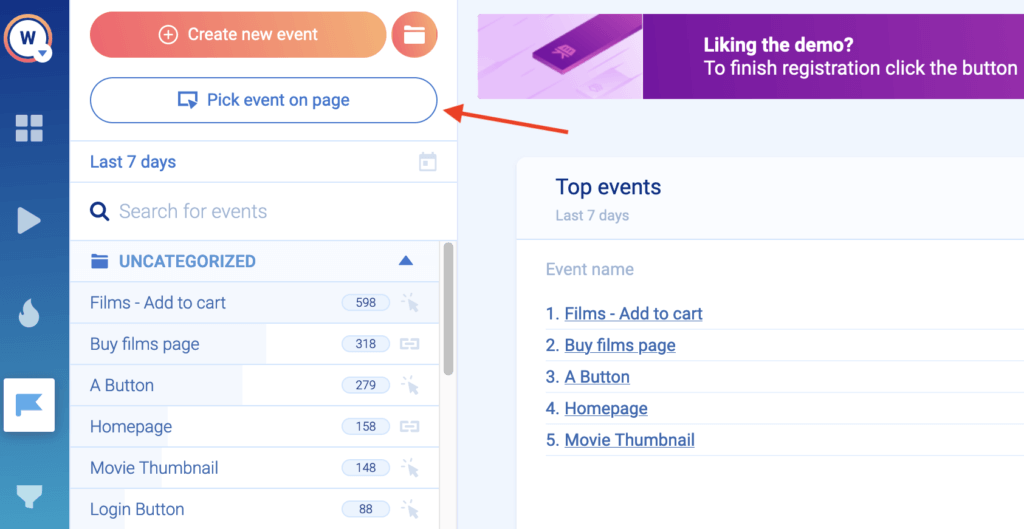
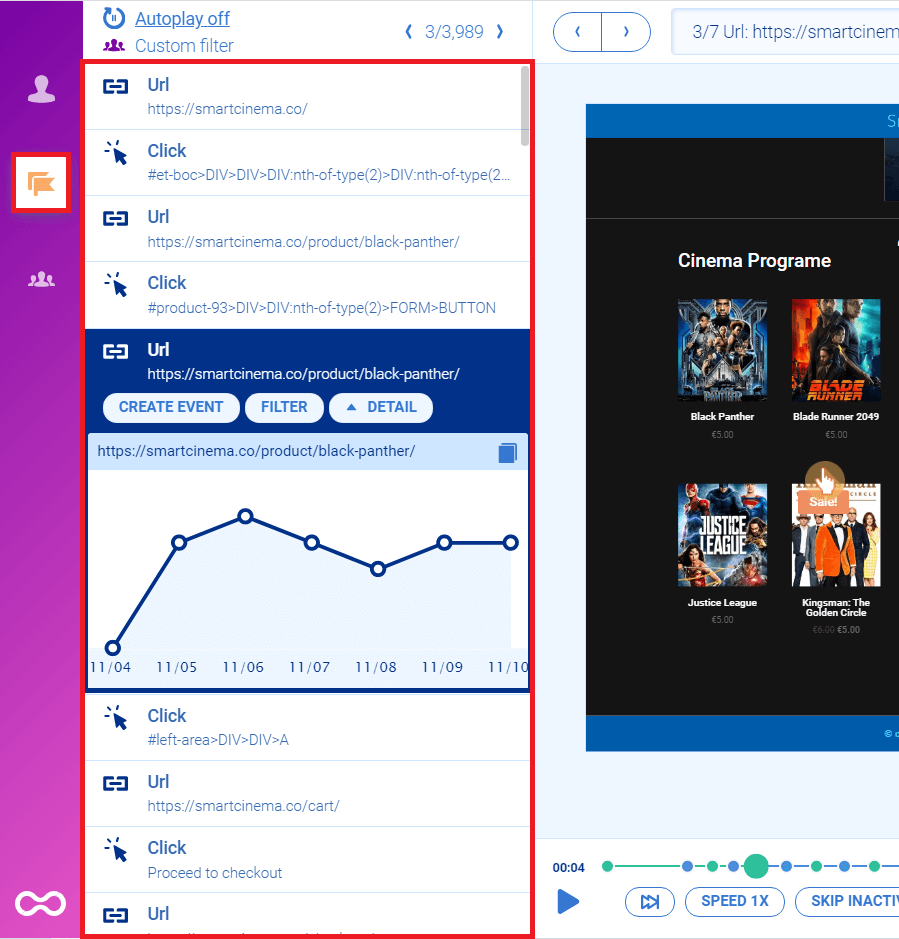
- Define events from user session recordings: While watching a recording, you can pause and turn an important user action into an event, without leaving the recording.
As soon as you create an event, it automatically gets populated with historical data, going back to the moment you added the Smartlook snippet (or as far back as your data retention plan goes).
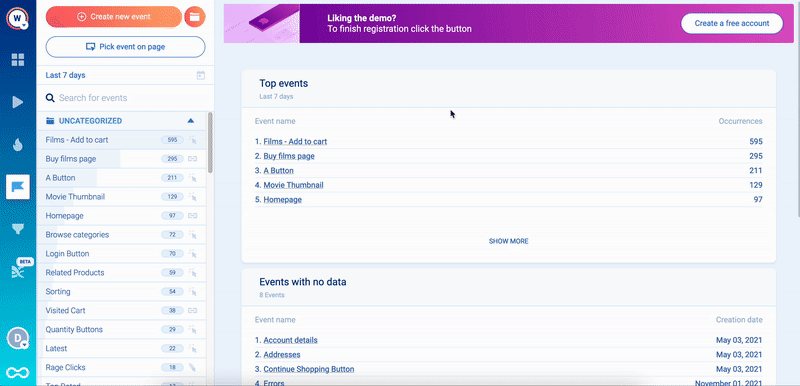
As a result, you can use historical data to find insights fast, without waiting weeks or months to gather new data. This isn’t possible in GA or other tools that don’t collect user interaction data automatically.
You can see how event tracking works in detail with Smartlook’s live public demo — no registration or credit card required.
Lastly, you can define custom events to track pretty much anything else outside of the standard interactions. However, you’ll need developer assistance, as custom events are created via JavaScript.
Here are the most important things you can do once you have your events in place:
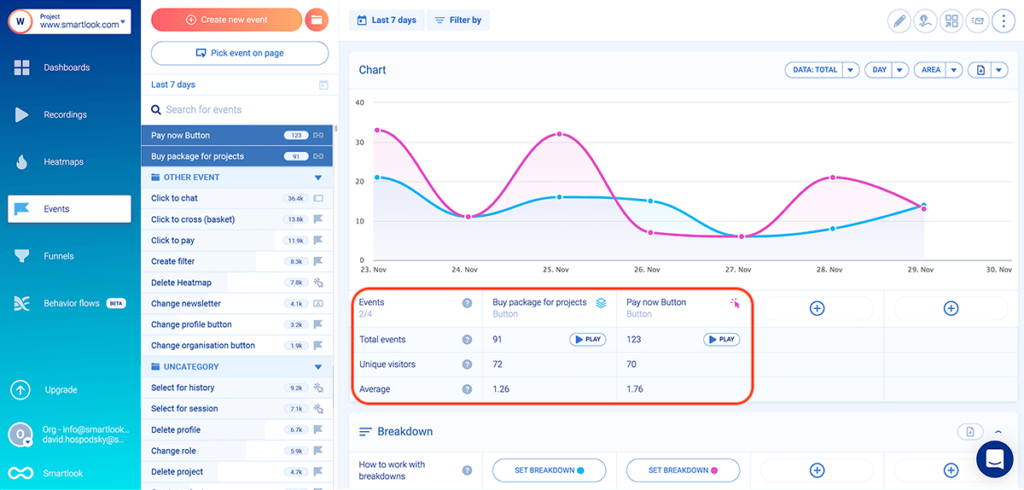
- Perform quantitative analysis. Event tracking lets you answer questions like “How many times was the CTA button on our new landing page clicked over the last month?”
- Filter session recordings based on an event that took place in them. Let’s say you want to watch only session replays of users who clicked on your site’s “Add to cart” button. By defining an event (in this case, a button click event), you can then use that event as a filter to show you only recordings of sessions where users clicked the “Add to cart” button. Just open the event and click on the “Play” button.
- Build funnels and calculate conversion rates. A funnel is a sequence of steps users take on your website before completing a goal, like purchasing a product or signing up for a newsletter. For example, an e-commerce store can set up a checkout funnel to find out what percentage of visitors who added an item to their cart (Event 1) and started filling out the checkout form (Event 2) completed their purchase (Event 3). This is a crucial capability for understanding your users’ experience, so let’s look at it in more detail.
Build funnels to track users’ journeys through your site and calculate conversion rates
Building a funnel in Smartlook is as simple as taking two events and placing them in the order you believe users follow. Once you do that, the funnel visualization appears instantly, so you don’t have to wait for new data collection.
A two-step funnel will automatically show you the conversion rate between those steps. But for most use cases, you’ll want to add more detail to the funnel, creating a step for each page and element the user would interact with between the two steps. Each interaction can push them further along the conversion path or cause a drop-off, and the benefit of funnel analysis is that it’s easy to pinpoint the exact user interaction that’s causing the most drop-offs.
Here’s how a funnel consisting of three steps looks in Smartlook:
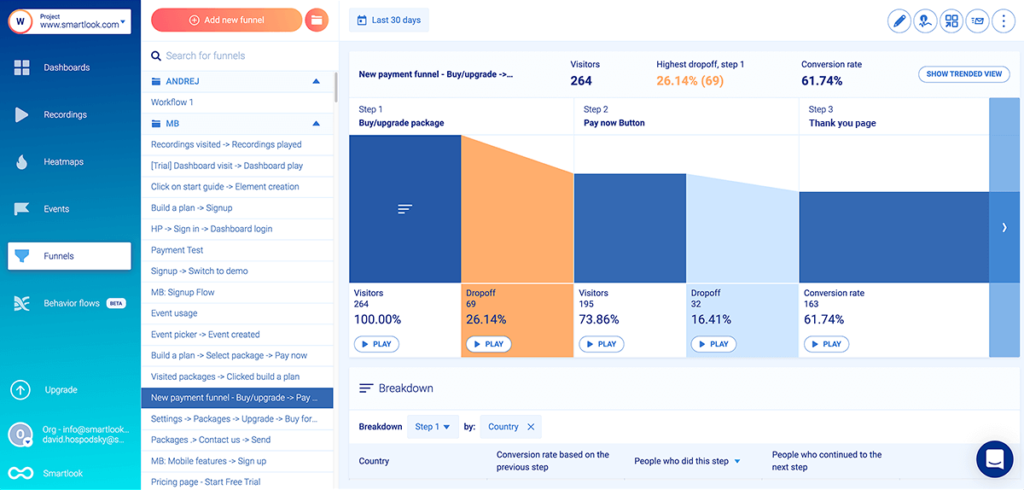
As you can see, the conversion rate of the entire funnel (in this case — 61.74%) and the drop-off rate between each step (event) is calculated automatically.
Let’s go back to our previous example of tracking users who add an item to their cart and see how you can analyze their behavior with funnels.
First, you can build a funnel to track these users with only three standard events:
- Event 1: A visitor clicks on the “Add to cart” button (select the button with our no-code picker to define the event).
- Event 2: They click on the “Pay Now” button (again, select that button with the no-code event picker).
- Event 3: They land on the “Thank you” page (use the “Visited URL” standard event and enter the page URL).
Once the funnel is created, you can see the overall conversion rate and the drop-offs between each step.
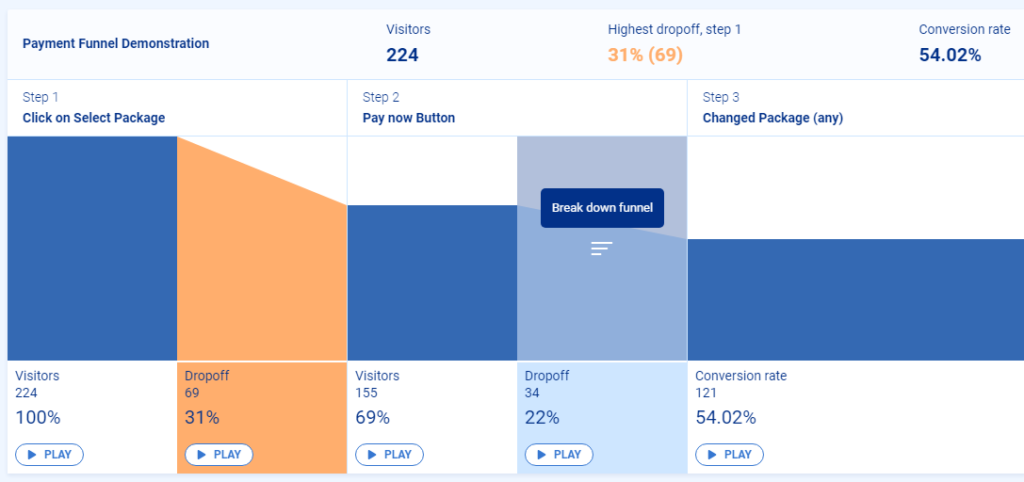
You can also break down every step or the entire funnel by specific properties to find even more valuable insights. When you hover over a step in the funnel, a “Break down funnel” text appears, like in the screenshot below.
Once you click it, you’ll be able to select from different parameters such as country, device, browser, operating system, and more. When you select a property (in the example below — browser), a breakdown table will appear below the funnel.
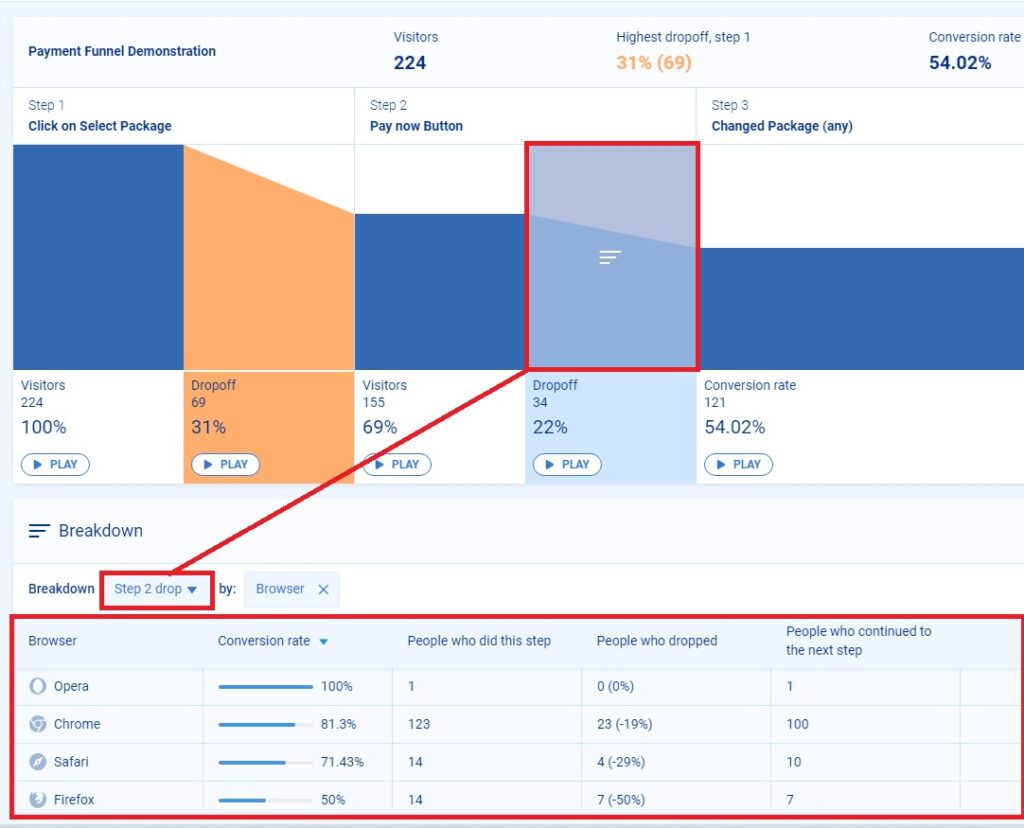
You can also break down the entire funnel by selecting “All steps” in the “Breakdown” section below the funnel and clicking the “+” button to select a property.
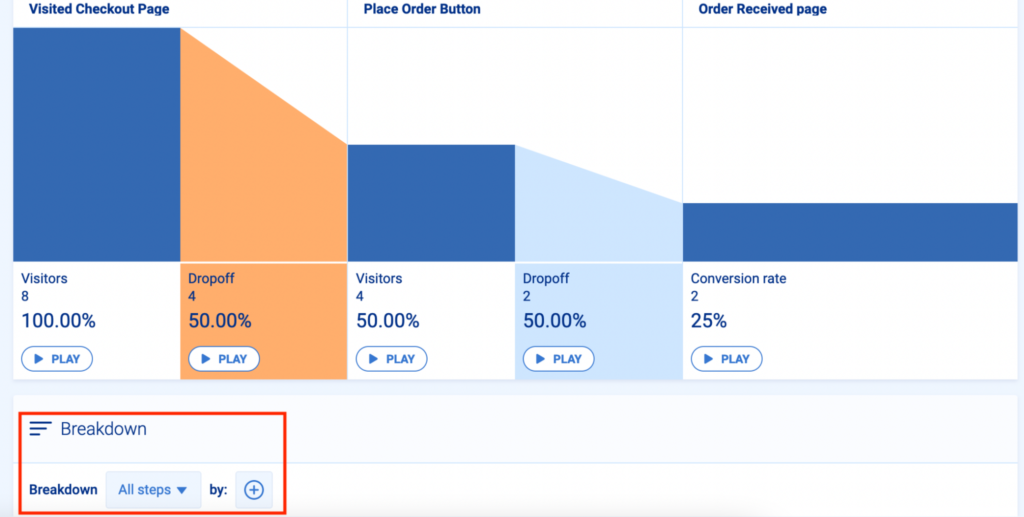
This is a great way to see whether a certain category of users converts or drops off at a higher rate. In our example, a breakdown might show you that website visitors who use the Opera browser have a much lower order completion rate than users on other browsers. This may indicate an incompatibility issue or another technical problem with the Opera browser.
You can analyze pre-made funnels, build new ones, and experiment with breakdowns withSmartlook’s live public demo — no registration or credit card required.
Additionally, Smartlook has a special feature called anomalies for monitoring the conversion rates of your events and funnels. Once you set up an anomaly for an event or funnel, you’ll get notifications in the app or via email whenever sharp drop-offs (or increases) happen.
After you’ve laid the foundation — tracking what users do with events and funnels — it’s time to use session recordings to see the full context behind their actions.
Combine session recordings with funnel analysis to find why users drop off
Combining session recordings with funnel analysis lets you see why users drop off, so you can improve their experience and your conversion rates.
Here’s how.
Let’s go back to our previous example of the three-step checkout funnel.
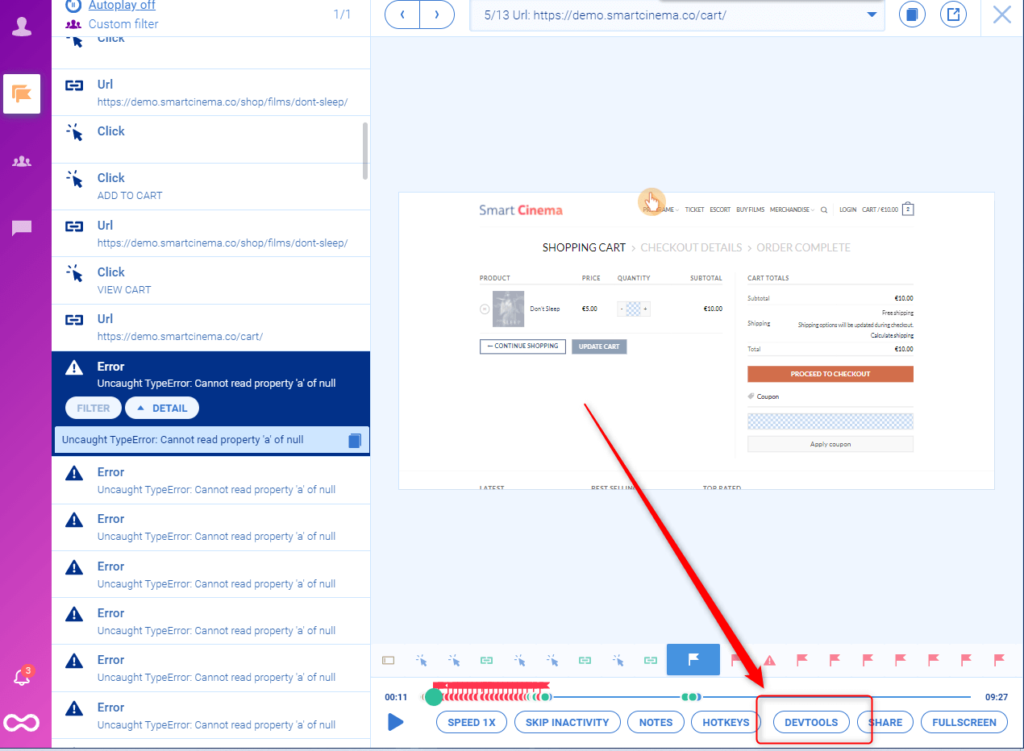
As you can see, 32 users (16.41%) drop off between clicking “Pay now” and landing on the thank you page. In theory, there shouldn’t be any drop-offs here — users who clicked “Pay now” clearly want to buy, so if they didn’t arrive on the “Thank you” page, there’s a problem.
Similar to the events section, there’s a “Play” button under each step of the funnel, including the drop-off stages. Clicking that button under that drop-off stage between steps two and three takes you to the session recordings of these 32 users, so you can find out why they dropped off. As a result, you save lots of time and effort, since you don’t have to sift through all 195 sessions of users who clicked “Pay now.”
Drop-offs between these two steps are often caused by technical issues like JavaScript errors. As we said, Smartlook tracks these errors by default, so you can send the relevant session replays to your developers, who can debug the issue fast, as they don’t have to guess why it happened. They can also investigate it in more detail by clicking on the “DevTools” button.
One of our fintech clients — AstroPay — used this ability to combine funnel analysis with session recordings to improve their sales funnels and boost conversions on their website and mobile app.
They first built out their events and funnels to map their users’ purchase flow, allowing them to see where most of the potential buyers dropped off. Then, watching the session recordings of users who dropped off helped them find opportunities for improving their conversions.
Specifically, session replays showed two vital insights:
- Users who didn’t have their local currency in their e-wallet had to take extra steps to buy a cryptocurrency.
- Users spent three-to-five minutes searching for newly purchased cryptocurrencies in the wallet, not realizing that the transaction was still pending.
By fixing these issues, AstroPay was able to optimize their cryptocurrency purchase funnel, increasing conversions by 56%.
Track a cohort of users over multiple visits with Retention Tables
For many web and mobile applications and games, daily user retention is an important success metric to track. Smartlook lets you track user cohorts over time and calculates retention for you with Retention Tables.
Here’s how to create a retention table in Smartlook:
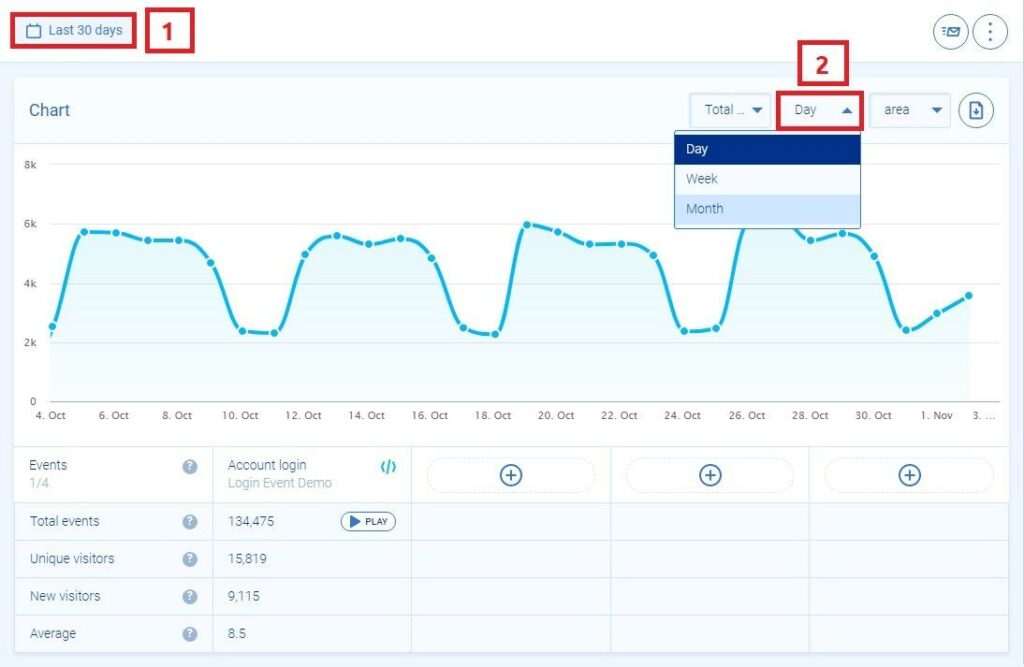
First, select the event for which you’d like to analyze retention.
Once you have your event, you can select (1) the data range and (2) decide whether to analyze the data by day, week, or month.
Next, scroll down to the “Retention table” section, click on “Generate”, and you’ll see a retention table similar to this one below.
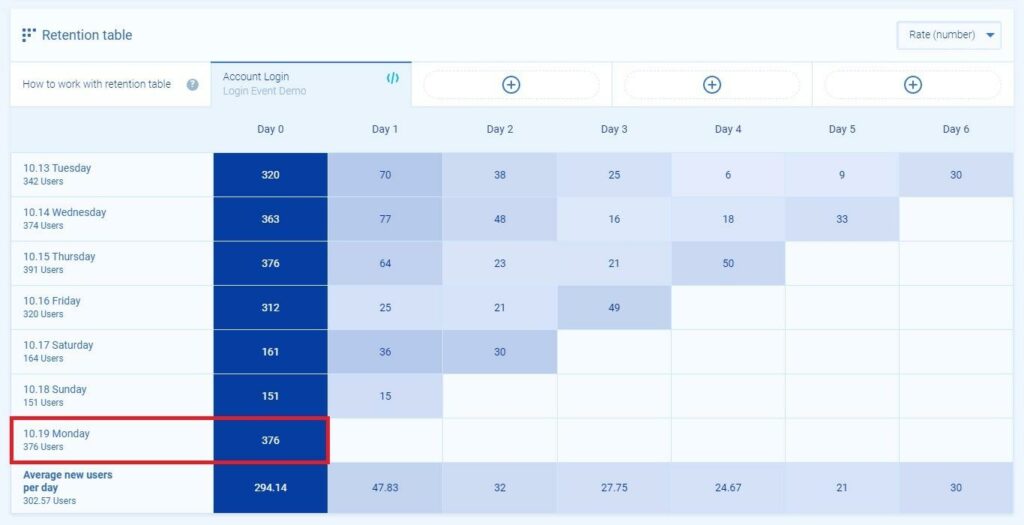
In the screenshot above, you can see that 376 users completed the “Account Login” action on Monday, 10.19, which is Day 0 for this retention table. After 5 days, the example retention table looks like this:
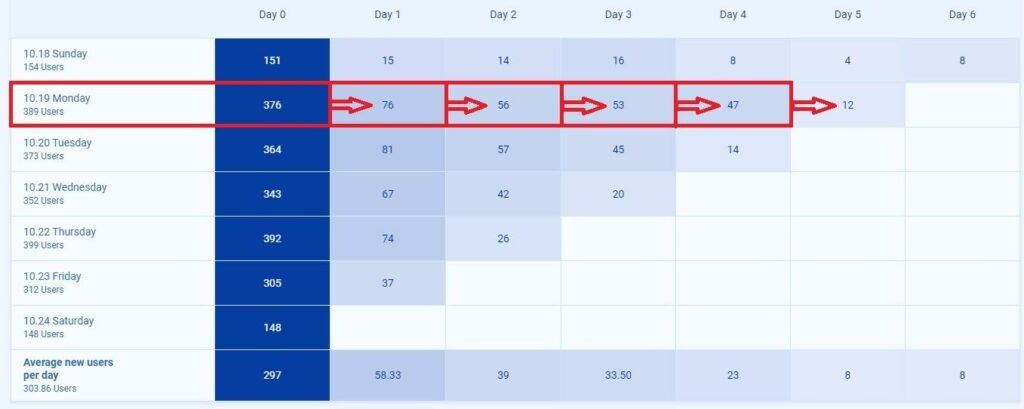
As you can see, on Day 1, 76 (20%) of the 376 users performed the same action again. That number gets progressively smaller each day, with a big drop between Days 4 and 5.
With Smartlook’s retention tables, you can track the behavior of a cohort of users on your website across multiple visits with just a few clicks.
Get Smartlook and start tracking all user sessions and interactions today
As you can see, there are lots of ways to perform behavior analytics and gather valuable insights with Smartlook. Here’s how you can get started tracking user behavior on your site today:
- Sign up for a free 30-day Smartlook trial— no credit card required. Our tool can be used on websites built with popular CMSs like WordPress, Joomla, and Shopify and has integrations with popular A/B testing, CRM, and analytics software, like Google Optimize, Salesforce, and GA.
- Install our code snippet by following the instructions in our Help Center. As soon as you do that, Smartlook will start tracking everything your visitors do.
- Define events. You can track standard events, like URL visits, button clicks, or text inputs without any coding, or create custom events with JavaScript to track pretty much anything else.
- Add your events to a funnel. To create a funnel, choose two or more events and put them in the order you believe your website’s users follow.
- Find why users drop off by combining event tracking and funnel analysis with session recordings. Use session recordings to get the full context behind users’ actions and uncover ways to improve their experience and drive more conversions.
For a detailed presentation of how Smartlook can benefit your business, schedule a demo with our team.