In their early quest to find product traction, most product teams make decisions based on user surveys or one-on-one customer interviews with early adopters.
The insights gained through direct customer feedback are an essential part of finding product-market fit. But when a product reaches the scaling phase, relying on subjective opinions for future product decisions becomes way too risky.
Instead, scaling product teams need to shift to making decisions based on reliable data about how their users actually interact with the product.
This is the purpose of product analytics.
Product analytics is the process of collecting and analyzing data on how users interact with a product, allowing you to answer key questions like:
- What actions do users take most?
- Which features do they use the most/least?
- How much time do they spend using the product?
- What percentage of users convert from free to paid?
- How many paying customers do you retain over a specific period?
- How long does it take them to reach important milestones like tutorial completions and in-app purchases?
Having the data to answer these questions ensures your decision-making process is based on how the majority of users engage with your product, not just the vocal minority.
However, the standard approach to collecting this data has three major shortcomings:
- Traditional product analytics tools require someone with programming skills to set up tracking for each user interaction (event). Even monitoring something as simple as a single button click can require help from a developer. Scaling product teams aren’t usually flush with developers sitting around looking for things to do.
- Traditional tools provide only quantitative data (i.e. stats and metrics), which require analytical skills to interpret. Even when product teams make the significant investment to implement behavior tracking, most insights remain stuck in the mind of one or two people on the product team. It becomes their job to translate the data in a way that others can understand. As a result, most people in the organization never benefit from the tool itself or the insights it provides.
- You have to predict everything you want to track in advance. It can take several months between requesting tracking implementation on a specific element or feature, actually getting tracking setup, and collecting enough data. And if you realize you forgot something (which is easy with so many possible interactions), you have to wait even longer.
In this practical guide to product analytics, we’ll show you how scaling product teams can overcome these challenges with Smartlook, a product analytics tool that combines quantitative data with qualitative insights.
Specifically, you’ll learn how to automatically capture every user interaction in your product with a single code snippet, so you always have reliable behavior data to analyze.
We’ll also show you three in-depth examples of how product teams used Smartlook to make informed decisions.
Here’s everything we’ll cover in this guide:
- Solving the central challenges of product analytics with automatic data capture and session recordings
- 3 product analytics examples from a web platform, mobile app, and mobile game
- Essential product analytics metrics (& how to track them)
- 5 product analytics tools (a quick comparison)
Smartlook combines the power of automatic event tracking, always-on session recording, funnel analysis, and heatmaps to help you improve conversion rates, fix bugs faster, and boost customer retention. Try out Smartlook today with our full-featured, 30-day trial: no credit card required
Solving the central challenges of product analytics with automatic data capture and session recordings
Again, traditional product analytics tools require manual instrumentation before they start collecting user interaction data. This results in a time-consuming setup and a high probability of human error due to the manual work involved.
These tools’ steep learning curve and quantitative nature also limit their accessibility. Typically, only a few people with advanced analytics skills can utilize them, while lots of other team members (like product marketers and customer support specialists) can’t directly benefit from their insights.
In contrast, tools that auto-capture every user interaction with a single snippet installed in your product (like Smartlook) drastically simplify the product analytics process.
Here’s why:
- You don’t need to spend countless engineering hours implementing tracking since only one snippet has to be installed. Besides being faster and cheaper, this simple setup means you get analytics data much faster. Plus, with Smartlook you can track tons of user interactions (events) without coding, which saves even more time and effort.
- You don’t have to predict everything you need to capture in advance. When you realize you want to track a new event, you can analyze it immediately thanks to the historical data that’s already been collected. Again, this is much faster than getting an engineer to set up tracking and waiting for data to roll in.
That’s why we built Smartlook to automatically capture every interaction in your product with the help of session recordings.
In fact, session recordings not only capture each interaction but also allow everyone in your organization to benefit from the product analytics process.
Always-on session recordings: Empower everyone to take part in the product analytics process
Session recordings (sometimes called session replays) show you exactly how your users experience your product, from the moment they open it to the moment they close it.
For example, the screenshot below shows a mobile game session replay in Smartlook.
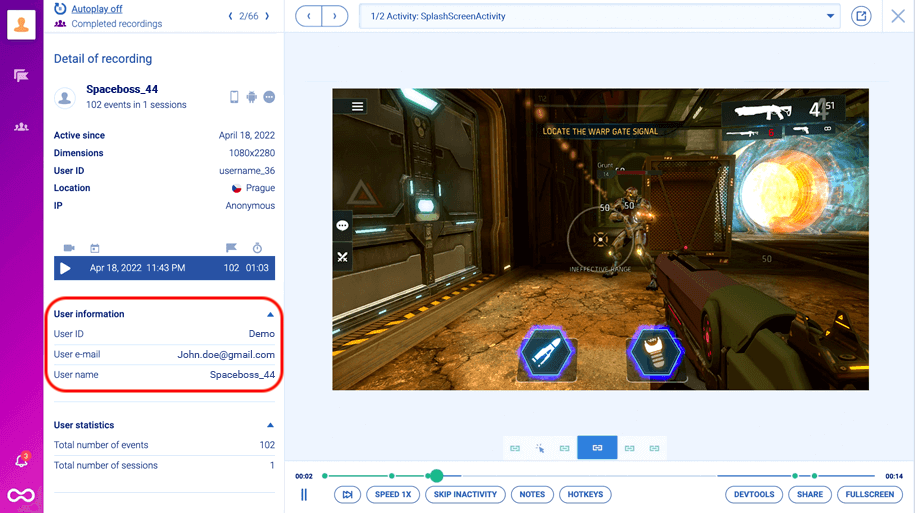
As you can see, this isn’t a text-based representation of users’ sessions (i.e., not just a bunch of stats and metrics). It’s their exact experience with your product, with every interaction in it.
Plus, there’s tons of useful information like the time and date when this session took place, the user’s device and location, as well as their name and email (if you set up our Identify API).
Besides showing you users’ authentic experience, having session recordings as part of your analytics stack provides two essential benefits:
- It makes it much easier for product leaders to communicate their strategy, vision, and findings. Product leaders can use session recordings to show others exactly what’s going on with the product. This is a huge improvement over traditional quantitative tools, which aren’t intuitive for most people. With Smartlook, you can actually combine quantitative data (i.e., stats and metrics) with qualitative insights (from session recordings) to help other colleagues and leadership connect the dots between raw numbers, user actions, and product decisions.
- It lowers the barrier to entry, making the product analytics process accessible to everyone. Anyone can watch a session replay and understand exactly what’s going on, as opposed to a dashboard with numbers on it, which only a few people in the company can interpret.
Put simply, session recordings open the door for everyone to participate in the product analytics process and even use the analytics solution.
For example, with Smartlook:
- Development and quality assurance (QA) professionals can watch session recordings to see the exact situations in which bugs occurred. This makes reproducing and fixing bugs much easier. And since the recordings also include the data that was sent in the background, developers can often skip bug reproduction altogether because they can immediately see what went wrong.
- Customer support teams can use session recordings when users report a bug to understand the problem, without relying on users’ explanations (which are often incomplete or incorrect). With our Identify API, you can actually locate users’ session recordings, based on an identifier like email or username. When an identified user reports a bug, your support team can instantly jump into their sessions and see exactly what happened. Then, they can resolve the issue themselves or escalate it to the dev and QA teams by sending them the relevant session replays.
- UX designers and researchers can see the entire context behind users’ actions, from the moment they open your product to the moment they close it. They can also use heatmaps to visualize the typical user’s experience on any page or screen.
- Marketers can go beyond analyzing the campaigns that led users to the product (i.e., marketing analytics) and get insights into what users do once they sign up. This can give them new ideas for what to highlight in their campaigns. Also, they can set up events without coding to analyze the effectiveness of certain changes. For example, if they changed the messaging and button colors on the homepage, they can easily see if that change leads more people to perform a desired action. We’ll show you how to do this in the next section.
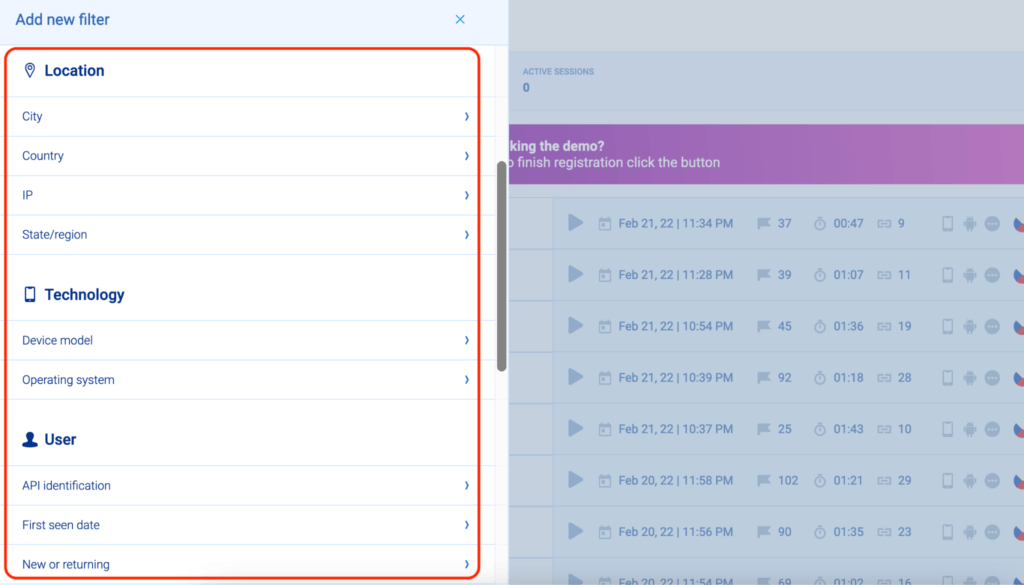
Also, Smartlook has more than 30 filters that let you find relevant sessions fast. For example, you can filter users from a specific country, new or returning users, users with a specific device, and more.
Lastly, with Smartlook, session replays are always-on by default, which means:
- You don’t have to worry about manually starting and stopping the session recorder.
- Every interaction is collected automatically and traced back to a session recording. For example, say you’re tracking when users click on a new feature in your product dashboard. You can watch all session recordings where this interaction took place, which gives you the full context behind users’ actions, i.e., what they did before and after clicking on that button.
Event tracking: Monitor important user actions, even retroactively
Tracking the right user interactions (called events) is fundamental in product analytics.
But oftentimes, you simply don’t know which events you need to track in advance. For example, if you just released a new feature, redesigned the UI, or haven’t analyzed product usage before, it can be nearly impossible to predict every event you’ll need down the line.
As a result, you can spend months planning and implementing tracking only to realize you’ve missed a crucial event. When this happens, you need to start the process all over, meaning you’ll have to keep waiting until enough data rolls in.
Fortunately, the auto-capture method solves this issue. Since the user interaction data is automatically collected, you don’t need elaborate tracking plans or perfect predictions. All you have to do is decide which interactions you want to track as events.
In Smartlook, this process is called defining an event. And, to avoid the need for a developer each time you want to track a new action, we’ve created three ways to define events without coding:
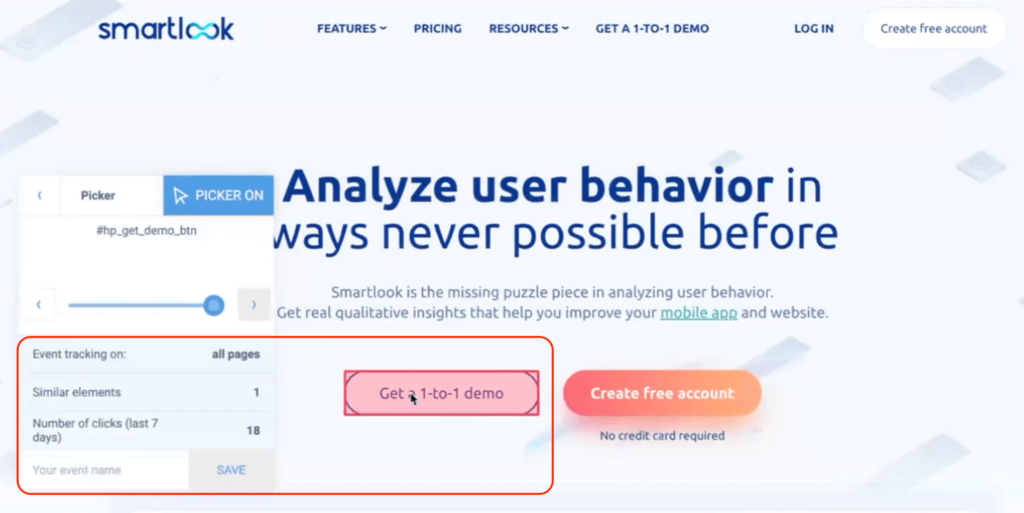
- Use the no-code event picker. When defining a new Smartlook event, there’s a “Pick event on page” button. Clicking it allows you to define an event by clicking on elements in your site or app’s UI. You can immediately see the number of clicks on that element over the last seven days, based on the collected data.
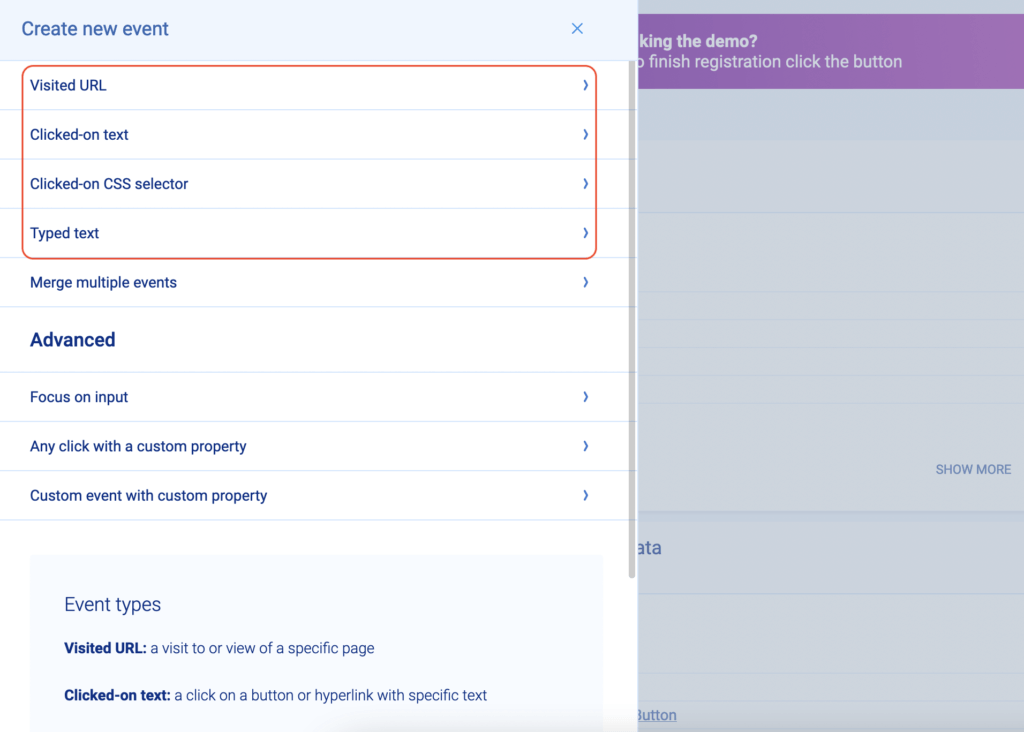
- Choose from a template list of standard events, including clicked on URL, clicked on text, typed text, clicked-on CSS selector (allowing you to select any element on the page).
- Define an event from a recording. While you’re watching a session replay you may see some actions that you’d like to track. In that case, you can pause the recording, click on the “Session events” tab, and make that action into an event by clicking on “Create Event”.
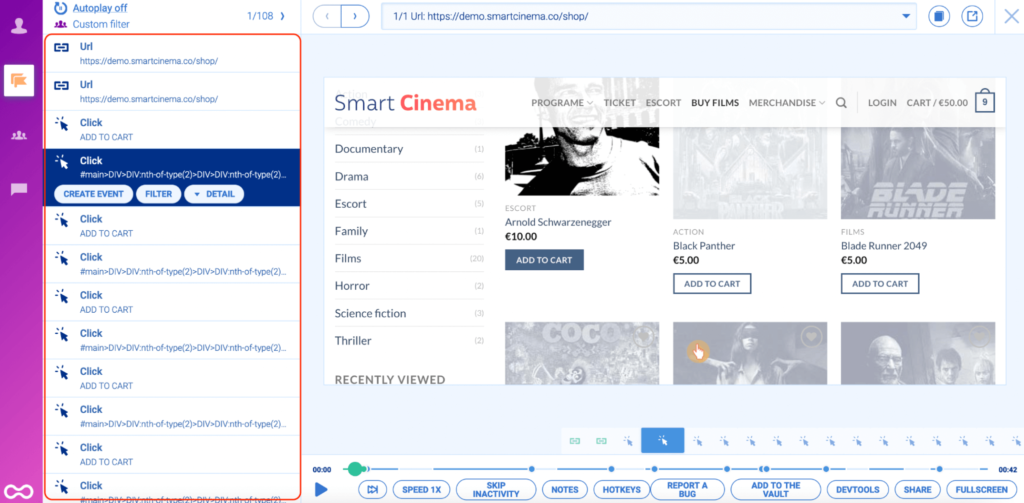
Once you define an event, Smartlook immediately identifies every instance of that event, going back to the moment you added the snippet or as far as your data retention plan goes. As a result, the event tracking visualization appears instantly, like in the GIF below.
Madfinger Games, an award-winning game development studio, highlighted the ability to define events retroactively as one of the biggest benefits of working with Smartlook. Their CTO had this to say:
“That’s the cool thing about Smartlook — we often have no idea what we’re going to need. And Smartlook captures everything for us. We can always set up an event later and start focusing on the problem when it pops up.”
Besides these standard events, Smartlook also lets you create custom events via JavaScript. With custom events, you can track pretty much anything you can imagine.
Additionally, you can break down any event by a specific property, like country, device, or browser.
You can save any combination of events and properties as a user segment, like US users who performed an in-app purchase. The segment will appear in your dashboard, so you can monitor it over time.
You (or your development team) can tailor this analysis to your needs further by creating custom properties, which let you log specific data for every event.
Lastly, Smartlook’s Anomaly detection feature can send you notifications in case of a sharp increase or drop-off in the occurrence of events.
3 product analytics examples from a web platform, mobile app, and mobile game
So far, we’ve covered various product analytics features that can be applied in all sorts of use cases. Next, we’ll explore three examples of teams using these features in their workflow.
StoragePug: Using session recordings and custom events to analyze feature adoption and improve the customer experience
StoragePug is a website platform that helps self-storage businesses rent out facilities faster and attract new tenants.
The company experienced rapid growth, which brought many challenges, including the need to make sure product changes aligned with the needs of their now much larger customer base.
They initially chose Hotjar but decided to move away from it after the Forms and Funnels feature was removed (which is an issue we’ve discussed in our Hotjar alternatives article).
Once they switched to Smartlook, StoragePug’s team started using event tracking, funnel analysis, and session recordings to monitor crucial user actions and analyze customer behavior.
Custom event tracking: StoragePug’s team used Smartlook to set up a series of custom events to track business-critical user actions over time, such as:
- Portal log-ins.
- Location page visits.
- Log-ins to the Lead Manager and Unit Manager (their platform’s modules).
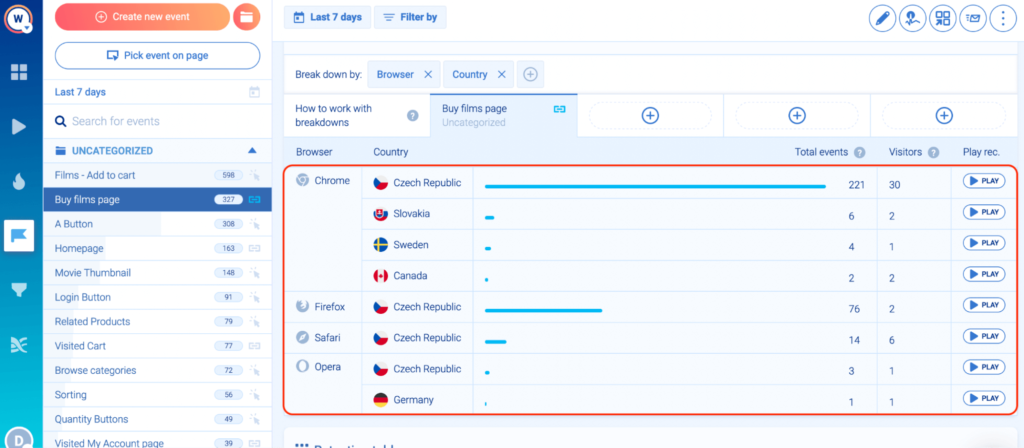
Feature adoption analysis: StoragePug’s team wanted to see if users prefer accessing data through their new “scheduled email reports” feature over logging into the platform.
To do that, their team used Smartlook’s funnels feature to filter session recordings to watch only those where users tried the new feature. This helped validate that users preferred to access data via the scheduled email reports. Based on those findings, the team decided to promote this feature to their entire user base.
The screenshot above shows StoragePug analyzing the “scheduled email reports” feature with Smartlook’s funnel analysis.
Session replay for bug reproduction: Oftentimes, customers asked StoragePug’s customer success team for help, but provided inaccurate information about their problems. This made it difficult to diagnose and fix a lot of issues.
With Smartlook, the customer success team can filter session recordings by the customer’s email and see where and why the problem happened, saving them at least eight hours a week. Replays are also invaluable for developers since they show what steps the user took that led to a bug, along with what data was sent in the background, making debugging much easier.
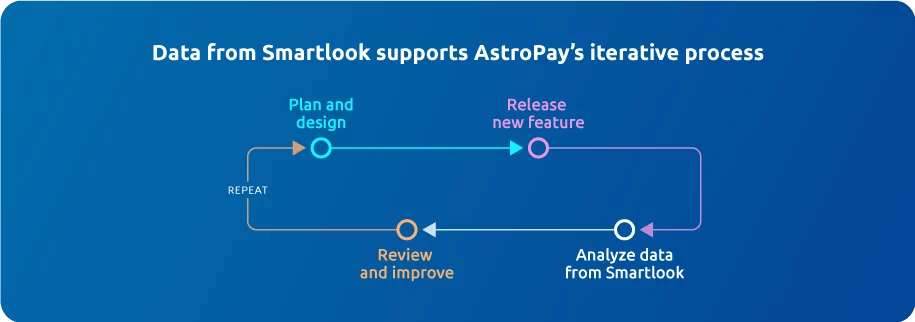
AstroPay: Using funnel analysis and session recordings to boost conversions
AstroPay is a fintech payment application that connects 5M+ users with 500+ merchants in Asia, Africa, Latin America, and Europe.
Like most scaling product companies, AstroPay needed more data about how users interacted with their products. Specifically, they needed to analyze feature adoption, study customer journeys, catch places where users get stuck, as well as detect bugs and anomalies.
With Smartlook, AstroPay’s team created event-based funnels to map their most important user flows. Their analysis of event data showed that a lot of users didn’t complete their cryptocurrency purchase process after starting it.
Since Smartlook combines this quantitative data with qualitative insights from session recordings, AstroPay’s team was able to watch the exact replays of users who dropped off, which led to the following insights.
- Some users dropped off because there were way too many steps in the purchase process.
- After purchasing, many users spent minutes anxiously looking for the cryptocurrency in their wallet, not realizing the transaction was still pending.
Armed with these insights, AstroPay’s team confidently redesigned their cryptocurrency purchase flow, removing unnecessary steps and adding a “Purchase Pending” banner. This resulted in a much better user experience and a 56% lift in conversions.
Put simply, Smartlook’s combination of quantitative and qualitative data allowed AstroPay to quickly find points of friction in their product.
Today, AstroPay’s product and dev teams both use Smartlook to make the right product development decisions, based on product analytics data.
Vertigo Games: Analyzing and improving the game experience with session recordings, funnels, and heatmaps
Vertigo Games is a small game development company that develops and self-publishes first-person shooter games.
During the early development stages of one of their games, they lacked important information, like:
- How many gamers complete the full onboarding guide?
- Do players complete the game’s missions according to the initial design?
- What are the exact paths that lead to a bug?
Bug reproduction specifically was a huge problem. The lack of session recordings forced developers to reproduce issues via trial and error, making the process time-consuming and often unsuccessful.
As one of their game analysts said:
“Before Smartlook, we couldn’t find the reasons for the drops occurring in various parts of the funnels in our game. In order to find a solution when we had a high drop rate, we were trying to experience it ourselves and to determine the source of the error in the specified place, which caused a great waste of time.”
With Smartlook’s session recordings:
- The QA team can see exactly how bugs occurred, which saves tons of time.
- The product team can verify whether new players get a great first impression of the game by watching them play.

How does each team benefit from using Smartlook? The Product Team Analyzes typical and unusual gamer behavior and the reasons for drop-offs in a game funnel; The Quality Assurance Team Learns if the bug reports or requests from players are consistent with the game’s workflow and where during the sequence of actions a gamer experiences a bug.
Both teams use extremely detailed funnels (with as many as 60 steps) to map how users go through the tutorial, as well as other key user flows. This lets them verify the functionality and user experience throughout the game.
Essential product analytics metrics (& how to track them)
There are two types of product metrics that pretty much all product managers need to track — user engagement and monetization metrics. Both types are inherently connected, since the more engaging and useful your product, the more chances you have to increase revenue and vice versa.
In this article, we’ll show you how to track how many active users you have, monitor your retention rate, and calculate your conversion rate.
Daily, weekly, and monthly active users (DAU, WAU, & MAU)
Smartlook automatically calculates DAU, WAU, and MAU for you, so you can easily analyze real-time user engagement metrics. You can see how in our free public demo (no registration or credit card required).
Inside the Smartlook dashboard, click on “Add new tile”.

Go to “Active Users”, where you can choose between daily, weekly, or monthly active users, plus the data range you want to analyze (seven, 30, or 60 days).
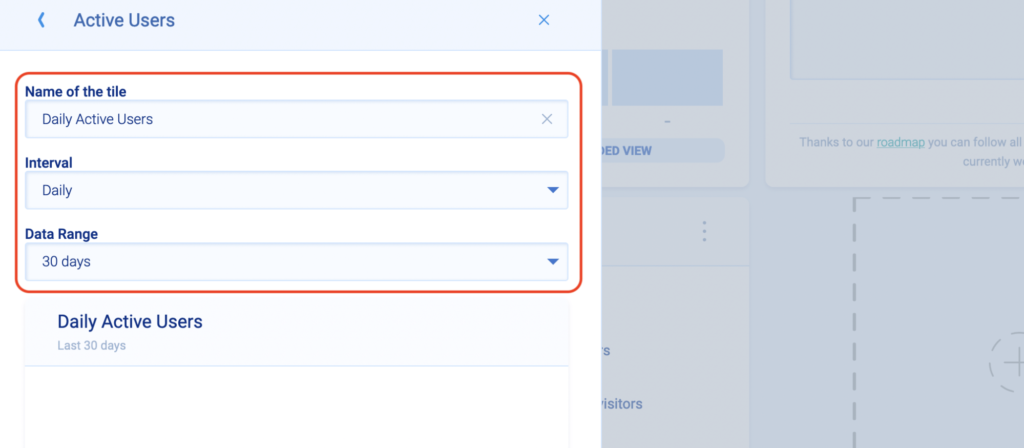
Finally, click “Save” and the newly created tile will appear in your dashboard. That way, you can easily keep track of your daily, weekly, or monthly active users every time you open Smartlook.
Retention rate
In product analytics, retention rate is the percentage of customers who continue to perform a given action (like paying for a product, logging into their account, or using a feature) over a timeframe. Monitoring and improving retention is crucial because:
- Retaining existing customers is much cheaper than bringing in new ones.
- The better your retention, the more chances you have to increase users’ lifetime value (LTV).
You can use Smartlook’s Retention Tables feature inside the events tab to track user cohorts over time and calculate retention.
To set up a Retention Table, you first need to select a user action (i.e., event) and choose a date range to analyze. After that, scroll down to the “Retention table” section, click on “Generate”, and you’ll see a table similar to the one below.
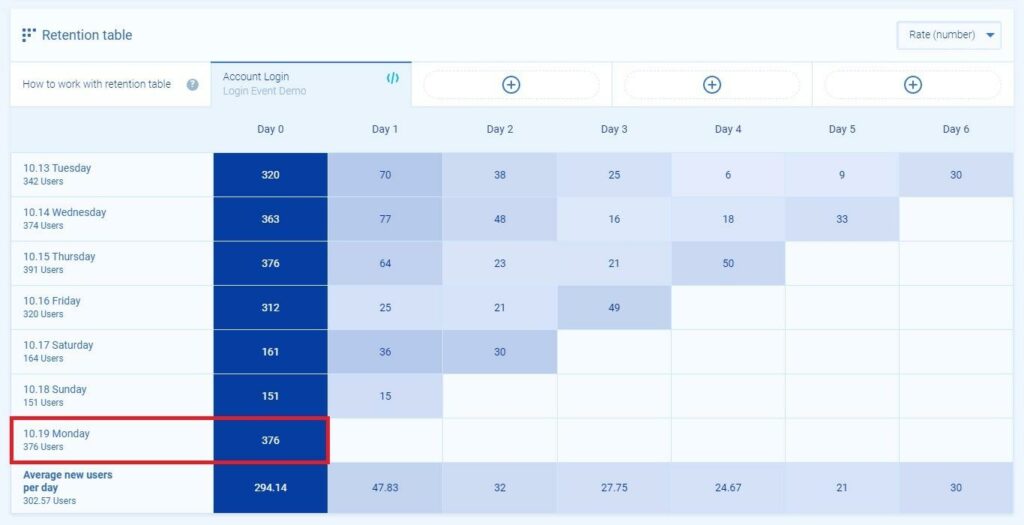
The screenshot above shows a retention table for an account log in event. This lets you track how many of the users that log into your product for the first time on a specific date continue to do so each following day. The group of people you track (in this case users logging in for the first time) is called a cohort, which is why this type of research is sometimes called cohort analysis.
As you can see in the screenshot above, 320 users completed the “Account Login” action on Tuesday, 10.13, Day 0 for that cohort. The next day (Day 1), 70 users completed the same action, for a Day 1 retention rate of 21.88% (70/320*100).
Once you have that baseline, you can use Day 1 Retention as a KPI and evaluate how changes to your product affect retention for the next user cohorts.
Conversion rate
Conversion rate is the percentage of users who take a desired action in your product, like:
- Completing an onboarding tutorial.
- Opening a newly released feature.
- Finishing a specific game level.
- Making an in-app purchase.
Each product has tons of user flows, so you’ll likely need to calculate conversion rates for various situations.
For example, if you want to analyze user engagement, you may want to see what percentage of users complete a certain number of levels in your game. Or, you may want to see what percentage of all users make an in-app purchase in order to analyze your monetization strategy.
Smartlook can help you calculate conversion rates for any user flow you like, thanks to our funnels feature.
Funnels are sequences of steps (i.e., events) users go through to complete a goal. Building funnels lets you analyze user behavior through these key flows, find out where users drop off, and calculate conversion rates.
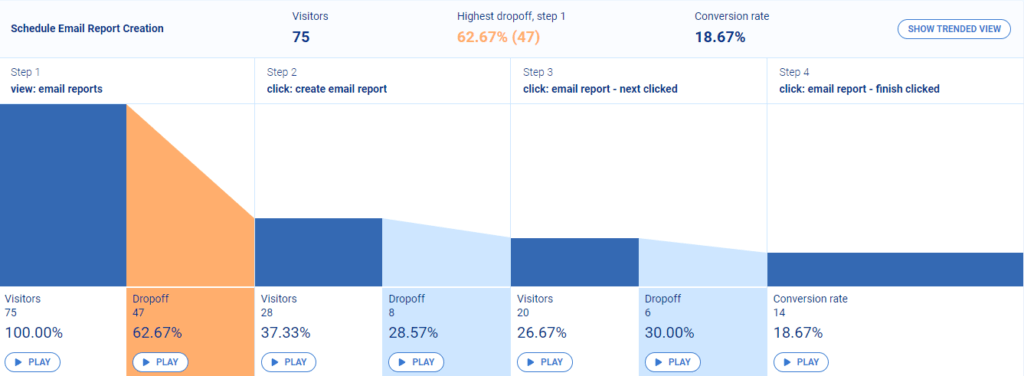
For example, most mobile apps, games, and SaaS products have a product tutorial for first-time users. However, many users don’t complete the tutorial, which makes it difficult to convert them from free to paid.
By mapping the entire tutorial to custom events in Smartlook you can see:
- What percentage of users complete the tutorial (the funnel’s overall conversion rate).
- What percentage of users successfully move between each step.
More importantly, you can find valuable insights by watching session replays of people who quit the tutorial early.
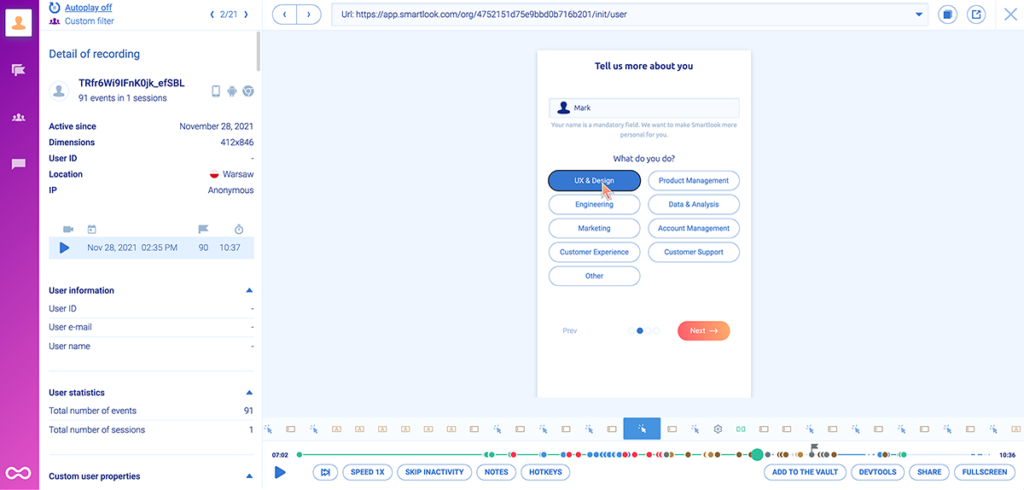
The image above shows a moment during a Smartlook session recording of a mobile user’s journey while navigating an onboarding sequence. During the roughly 10-minute session, the user completed 91 events.
Let’s say the overall conversion rate for this funnel is only 10%. That might make you consider redesigning or removing the entire tutorial. However, if the average user completes almost 100 events, there’s probably some value in the tutorial.
If you look at the drop-off rate between each step, you might find that the sharpest drop-off happens between two specific steps. Perhaps there’s a technical error there or users simply think they’ve learned everything they need at that point. Either way, Smartlook helps you find why drop-offs occur by watching session recordings of users who dropped off at a specific stage.
We’ve explored this topic in detail, so if you’re interested, check out our funnel analysis guide (with many SaaS and e-commerce examples.)
Bonus: Track JavaScript errors and rage clicks automatically
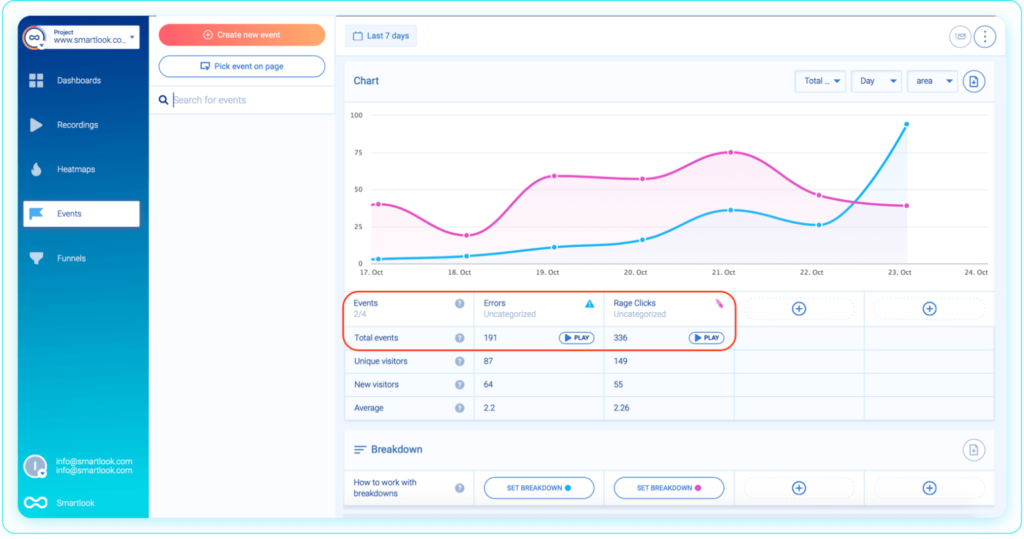
Tracking errors and rage clicks can give you tons of useful insights.
For example, rage clicks might indicate that some elements in your product look clickable to users when in reality, they aren’t. Redesigning these elements can be an easy way to reduce users’ confusion and frustration.
Smartlook tracks JavaScript errors and rage clicks as events by default, allowing you to instantly find session replays of users who were frustrated or experienced an error.
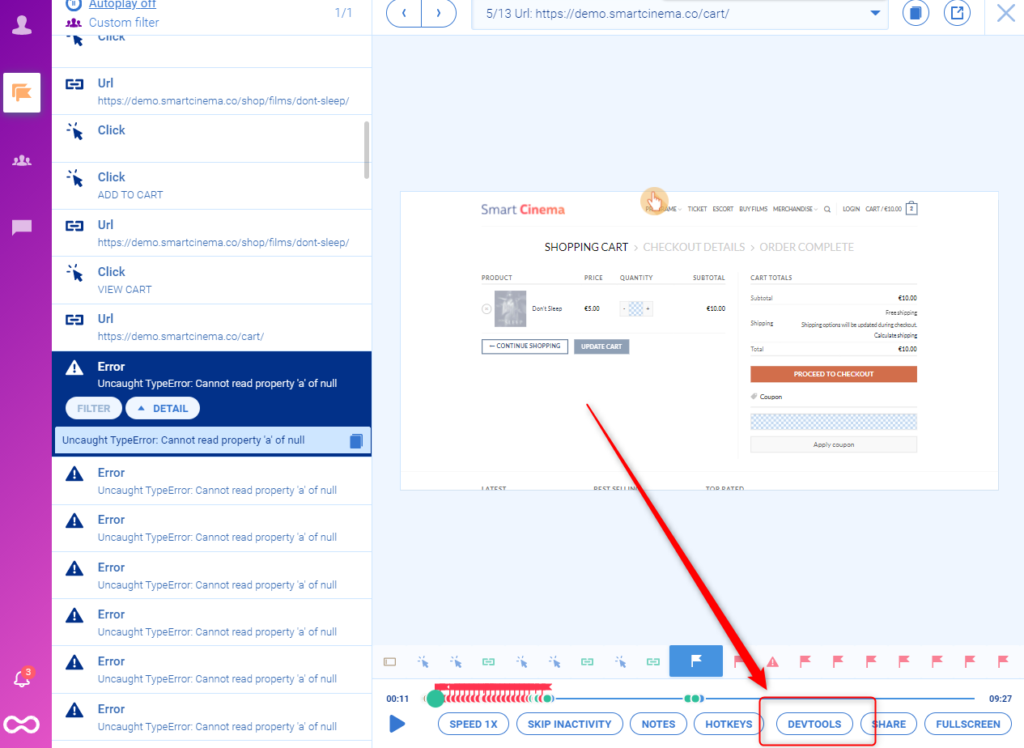
As you can see in the screenshot below, there’s a “Play” button under the “Errors” and “Rage Clicks” events. Clicking that button takes you straight to the relevant session replays, which can show you exactly what went wrong.
One of our clients used session recordings to find 15 bugs on their website in three hours.
Once you find these errors, you can send the relevant session recordings to your dev and QA teams. Again, having a video of the error taking place makes the debugging process much faster. They can get even more technical information about the error by clicking on the “DEVTOOLS” button.
5 product analytics tools (a quick comparison)
In this section, we’ll do a brief overview of five useful product analytics tools.
Before we dive in, note that we’ve already done a comprehensive review of the best product analytics tools, so we won’t cover all the details here.
1. Smartlook
- Data capture method: Automatic with a single code snippet.
- Session recordings: Yes.
Smartlook is the only combined product analytics and visual user insights platform that won’t take your team forever to set up. You can use it to analyze user behavior on websites, web apps, as well as native iOS and Android mobile apps built with various frameworks and engines — including React Native, Cordova, Flutter, Ionic, Unity, Xamarin, and Unreal Engine.
Once our code snippet is installed (for websites) or the SDK is set up (for mobile apps) Smartlook starts recording all user sessions and interactions in your product, which means:
- Every session is automatically captured for you (no sampling), so you don’t have to manually start and stop the session recorder.
- You don’t need to submit an extensive list of events you want to track to your engineering team before you start collecting data.
- You won’t be missing important data when analyzing your users’ behavior.
- You can create events and funnels retroactively, based on historical data.
To try our platform, start a 30-day, full-featured trial — no credit card required.
2. Amplitude
- Data capture method: Manual instrumentation, meaning you need to create a tracking plan at the start to ensure you’re tracking what you want.
- Session recordings: No.
Amplitude is one of the most comprehensive and seasoned product analytics solutions on the market. It can do all kinds of event-based analytics, comparisons, segmentations, visualizations, and more.
However, being a manual instrumentation solution, it’s tedious and overwhelming to set up and use on a daily basis.
3. Mixpanel
- Data capture method: Manual instrumentation, meaning you need to create a tracking plan at the start to ensure you’re tracking what you want.
- Session recordings: No, but you can integrate Mixpanel with Smartlook, allowing you to see your visitors’ session recording URLs in your event feed and access them directly.
Mixpanel is another popular product analytics platform, with features for analyzing product performance, usage, retention rate, churn, and more. Similar to Amplitude, Mixpanel also lets you track tons of different interactions and compare them, but is also time-consuming to set up and utilize.
4. Heap
- Data capture method: Automatic with a single code snippet.
- Session recordings: Not yet, but they recently acquired session recording tool Auryc, so session replays may become a part of the core Heap platform soon.
Heap is a digital insights platform that offers a few different categories of tools for data analysis, data foundation, and data management. Similar to Smartlook, Heap also collects user interactions automatically, making its setup much easier than Mixpanel and Amplitude.
5. FullStory
- Data capture method: Automatic with a single code snippet.
- Session recordings: Yes.
FullStory is a Digital Experience Intelligence (DXI) platform that offers session recordings, heatmaps, funnel analysis, and other analytics features. Similar to Smartlook, it also automatically records user interactions, so you can set it up quickly and define events retroactively.
One downside to this platform, as we’ve discussed in our FullStory competitors article, is its pricing structure. Lots of users report having to manually sample their website traffic because they couldn’t afford a plan they can leave turned on all the time.
Try Smartlook for free today
If you want to see how Smartlook works in detail, start a 30-day, full-featured trial — no credit card required.
Smartlook can be used on all kinds of digital products, including:
- Websites and web apps built with popular CMSs like WordPress, Joomla, and Shopify. Implementing Smartlook on your site is as easy as pasting a code snippet directly or via Google Tag Manager.
- Native iOS and Android mobile apps, built with various frameworks and engines — including React Native, Cordova, Flutter, Ionic, Unity, and more. We have detailed documentation to guide you through the implementation, but if you need any assistance, our Support team is ready and waiting.
Lastly, Smartlook has integrations for A/B testing solutions (like Google Optimize and Optimizely), CRMs (like Salesforce), analytics platforms (like Google Analytics), and other widely-used tools (like Jira, Slack, and Intercom).
For an in-depth Smartlook presentation that’s tailored to your business, schedule a demo with our team.