Hotjar is a popular choice for people taking their first steps into user behavior analysis. But experienced marketers, product managers, and user experience (UX) pros who use Hotjar to learn why users leave their site run into some big limitations:
- It no longer has funnel analysis features. If you want to see where users drop-off in a funnel, you have to pay for a second tool or set up a clunky manual integration with Google Analytics.
- Defining and tracking events requires programming and a paid plan. You have to write JavaScript code and use Hotjar’s Event API to track simple events like button clicks. Plus, you can’t use events to create funnels, which is a vital use case for event tracking.
- It’s got very limited quantitative analysis capabilities, especially compared to most tools listed below.
These limitations (plus the inability to analyze user behavior on mobile apps) lead many professionals to seek out alternatives to Hotjar.
In this article, we’ve grouped 12 of the best Hotjar alternatives into two categories: one for behavior analysis tools and a second one for user feedback and survey tools.
We’re kicking things off with Smartlook — our website and mobile app analytics tool, which combines heatmaps, screen recordings, event tracking, and funnel analysis.
10 Hotjar alternatives for behavior analysis via heatmaps, screen recordings, events, and funnels
2 Hotjar alternatives for customer feedback and surveys
If you want to start analyzing user behavior on your website or mobile app as soon as possible, sign up for a free Smartlook account. Our tool can help you see what users do, where they click, which pages or screens they visit, and much more.
10 Hotjar alternatives for behavior analysis via heatmaps, screen recordings, events, and funnels
The tools listed in this category have Hotjar’s most popular features — heatmaps and screen recordings. However, since heatmaps and recordings are rarely actionable by themselves, the tools below also help analyze the user experience across different web pages or events and much more.
Smartlook
- Website or mobile app analytics: Both.
- Free Plan: Available for up to 3,000 sessions/month. No credit card required.
- Price: Paid plans start at $55/month, with a 30-day free trial.
Smartlook is our tool that helps over 300,000 businesses analyze user behavior on their websites as well as Android and iOS apps.
Once our code snippet is installed, Smartlook’s always-on screen recordings capture every user session on your website or mobile app. You can use the data from these sessions to define events, build funnels, create heatmaps, and watch user recordings.
As a result:
- You don’t have to worry about enabling and disabling session recordings.
- When you define events or create funnels and heatmaps, they automatically get populated with historical data, as far back as your data retention plan goes.
- You can always add new events to existing funnels and analyze them immediately, as the data is already collected.
In short, with Smartlook, you always have essential user behavior data at your fingertips. You can use it to perform quantitative and qualitative analysis to understand what users do and why they do it.
Smartlook gives you the option to apply masks on user input forms so that sensitive information is not transmitted to Smartlook servers.
Here are two practical ways in which our customers take advantage of Smartlook’s feature set:
#1 Create funnels and analyze conversion rates across different pages and events
Most visitors take many steps before completing a conversion event, like purchasing a product or signing up for a newsletter. Analyzing their journey across these steps — a process called funnel analysis — is essential for increasing conversion rates and improving the user experience as a whole.
With Smartlook, you can do funnel analysis in 3 simple steps:
- Define at least 2 events. Events are all the user interactions that can be tracked. You can define standard events like URL visits, text inputs, button clicks, and more without any programming. You can also create custom events with JavaScript to track pretty much everything else. When you define an event, Smartlook instantly identifies every instance of that event across your site — going back as far as your data retention plan goes.
- Create your funnels. To create a funnel, select 2 or more events and put them in the order your users follow. When you do that, Smartlook automatically creates a funnel visualization, like in the GIF below.
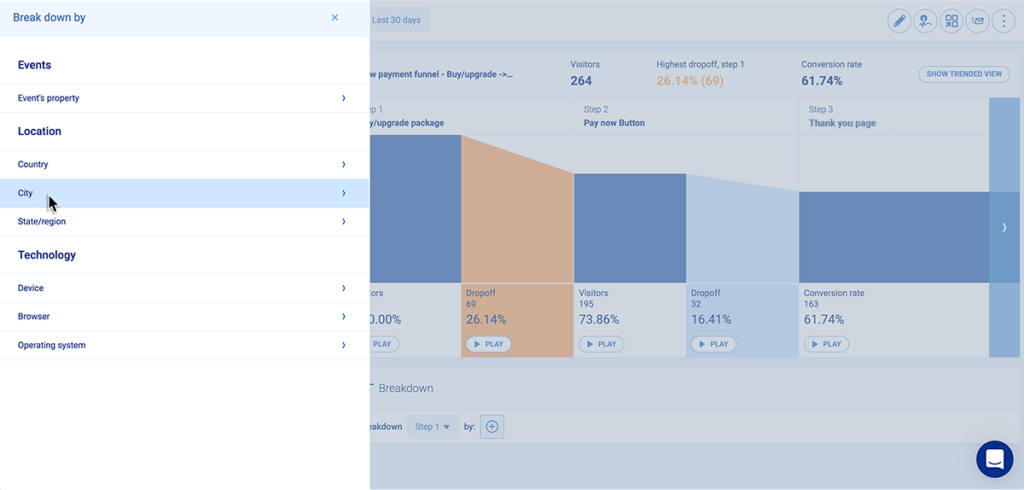
- Analyze events and funnels with the help of screen recordings. From here, you can watch screen recordings of users who dropped off between steps of the funnel (more on that in a bit). For additional context, you can look at all recordings where a certain event occurred, like a user clicking on the “Buy now” button. If you want to narrow down the videos, you can use 30+ filters like country, city, device type, operating system, etc.
For an in-depth guide with more examples, check out our article on funnel analysis with Smartlook. You can explore an example funnel in our live public demo by creating a free account — no username, email address, or credit card required.
Hotjar used to offer funnel analysis, but they retired the feature in December 2020. As a result, you can’t analyze conversion rates across the user journey with their tool alone. In fact, one of our clients started looking for Hotjar alternatives due to this change.
#2 Get actionable insights from your data fast
One of the biggest complaints users have about Hotjar (and many of its competitors) is that getting insights from screen recordings takes too much time. Even Hotjar advises their users to “book a recurring 2-hour slot in your calendar every couple of weeks, so you get into the habit of watching regularly.”
This is where Smartlook’s approach of combining screen recordings with events and funnel analysis can pinpoint the exact recordings you need, saving you tons of time and effort.
For example, this screenshot of Smartlook shows a three-step check-out funnel.
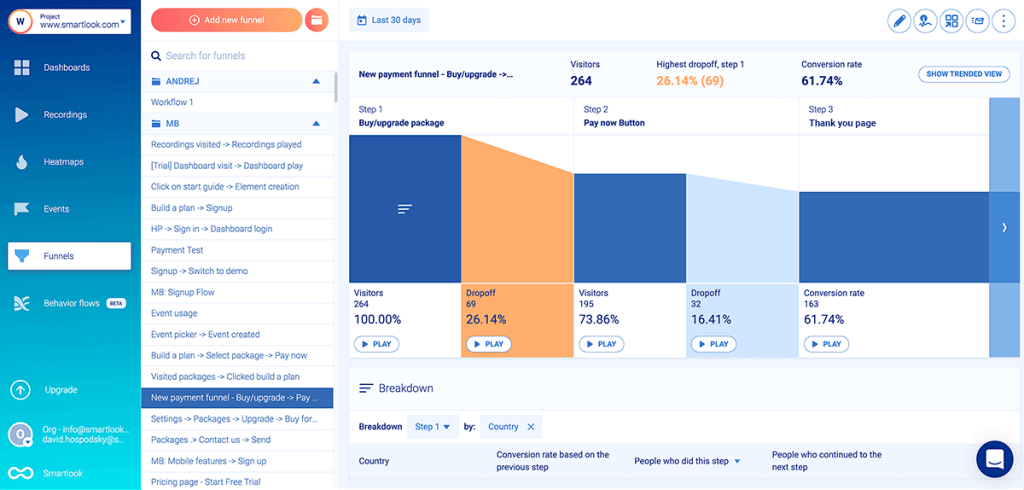
First, users land on a page, then they click on “Pay Now” and finally, they go to the “Thank you” page.
But if you look at the drop-off rate between the “Pay Now” button and the “Thank you” page, you can guess there’s some type of usability problem on the “Pay Now” page. To figure out why 32 users who wanted to buy were prevented from doing so, you’ll need to watch their session recordings.
Here’s how easy it is to investigate this issue with Smartlook:
First, you define the events and create the funnel in a few clicks. Then, you simply click the “Play” button underneath each funnel step to go directly to the screen recordings of all the visitors who dropped off at that stage.
This lets you watch the 32 users who had issues purchasing instead of sifting through all 195 recordings. All of this is done without using another tool or writing a single line of code.
You can explore a similar checkout funnel in our live public demo (no email, username, or credit card required). Just click to “create a new account” and then click on the funnel icon in the left-hand sidebar. There are 7 example funnels to explore, including a “Purchase process” funnel.
On the other hand, you can’t reach these insights in Hotjar alone. You have to locate the funnel drop-off in Google Analytics or another analytics solution. Then you have to watch Hotjar recordings of all 264 users who landed on the page (Step 1).
The recordings can be filtered based on the button click event (set up with JavaScript), but that still leaves you with 195 videos.
Smartlook vs. Hotjar
In terms of features, both Smartlook and Hotjar have screen recordings and heatmaps that track clicks, scrolls, and mouse movements.
Smartlook’s screen recordings are always on by default, capturing every user session. Since moving to Continuous Capture, Hotjar can record all user sessions as long as session capture is enabled. However, in some cases, Hotjar still samples your traffic, unless you manually adjust session targeting or upgrade to a higher plan.
While Hotjar has great capabilities for asking website visitors about their experience, Smartlook helps you understand their behavior on a deeper level and quantify it with:
- Event tracking and funnel analysis, which let you analyze conversion rates across the user journey, like we showed you above.
- Retention tables, which help you study churn and user engagement.
- Anomalies detection, which alerts you in the app or via email whenever sharp conversion rate increases or drop-offs occur.
Another big difference is that Smartlook can be used on websites and native mobile apps. Currently, Hotjar is not compatible with mobile apps.
If you want to see what Smartlook can do for your business, schedule a live demo or sign up for a free 30-day trial (no credit card required).
FullStory
- Website or mobile app analytics: Both.
- Free Plan: Available for up to 1,000 sessions/month with all features.
- Price: Price for business and enterprise plans is available upon request. There’s a 2-week free trial for some paid plans.
FullStory is a “Digital Experience Intelligence” platform that offers one of the most advanced session replay tools out there. It also has funnel analysis, capabilities for segmenting and filtering users based on their actions, and more.
One important thing to note about FullStory is that it’s geared toward enterprise users. As a result, many online reviews mention its steep price tag, as we discussed in our FullStory alternatives article.
FullStory vs. Hotjar
In terms of similarities, both tools have heatmaps and ways to watch user sessions.
Hotjar’s differentiators, when compared to FullStory, are their feedback and survey features. However, FullStory has much broader quantitative analytics capabilities (including funnel analysis) and can be used to analyze mobile apps as well as websites.
Lastly, another big difference between both tools is pricing transparency. Hotjar has 4 plans with clear pricing based on user sessions, whereas FullStory requires you to contact their team to get a quote.
Contentsquare
- Website or mobile app analytics: Both.
- Free Plan: No information besides a free product demo.
- Price: Price is available upon a request to their sales team.
As of September 2021, Contentsquare is a massive web analytics platform that actually owns Hotjar. In 2019, they also acquired one of Hotjar’s former competitors — Clicktale.
Contentsquare has various features for analyzing and improving the customer experience like user journey analysis, heatmaps, session replays, and AI insights. Similar to FullStory, Contentsquare is also geared toward enterprises, as their tool set has features for product, UX, marketing, e-commerce, IT, operations, and customer support teams.
Contentsquare vs. Hotjar
Compared to Hotjar, Contentsquare offers much more capabilities, which is likely why they label themselves as a “digital experience analytics cloud,” rather than a tool or solution.
Where both tools overlap are the heatmaps and screen recordings features. Contentsquare has a few upgrades to its versions, including the ability to attribute metrics like revenue and conversions to page elements.
Again, Hotjar has an edge with its feedback and survey features, but Contentsquare is overall a much more comprehensive analytics platform for websites and mobile apps.
In terms of pricing, Contentsquare isn’t transparent, as you have to go through a demo to get a quote.
VWO
- Website or mobile app analytics: Both.
- Free Plan: 30-day free trial. No credit card required.
- Price: Price is available upon a request to their sales team.
VWO is a well-rounded conversion rate optimization (CRO) platform. As such, it’s mainly used to improve conversions and user experience metrics through A/B, multivariate, and split URL testing. Beyond that, VWO also has features for testing products, sending push notifications, and more.
VWO vs. Hotjar
Like Contentsquare, VWO is a feature-rich tool that supports a lot of use cases. It’s also the first tool on the list that has some variation of all of Hotjar’s features — screen recordings, heatmaps, and on-page feedback and surveys.
VWO can be used to analyze forms and funnels, whereas Hotjar retired these features. The A/B, multivariate and split URL testing capabilities also increase VWO’s value for CRO professionals.
Pricing is again a big differentiator, as VWO doesn’t have publicly available plans. Some VWO users have reported that you have to pay more to watch additional user session recordings.
Crazy Egg
- Website or mobile app analytics: Website only.
- Free Plan: No free plan available.
- Price: Plans start at $24/month, with a 30-day free trial. All plans are billed annually.
Crazy Egg is a CRO and web analytics tool, which has heatmaps, user recordings, A/B testing, and features for tracking ad traffic on your website.
Crazy Egg vs. Hotjar
Crazy Egg works in a similar way to Hotjar’s old version before they transitioned to Continuous Capture.
While both tools have heatmaps and screen recordings, Crazy Egg doesn’t capture every user session on your website. Instead, they sample your traffic, and you can choose the rate at which the sampling happens. As a result, Crazy Egg’s quantitative analytics capabilities are more limited than Hotjar’s.
As for their other features, Hotjar stands out with user feedback and surveys, but Crazy Egg offers A/B testing.
One big discrepancy between both tools is their pricing with regard to how many user sessions you can record. Hotjar’s free version includes up to 1,050 user recordings per month, whereas Crazy Egg’s $99/month plan includes only 1,000 user recordings.
Mouseflow
- Website or mobile app analytics: Website only.
- Free Plan: Available for up to 500 recordings/month.
- Price: Paid plans start at $24/month with a 14-day free trial. No credit card required.
Mouseflow is another SaaS tool that helps website owners understand why their visitors don’t convert. Its feature set includes heatmaps, session replays, conversion funnels, and more.
Mouseflow vs. Hotjar
Today, Mouseflow is similar to what Hotjar was before the retirement of the Forms and Funnels feature.
Both tools have heatmaps, screen recordings, and user feedback features, but Mouseflow has an edge with form analytics and conversion funnels. Mouseflow also has the option to record all of your website’s users or only a percentage of them.
In terms of pricing, Mouseflow has 4 paid plans (Hotjar has 3 plans) and offers a slightly better price-to-user recordings ratio. On the other hand, Hotjar stores data longer for their free and cheaper plans.
Lucky Orange
- Website or mobile app analytics: Website only.
- Free Plan: Available for up to 500 page views/month.
- Price: Paid plans start at $10/month, with a 7-day free trial. No credit card required.
Lucky Orange focuses both on visitor behavior analysis — with heatmaps and session recordings; and CRO — with funnels, form analytics, and live chat.
Lucky Orange vs. Hotjar
Similar to our previous entry, Lucky Orange is close to what Hotjar was before the December 2020 change. Both have heatmaps, session recordings, and survey features, but Lucky Orange has an advantage with its conversion funnels and form analytics.
On the CRO side, Lucky Orange also has live chat and pop-up announcements.
In terms of pricing, Lucky Orange brings more variety, with cheaper plans for startups and small businesses as well as an enterprise option. However, Hotjar again has the upper hand in the data storage department, as it keeps data for 365 days for all plans. Lucky Orange’s standard plans (including the $100/month plan) save data for only 30 days.
Inspectlet
- Website or mobile app analytics: Website only.
- Free Plan: Available for up to 2,500 recorded sessions/month.
- Price: Paid plans start at $39/month.
Inspectlet is a website analytics tool that also has a small mix of CRO and debugging functionalities in the form of A/B testing and error logging.
Inspectlet vs. Hotjar
Inspectlet’s current feature is really close to what Hotjar offers. They both have session recordings, heatmaps, and feedback surveys. This also means they have similar limitations when it comes to events and funnels.
Inspectlet has an advantage in 3 categories: A/B testing, form analytics, and error logging. It also offers more recorded sessions compared to Hotjar’s price plans. However, Inspectlet stores data for much shorter periods (between 1 and 6 months) for their lower pricing plans.
Lastly, there’s one peculiar difference in how Inspectlet’s data collection works. By default, the tool staggers session recordings, meaning it can stop recording users to prevent you from exhausting your monthly quota. That’s not always a bad thing, but it can lead to missing important recordings.
Plerdy
- Website or mobile app analytics: Website only.
- Free Plan: Available for up to 2,000 page views/day.
- Price: Paid plans start at $23/month, with a 14-day free trial. There are different plans based on which features you want to use.
Plerdy offers solutions for various use cases like quantitative website analytics (events and funnels capabilities), user behavior analysis (screen recordings and heatmap tools), SEO, and more.
Plerdy vs. Hotjar
Plerdy comes with most of Hotjar’s big features, including heatmaps, screen recordings, and surveys. However, Plerdy’s limited in the survey category, as you can only do Net Promoter Score (NPS) surveys, while Hotjar lets you construct more elaborate ones.
Since Plerdy has a much broader scope, its pricing plans differ, depending on what you want to use. The plans for their behavior analytics tools aren’t as cost-effective as Hotjar’s. For example, the $39/month Hotjar plan captures 3,000 recordings, whereas Plerdy’s $47/month plan captures only 2,000, with a much shorter storage period.
Clarity
- Website or mobile app analytics: Website only.
- Free Plan: Clarity is a free open-source tool from Microsoft offering unlimited recordings, unlimited websites, and unlimited team members.
- Price: Clarity has no paid plans.
Clarity is a free behavior analytics tool from Microsoft that offers session recordings, heatmaps, automated insights, and an integration with Google Analytics.
Clarity vs. Hotjar
For session recordings and heatmaps, Clarity is a suitable alternative to Hotjar. Clarity tracks every user’s visit to your website, although it notes that recordings may not be available for all sessions. It also offers unlimited heatmaps and more than 25 filter options you can apply to both recordings and heatmaps.
Its insights dashboard automatically shows you sessions that may indicate friction points on your website, such as rage clicks, fast scrolling, and JavaScript errors.
Clarity doesn’t offer funnel analysis, surveys, or any tools for gathering customer feedback.
Two alternatives to Hotjar for customer feedback and surveys
These final tools can help you replace Hotjar’s less popular features — customer feedback and surveys. On that note, we’re comparing them to Hotjar strictly based on these capabilities.
Survicate

- User feedback for website or mobile apps: Both.
- Free Plan: Available for up to 25 survey responses/month.
- Price: Paid plans start at $53/month.
Survicate is an effortless survey tool that allows you to collect continuous customer feedback via email, web, in-product, and mobile apps. It offers an extensive list of survey features, plus tons of integrations with different categories of tools like email software (Mailchimp, Klavyio), CRMs (Salesforce, HubSpot), CMSs (WordPress), and more.
Best features:
– A wide range of native integrations with third-party tools
– Intuitive drag-and-drop survey creator, no coding required
– Over 400 ready-to-use survey templates, with AI-assisted search and personalised recommendations
– Automated feedback collection with recurring surveys
Survicate vs. Hotjar
Both tools have features for gathering user feedback and conducting surveys, including NPS ones. They also help their clients with free survey templates, although Survicate’s library is more extensive.
In terms of differences, Survicate is clearly more advanced as it has website, in-product, and mobile app surveys, with all sorts of useful integrations. Survicate also has a Feedback hub for monitoring user feedback from different sources (Intercom, Slack, App Store, Google Play, etc.) in one place.
Finally, Hotjar is the much cheaper option, starting at $39/month, with Survicate’s cheapest paid plan being $79/month.
RightMessage
- User feedback for website or mobile apps: Websites only.
- Free Plan: Available for 14 days.
- Price: Paid plans start at $79/month.
RightMessage helps businesses generate more leads, personalize their experience, and turn them into customers. As a comprehensive platform, it comes with a variety of features, including widgets for surveys and offers, personalized sales pages, and email list segmentation.
RightMessage vs. Hotjar
Both tools overlap in the survey category, as they allow you to create multistep surveys and receive user feedback in real-time. They also have a lot of templates, with Hotjar having a larger library of examples and RightMessage focusing more on the lead generation aspect of surveys.
Similar to our previous example, RightMessage’s pricing starts at $79/month, which is a hefty price tag compared to Hotjar’s pricing.
Get Smartlook today and see how all your visitors interact with your website or mobile app
With Smartlook, you’ll never miss a visitor recording or another crucial piece of data.
Once you install the code snippet on your website, Smartlook’s always-on screen recordings automatically keep track of everything users do on your website, including URL visits, button clicks, text inputs, and more. You can extract insights from this data by combining the power of quantitative and qualitative analysis to understand your users’ behavior and improve your conversion rates.
Schedule a demo or start our free 30-day trial to start seeing your website through the eyes of your visitors.