User analytics (also called user behavior analytics) is the process of analyzing how individual users interact with your product, so you can answer highly-specific questions like:
- How do customers on our most expensive plan use our newest feature?
- How do mobile users from the US navigate the onboarding tutorial compared to desktop ones?
- How do customers who found our site via Facebook ads behave compared to those brought in organically from Google?
User analytics is also a subset of product analytics since it relies on the data gathered during the product analytics process.
But while product analytics focuses on how people interact with the product, user analytics goes a step further by combining behaviors (like in-app purchases) with individual characteristics (like demographic info) and business-specific properties (like customers’ pricing plans) to help you find your most valuable users.
Once you know who your top customers are, user analytics lets you analyze how they interact with your product and find ways to attract more of them.
In this guide, we’ll discuss everything you need to know about user analytics, including:
- The importance of user analytics for improving acquisition, product experience, and retention
- How to capture and analyze user analytics data: 4 key capabilities
Smartlook records the sessions of every single user in your app, shows you everything they do, and helps you uncover why they do it. Book a free demo with our team to see how Smartlook can help you build better products or start a full-featured, 30-day trial (no credit card required).
The importance of user analytics for improving acquisition, product experience, and retention
The biggest value of user analytics is the ability to uncover who your most valuable customers are and how they use your product.
This information can be extremely valuable for many teams in various use cases. For example:
- Product managers can monitor how user behavior correlates with key metrics and KPIs, like engagement, churn, retention rates, and customer lifetime value (CLTV) for their most valuable customers. Product teams can also create detailed customer segments, as we’ll discuss in the next section.
- Marketers can analyze high-paying customer segments — their devices, what brought them to the site, which features they like, and so on. This helps them focus on certain channels and highlight product capabilities that can resonate with other similar customers.
- User experience (UX) designers and researchers can see how specific customers use the product in the wild. This gives them an unbiased way of looking at user behavior, as we discussed in our article on the top UX analytics tools. It also helps them validate or disprove the assumptions they have about each user persona.
Additionally, looking at the journeys of individual users can help you uncover actionable insights for improving your conversions, revenue, and retention.
For example, say you analyze how high-paying customers navigate your onboarding tutorial and find a step that often causes friction and, in some cases, results in users abandoning the tutorial. Fixing that problem can result in more of your ideal customers becoming active users, which in turn leads to higher retention and CLTV.
How to capture and analyze user analytics data: 4 key capabilities
In order to perform user behavior analysis, you need a tool that can:
- Segment users based on their behavior and characteristics.
- Collect data at the individual level, instead of only aggregate, anonymized information, so you can zero in on the journeys of your most valuable user cohorts.
The four capabilities below can help you do both of these things.
Before we dive in, note that we’ll be using Smartlook — our product analytics & visual user insights platform — to demonstrate how each of these four capabilities works.
1. Segmentation
Segmentation is the process of grouping users together based on common properties and behaviors.
Even the simplest product analytics tools allow you to segment users based on characteristics, like their device, country, and city. However, it’s essential to also add a behavior element to your segments, so you get a more accurate picture of your users.
Because segmentation is such a versatile capability, you can create all sorts of different segments depending on your product, like:
- European customers who bought your most expensive plan.
- First-time visitors from Canada who made an in-app purchase.
- Returning US users with Android devices who’ve made at least two purchases in the last month.
With Smartlook, you can save any combination of user behaviors and characteristics as a segment.
For example, the screenshot below shows a segment of PC users from the Czech Republic who clicked on “Add to cart” over the last seven days.
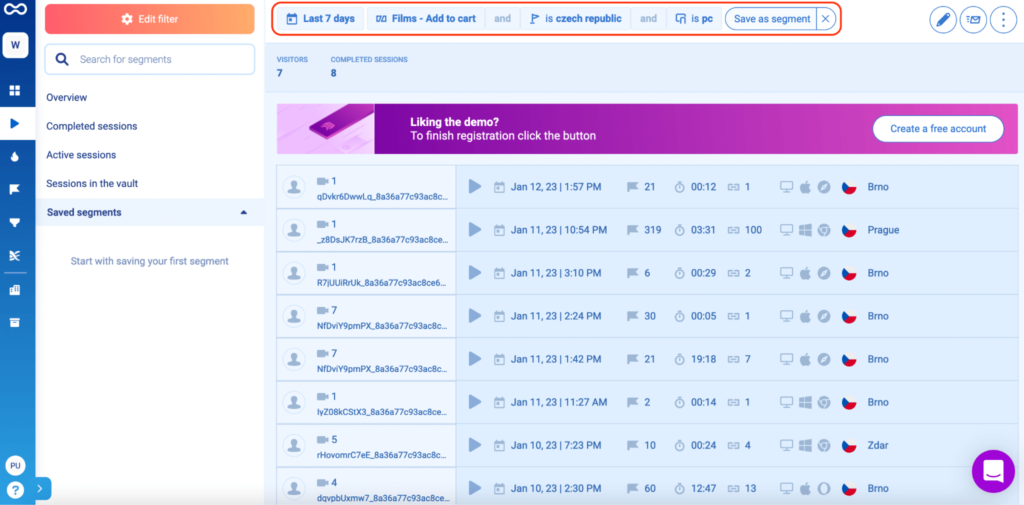
You can continuously monitor the behavior of this segment in your dashboard by clicking on “Save as segment”.
2. Event tracking
Event tracking is the ability to monitor specific user actions, like button clicks, page visits, text inputs, and so on. Like segmentation, events are fundamental to the user analytics process, because they let you add a behavioral element to your analysis.
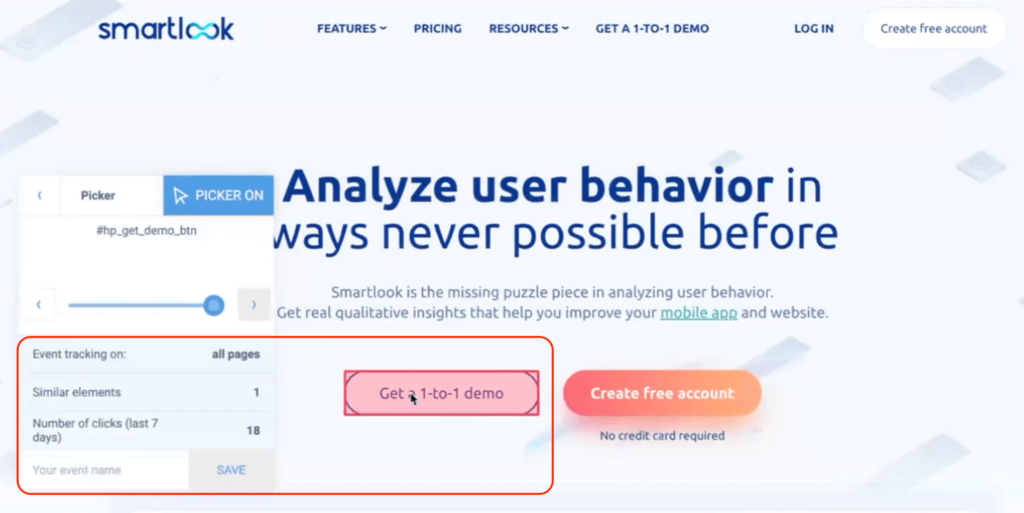
That’s why Smartlook collects valuable product usage data automatically and lets you track useful events (like button clicks, page visits, and text inputs) without coding.
You can select which actions to track as events (called “defining an event”) by simply clicking on your product’s UI, as shown in the screenshot below.
Outside of the standard events, you can also:
- Define custom events via JavaScript to monitor pretty much any other user activities.
- Add properties to each event to further enrich your behavioral data, like the revenue property which helps you track potential and lost opportunities during the checkout process.
Each event can also be broken down by specific properties.
For example, the screenshot below shows an “Add to cart”event broken down by device and country.
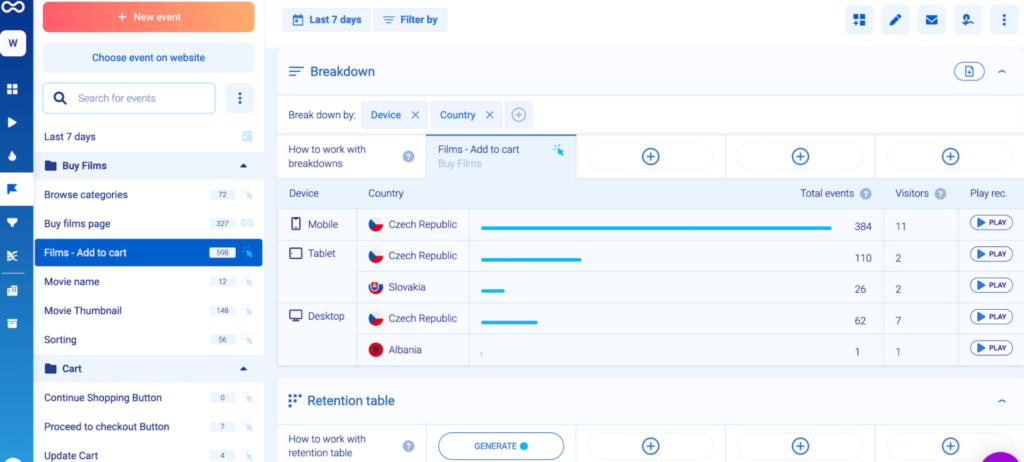
This functionality is useful when you’re trying to understand how often different types of users trigger certain events.
3. Session recordings
User analytics tools have traditionally been focused on quantifying user behavior. This quantitative approach provides organizations with concrete stats and metrics about their users.
However, it also has a big limitation — it doesn’t give you any context about the motivations behind users’ actions and doesn’t paint a complete picture of their journey.
Fortunately, session recordings allow you to overcome this issue.
Session recording tools like Smartlook capture everything your users do, including where they click, which pages they visit, which features they use, how much time they spend with the product, and much more.
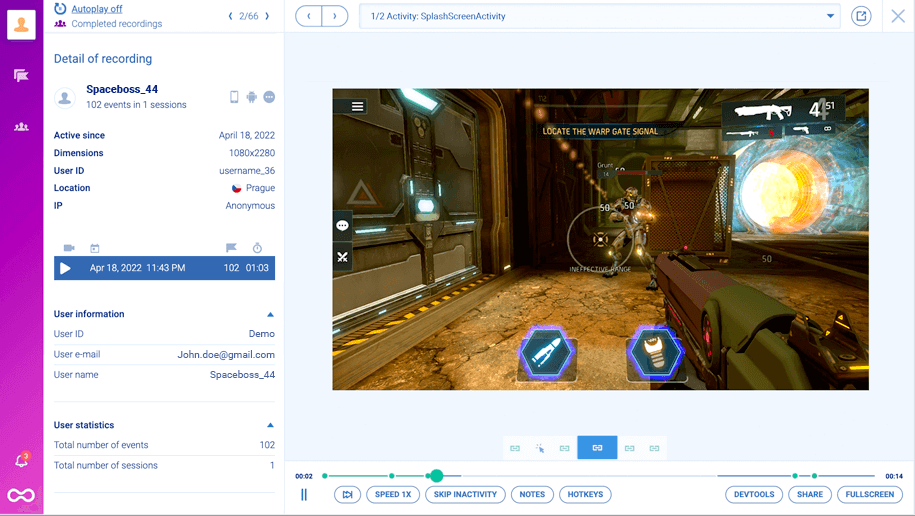
For example, take a look at the Smartlook session recording below:
The session recording video shows a user navigating an onboarding tutorial. You can observe the user experience in detail, including which steps people skim through, which ones they focus on, and where they hesitate.
These qualitative product experience insights are accompanied by quantitative user data about:
- Each event that was triggered during the session (under the video).
- The user’s device, location, and session duration (to the left).
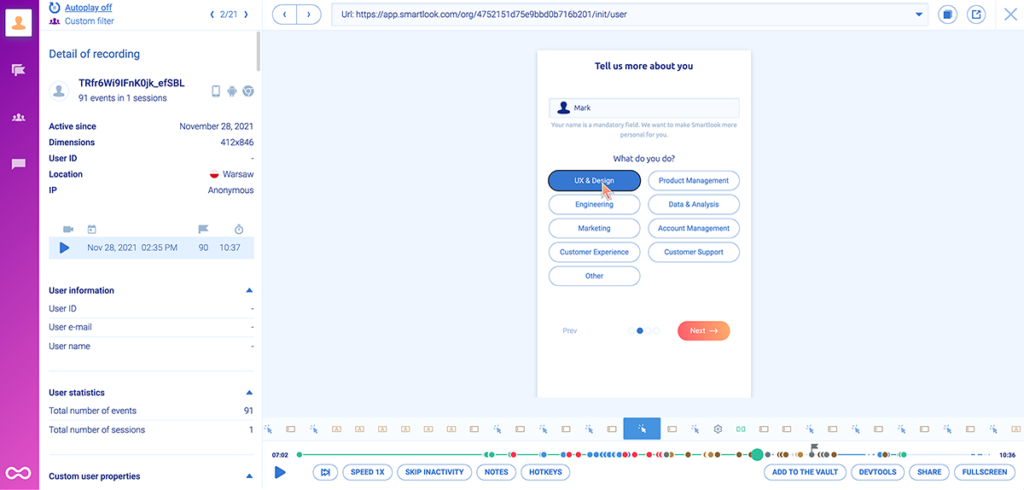
For the purposes of user analytics, you can also zero in on the recordings of individual users.
As you can see in the screenshot below, the “User information” section contains identifying details, like email and username.
If you configure our Identify API, you can jump straight into the session recordings of users based on one of these identifiers.
This capability allows product and marketing teams to watch how valuable customers interact with the product, which helps them:
- Understand which features attract their attention and which ones don’t.
- Inform the product development process with reliable insights.
- Come up with ideas for attracting other similar customers.
In fact, CricHeroes — the world’s largest cricket network — uses Smartlook’s session recordings and segmentation capabilities to get a deep understanding of the customer experience.

4. Funnel analysis
Funnel analysis is the process of monitoring how users navigate different flows in your product, like:
- Checkouts.
- Onboarding tutorials.
- Levels in a mobile game, and more.
In the context of user analytics, funnels help you understand how individual users navigate these flows and where they struggle.
For example, with Smartlook, you can build a funnel by placing two or more events in the order you believe your users follow. Then, our tool automatically calculates the funnel’s conversion rate and the drop-offs between different steps, as you can see in the screenshot below.
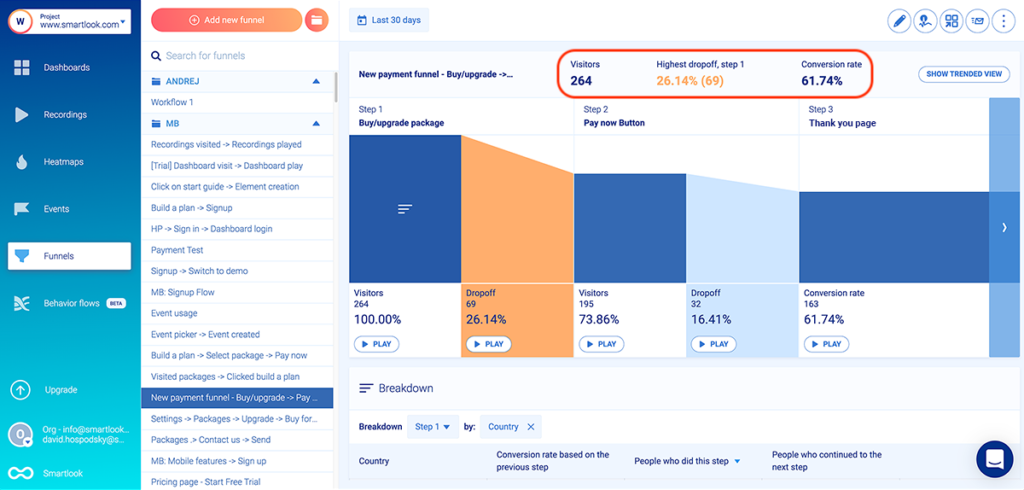
You can click on the “Play” button under each step, including the drop-offs, to jump into the relevant session recordings. This is a massive advantage over traditional web analytics tools (like Google Analytics), which only show where users drop off but can’t help you uncover why.
Once you’ve built your funnels, Smartlook lets you zero in on how different customers navigate them. You can do this by breaking down each funnel by:
- Users’ locations (country, city, or state/region) and technologies (device, browser, and operating system).
- Customevent properties, like users’ pricing plans or how much they’ve spent with your business over the last year.

Lastly, if you use the revenue property when defining your events, Smartlook can calculate the total revenue of your funnels, as well as how much revenue you’re losing from funnel drop-offs.

Note: You can also set up our Anomaly Alerts and receive notifications in case of a sudden spike or drop-off in the conversion rates of your funnels.
Start finding user behavior insights with Smartlook today
Smartlook gives you robust analytics that show what your users are doing — paired with session recordings and heatmaps that show why — all in one place.
Our tool records all user sessions on your website, web app, or native mobile app with a single code snippet. With all that behavior data automatically captured, you can analyze the entire user journey, monitor important actions and funnels, create detailed customer segments, and track key product metrics, like active users and retention.
Additionally, Smartlook supports integrations with CRMs, analytics platforms, A/B testing tools, and other widely-used solutions, making it easy to fit our tool into your existing workflow.
To see how Smartlook can help your business (without setting it up), book a free demo with our team. We’ve found that customers who go through the demo have a 70% faster onboarding time and leave positive reviews 99% of the time.
If you want to give Smartlook a go yourself, start a full-featured, 30-day trial (no credit card required).