Web analytics tools collect data about who’s visiting your website or web app and how they’re interacting with it. This data is invaluable for understanding and improving the user experience (UX).
In the early days of web analytics, traditional analytics tools like Google Analytics and Kissmetrics focused on collecting quantitative data — e.g., pageviews, sessions, and traffic sources — and visualizing it in reports and dashboards.
Today, these traditional quantitative analytics are a good starting point for analyzing your traffic. However, they also have a big downside — they can’t tell you why users do what they do, which makes it difficult to improve their experience.
For example, quantitative data can show you which steps in your checkout flow lead to the most drop-offs. But to understand why, you typically need qualitative data — the subjective insights about what users want or why they behave the way they do.
Traditional quantitative analytics tools don’t collect this data. As a result, finding and fixing the problems that affect your UX and conversions can take months of ideating and A/B testing.
That’s why the field of web analytics tools has evolved to include behavior analytics and visual user insights tools, like Smartlook and Hotjar.
These new analytics solutions collect both quantitative data and qualitative data, so you can go beyond the raw numbers and truly understand your users’ behavior. The insights they provide allow you to improve your UX, boost your conversion rates, fix bugs, and much more.
In this article, we’ll review the 15 best web analytics tools, which we’ve divided into three categories based on the insights they provide about your users.
4 behavior analytics and visual user insights tools
1. Smartlook
2. Hotjar
3. Crazy Egg
4. Matomo
9 traditional quantitative analytics tools
5. Google Analytics
6. Clicky
7. Kissmetrics
8. Amplitude
9. Woopra
10. Mixpanel
11. Adobe Analytics
12. Chartbeat
13. Open Web Analytics
2 bonus tools for SEO and competitor analysis
14. Semrush
15. Similarweb
Request a free demo or try out Smartlook today with our full-featured, 30-day trial: no credit card required. Our platform combines the power of quantitative and qualitative data to help you improve your users’ experience, boost your conversion rates, and fix bugs faster.
4 behavior analytics and visual user insights tools
The tools in this category offer a mix of quantitative and qualitative analytics features. This combination is extremely useful, as it can show you:
- What users do on your site or app, thanks to quantitative analytics features like event tracking and funnel analysis.
- The subjective insights about what users really want or why they behave the way they do, thanks to qualitative analytics features like session replays and heatmaps.
Put simply, these tools let you go beyond the raw numbers and get an in-depth, nuanced view of your users’ actual experience.
1. Smartlook
- Pricing: Smartlook has a free plan that captures up to 3,000 user sessions/month. Paid plans start at $55/month and come with a full-featured, 30-day trial (no credit card required).
- Key features: Session recordings, heatmaps, event tracking, and funnel analysis.
Smartlook is our product analytics and visual user insights platform that minimizes collection of personal or sensitive data. You can use it to analyze user behavior on websites, as well as web and mobile apps.
Smartlook gives you robust analytics that show what your users are doing — paired with session recordings and heatmaps that show why — all in one place.
Record all user sessions on your website or app with a single code snippet
Session recordings (or session replays) capture a user’s entire session on a site or mobile app, with every interaction in it. As a result, you can see the context behind users’ actions, which helps you understand why they do what they do.
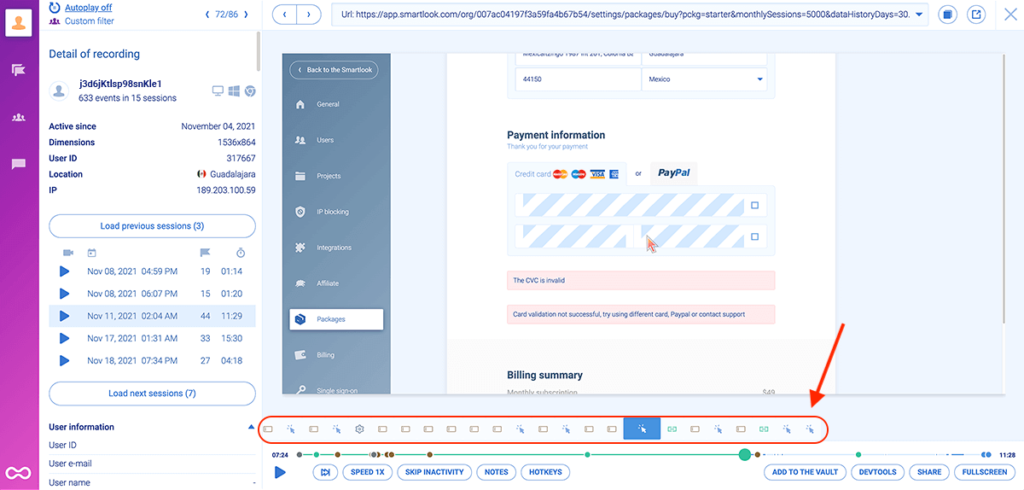
For example, the screenshot below shows a session replay of a user going through a checkout process.
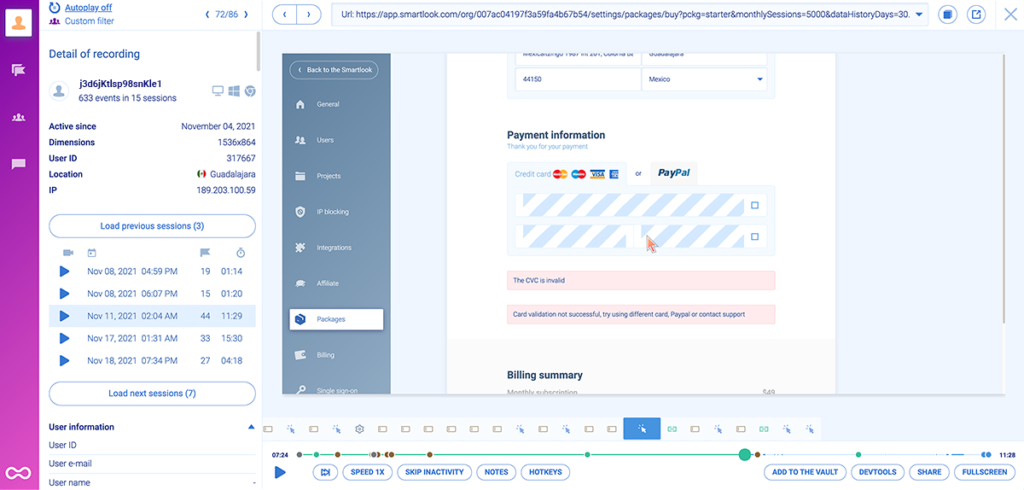
As you can see, the session recording shows the reason for the unsuccessful checkout, which is often difficult or impossible to uncover with quantitative data alone.
Additionally, there’s tons of other useful information, like:
- A timeline of all actions the user performed during the session (under the session replay).
- Their device, operating system, and location (to the left of the session replay).
- All recorded sessions for this user, as well as their time and date.
Additionally, Smartlook is designed to work with as little intervention from your team as possible.
That’s why you only need to install one code snippet and our platform will automatically:
- Record all user sessions on your site or app (no sampling). As a result, you won’t be missing important data when it comes time to analyze user behavior.
- Track user clicks, pageviews (URL visits), and text inputs. This allows you to monitor these interactions as events, without a manual tracking setup, as we’ll discuss in the next section.
- Detect JavaScript errors and moments of frustration. You can instantly find and watch sessions of users who were frustrated or experienced an error to understand the problem.
You’ll know Smartlook is working as soon as your first session recording comes in — which typically takes no more than a few minutes after installing our code snippet.
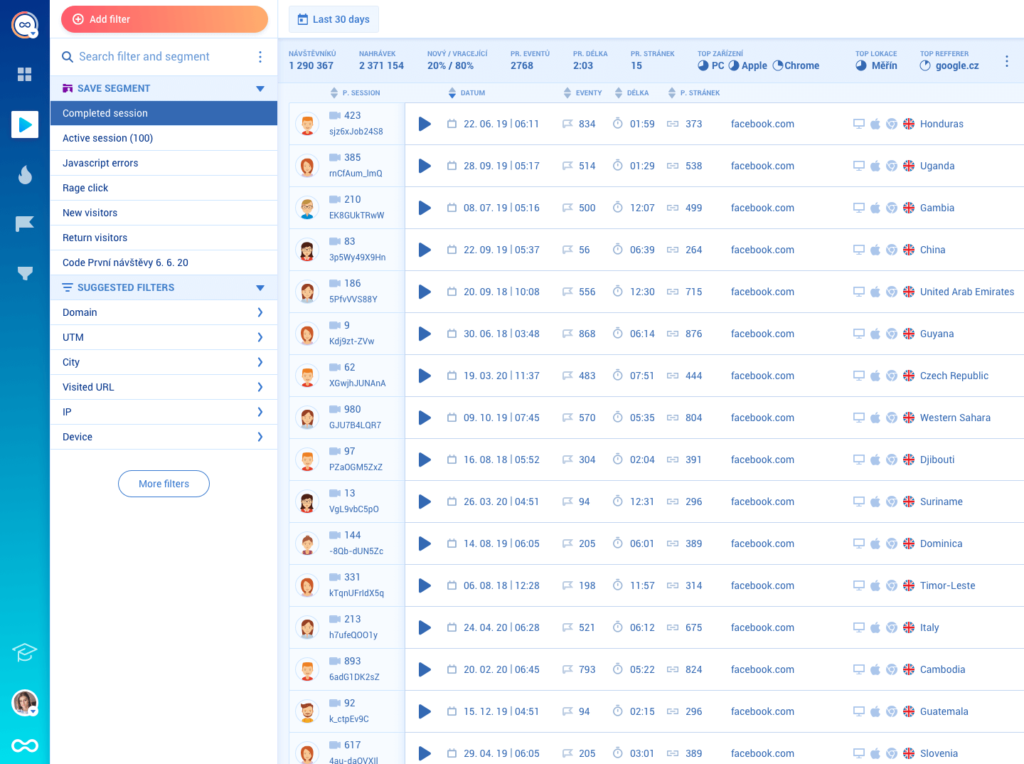
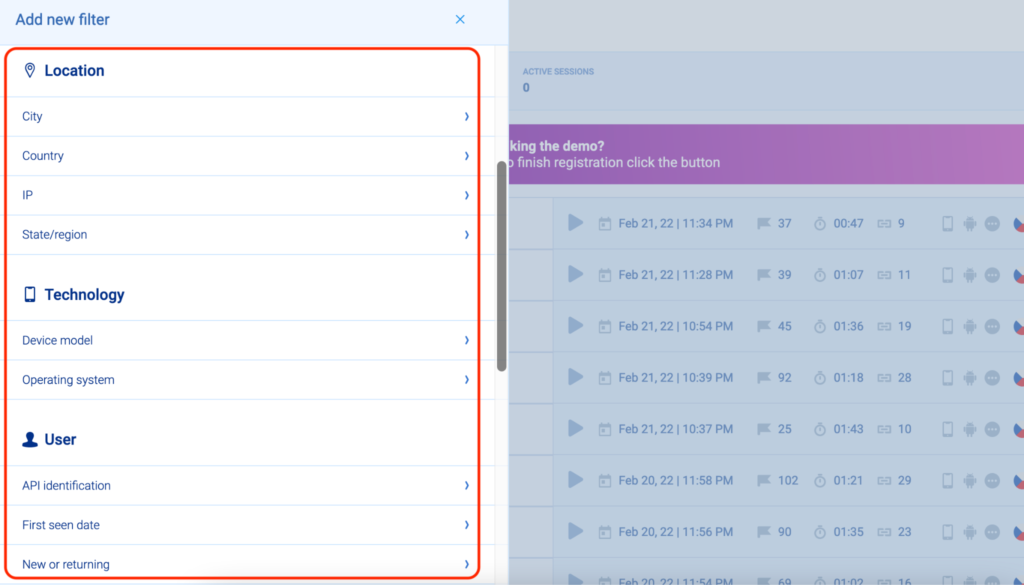
Our platform also has 30+ filters to quickly find relevant session recordings.
For example, there are location-based filters (like city and country) and technology filters (like devices and operating systems).
In short, Smartlook ensures you can always find the precise session you need. Like Cyn Armistead, Technical Support Engineer at Travel Syndication Technology, says:
“I love Smartlook’s filtering. I can drill down to exactly what I know about a session, and find what I’m looking for so easily.”
Lastly, Smartlook’s session recorder does not capture sensitive information such as passwords and credit card details. Additionally, you can also mask and exclude additional elements from appearing in session replays.
Track user actions (events) and build funnels without coding
Event tracking — the ability to monitor specific user actions over time — is one of the most popular capabilities in web analytics tools.
However, many tools that have this functionality (including ones listed below like Hotjar, Google Analytics, and Mixpanel) require a manual event tracking setup. This means you need to plan the actions you want to track in advance, then implement tracking via code changes or with a tool like Google Tag Manager.
In contrast, Smartlook automatically captures all user interactions (via always-on session recordings) and lets you track events without coding. As we showed in the previous section, these actions appear right below each session recording.
Automatic data capture removes the most difficult parts of the event tracking process: the planning and manual implementation.
As Louay Ali, Principal Product Owner at Rabbit Mart, says:
“The data we need just falls into place, with minimal to zero intervention from my team.”
Since the interaction data is collected automatically, all you need to do is select which actions to track in your dashboard as events. Selecting which events to track is called defining an event and can be done in different ways, without any coding.
For example, you can use our no-code event picker to define an event by clicking on elements in your site or app’s UI, as shown in the screenshot below.
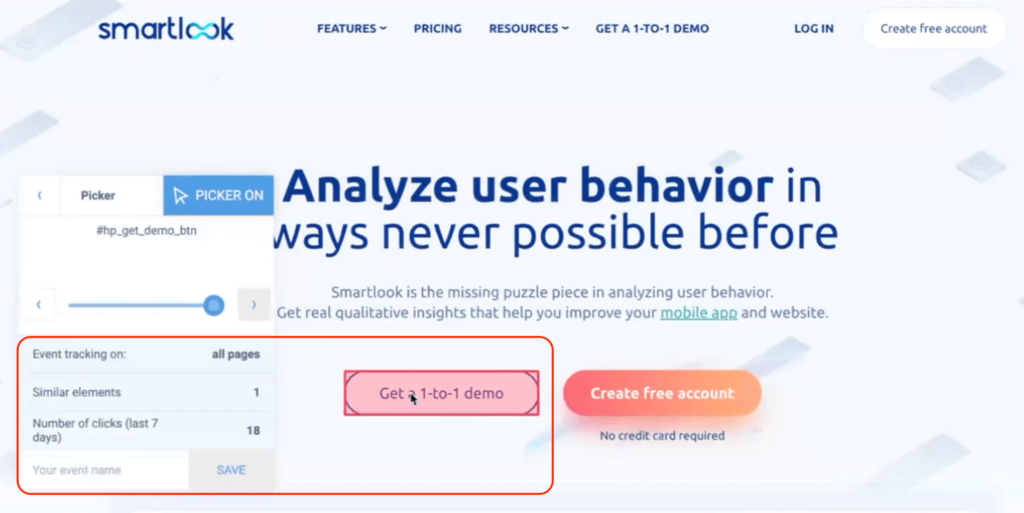
You can also create custom events with JavaScript to track pretty much everything else outside of the standard events.
We’ve explained the process of tracking events in detail in other articles, so if you’re interested, check out our guide to tracking user activity on websites.
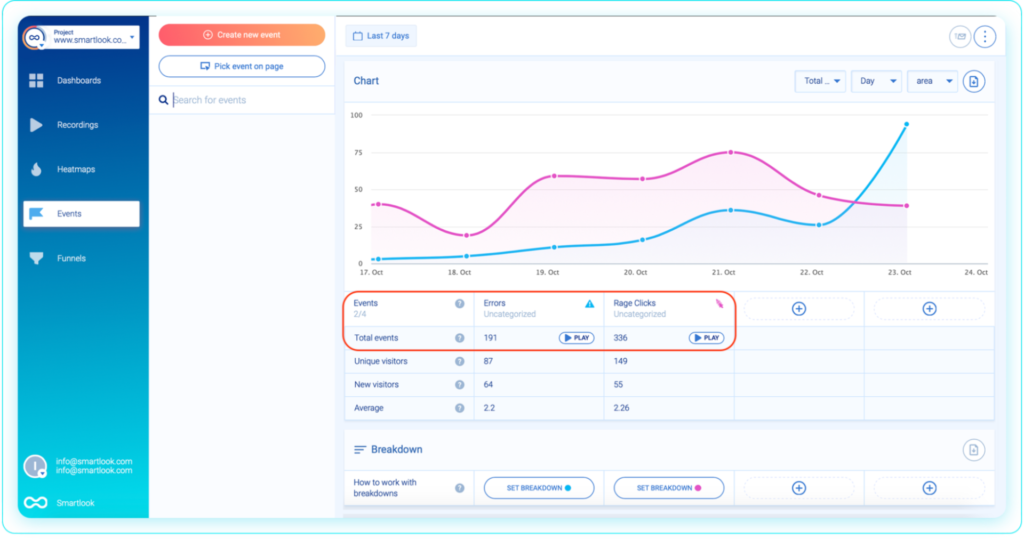
When you define an event, Smartlook immediately identifies every instance of that event, going back as far as your data retention plan goes. This allows the event tracking visualization to appear instantly (like in the GIF below), so you don’t have to wait days or weeks for new data collection.
Once your relevant events are defined, you can:
- Perform quantitative analytics to answer questions like “How many times was the CTA on our landing page clicked during our marketing campaign?”.
- Filter session recordings based on events that took place in them. Just open the event in question, click “Play”, and Smartlook will take you to all the sessions where that event took place. This means you can find relevant session recordings faster and see the full context behind users’ actions, which quantitative data alone can’t provide.
Another crucial use case for event tracking is building funnels.
Funnels are sequences of steps (i.e., events) users go through to complete a goal, like purchasing a product or completing an onboarding tutorial. Building funnels lets you analyze customer behavior through these flows, find out where people drop off, and calculate conversion rates.
With Smartlook, you can create funnels by placing two or more events in the order you believe your users follow. Then, the funnel visualization appears instantly.
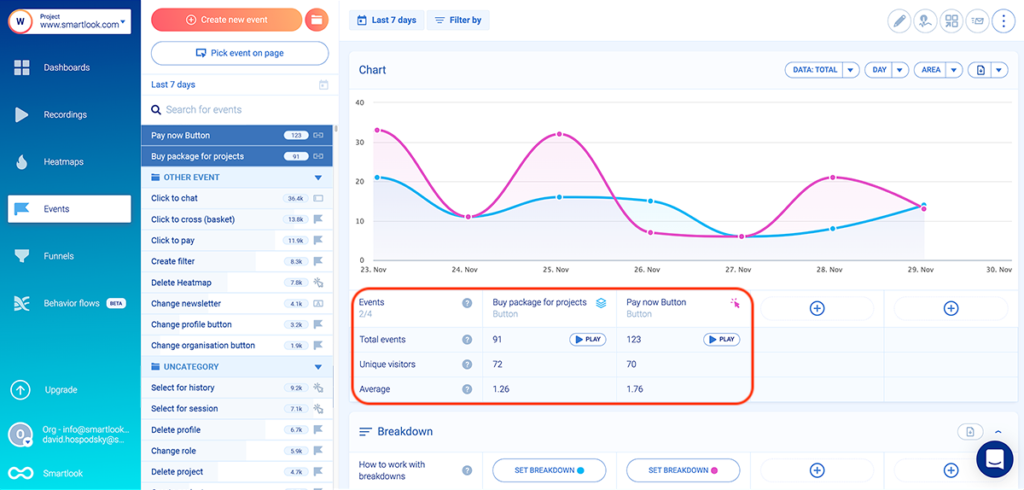
Our funnel analysis feature shows you the funnel’s overall conversion rate, as well as the conversion rates and drop-offs between each step.
For example, the screenshot above shows a 3-step checkout funnel, which can be built entirely without coding.
- Event 1: A visitor clicks on the “Buy package” button (select the button with our no-code event picker to define the event).
- Event 2: A visitor clicks on the “Pay now” button (again, select the button with our no-code event picker).
- Event 3: The visitor arrives on the “Thank you” page (use the “Visited URL” standard event and enter the page URL).
You can try the event tracking and funnel analysis features yourself with Smartlook’s live public demo (no registration or credit card required).
Combine session recordings with funnel analysis to uncover why users drop-off
While you can build funnels with many traditional quantitative analytics tools, you’re in the dark when it comes to understanding the problems that lead visitors to drop off after a certain step.
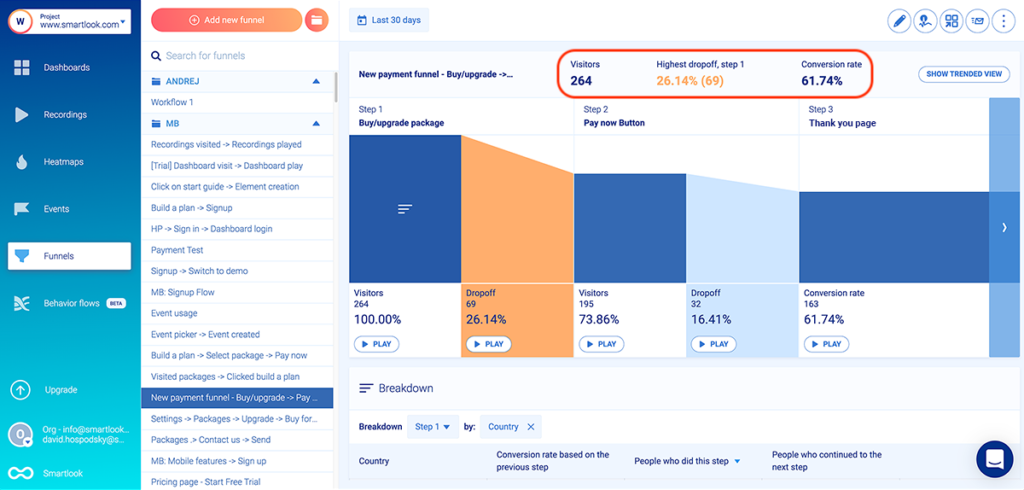
That’s why Smartlook lets you combine session recordings with funnel analysis to quickly find opportunities for reducing drop-offs and boosting your conversion rates.
As you can see, 73.86% of all visitors who entered the checkout funnel we just showed clicked on the “Pay now” button (Step 2). However, only 61.74% of those same visitors landed on the “Thank you” page (Step 3).
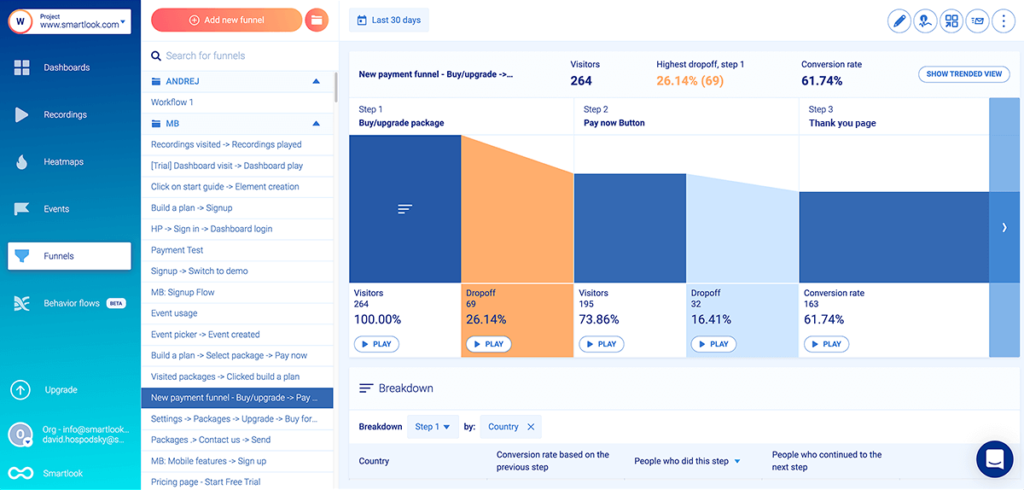
Visitors who selected a product, went through checkout, and clicked on “Pay now” clearly want to buy, so there’s a problem here.
Now, if you built this funnel in Google Analytics or another quantitative analytics tool, you’d have to start guessing what went wrong. Typically, you’d have to go through the process yourself, create hypotheses, and A/B test them until you resolve the issue (which isn’t guaranteed).
However, with Smartlook, you don’t need to guess, because you can simply watch the session replays of users who dropped off between steps two and three.
As you can see, there’s a “Play” button under each step of the funnel, including the drop-off stages. Clicking that button takes you to the session recordings of the 16.41% of users who dropped off, so you can find out why they didn’t check out.
AstroPay — a fintech startup and Smartlook customer — used this process to research and optimize their cryptocurrency purchase flow.
The funnels they built showed that many users didn’t complete their cryptocurrency purchase process after starting it. With Smartlook, AstroPay’s team was able to watch the session replays of users who dropped off to uncover two crucial insights:
- Some users dropped off because there were way too many steps in the purchase process.
- After purchasing, many users spent minutes anxiously looking for the cryptocurrency in their wallet, not realizing the transaction was still pending.
As a result, AstroPay’s team made a data-driven redesign of their cryptocurrency purchase flow. They removed unnecessary steps and added a “Purchase Pending” banner, which led to a 56% lift in conversions.
For a detailed introduction to Smartlook that’s tailored to your business, schedule a demo with our team. Or start analyzing and improving your users’ experience today with Smartlook’s full-featured, 30-day trial — no credit card required. If you need more time to evaluate, use our forever-free plan as long as you need.
2. Hotjar
- Pricing: The Hotjar Observe product (which includes session recordings and heatmaps) has a free plan for recording 35 daily user sessions, with paid plans starting at $32/month. The Ask product (which includes user feedback and surveys) also has a free plan for capturing 20 monthly responses, while the paid plans start at $48/month.
- Key features: Session recordings, heatmaps, user feedback widgets, and surveys.
Hotjar is one of the most popular behavior analytics tools out there. Today, there are actually two Hotjar products: Observe, which includes session recordings and heatmaps, and Ask, which includes user feedback widgets and surveys. Overall, both products have a low barrier to entry and are useful for marketing, product, and UX teams.
Two downsides to Hotjar are its limited quantitative analytics capabilities and the lack of a funnel analysis tool, as we’ve discussed in our article on the 12 best Hotjar alternatives.
3. Crazy Egg
- Pricing: Plans start at $29/month, with a 30-day free trial. All plans are billed annually and there’s no free forever plan.
- Key features: Heatmaps, session recordings, A/B testing, and surveys.
Crazy Egg is a website analytics tool that has features for analyzing user behavior and conversion rate optimization (CRO). It offers heatmaps, session recordings, A/B testing, and features for tracking ad traffic on your website.
It’s worth noting that Crazy Egg samples your website’s traffic, instead of recording every session on your site (like Smartlook). As a result, you might be missing important session replays when analyzing user behavior.
4. Matomo (formerly Piwik)
- Pricing: Matomo offers a limited free version, which is self-hosted, meaning you need to maintain it on your own server. If you use the free version, features like funnels ($179/year) and session recordings ($229/year) are available as paid add-ons. Customizable paid plans start at $23/month and come with more built-in analytics features.
- Key features: Session recordings, heatmaps, funnel analysis, and form analytics.
Matomo advertises itself as a privacy-friendly alternative to Google Analytics. However, unlike Google Analytics, Matomo also has qualitative analytics features like session recordings and heatmaps (available as paid plugins), in addition to its traditional quantitative analytics features like funnels and form analytics.
Matomo also offers event tracking, but it doesn’t collect user interaction data automatically like Smartlook. Instead, it requires a manual setup via the Matomo Tag Manager, which is much more time-consuming.
9 traditional quantitative analytics tools
Traditional web analytics tools collect quantitative data about your web traffic, like pageviews, time on page, number of sessions, bounce rates, and more. These stats and metrics are usually displayed in pre-made dashboards. Additionally, most of the tools below also let you build custom reports, charts, and dashboards with data that’s important to you.
5. Google Analytics

- Pricing: Google Analytics is free.
- Key features: Marketing campaign attribution, pre-made audience reports, segmentation, and custom reports.
Google Analytics was one of the first web analytics software solutions to be released and it remains the most popular one. As a traditional quantitative tool, it reports on top-level metrics like web page visits, sessions, time on page, bounce rates, referral sources, and much more. And since it’s a free web analytics tool, Google Analytics is a great choice for small website owners who just need aggregate data about their traffic.
However, the lack of session recordings and the manual event tracking setup often prevent teams from finding out why users don’t convert, which drives them to look for an alternative to Google Analytics.
You can overcome some of these limitations by integrating Google Analytics with Smartlook.
6. Clicky
- Pricing: Free plan for one website with up to 3,000 pageviews in total. Paid plans start at $9.99/month and start with a 21-day free trial.
- Key features: Real-time quantitative analytics, visitor and action logs, heatmaps, uptime monitoring.
Clicky is a privacy-friendly, web analytics tool, which collects real-time analytics data about your traffic. Besides standard quantitative analytics features, Clicky also offers additional capabilities like uptime monitoring and heatmaps.
7. Kissmetrics
- Pricing: Start at $299/month for up to 10,000 monthly tracked users. There’s no free plan or trial, only a demo.
- Key features: Key metrics tracking, cohort analysis, funnel analysis, and customer activity reports.
Kissmetrics is an analytics tool for SaaS and e-commerce businesses. It focuses on quantitative analytics and it can report on metrics like new subscriptions, revenue, churn rate per customer segment, time to sign up, and more. It can also tie every action on your site to a person, provided you have the time and know-how to implement it correctly.
8. Amplitude
- Pricing: No publicly available pricing plans. The lowest price that Amplitude customers report is around $5,000/year paid annually with a 20% discount.
- Key features: Advanced charts for analyzing quantitative data, A/B testing, customizable dashboards, and segmentation.
Amplitude is one of the most comprehensive quantitative analytics platforms out there. It offers tons of ways to analyze quantitative data and display it in different charts, reports, and dashboards. The platform is broken down into a few products that serve different use cases (like analytics and experimentation), each of which can be purchased separately.
Note that Amplitude can be difficult to implement and utilize correctly if you don’t have engineering resources and data analytics know-how, as we’ve discussed in our article comparing Amplitude, Mixpanel, and Smartlook.
9. Woopra
- Pricing: Woopra offers a free plan for tracking up to 500,000 user actions per month. Paid plans start at $349/month, with a 14-day free plan.
- Key features: User journey mapping, metric trend analysis, retention analysis, and user engagement.
Woopra is a quantitative analytics platform for analyzing the entire user journey. It has features for product, marketing, sales, and customer support teams. Woopra also integrates with other popular software solutions like Slack, HubSpot, Stripe, ZenDesk, WordPress, and more.
10. Mixpanel
- Pricing: Mixpanel has a free plan for up to 100,000 tracked users (unique visitors that performed at least one event). Paid plans start at $25/month, with the option to build custom plans.
- Key features: Custom reports and dashboards for analyzing quantitative data, conversion funnels, user segmentation, and retention analysis.
Mixpanel is a product analytics tool that helps you analyze conversions, app usage, and retention rate across user segments. You can use it to build reports and custom dashboards for monitoring product adoption, conversion rates, and other important metrics.
Additionally, you can integrate Mixpanel with Smartlook. Using both tools together can provide a nuanced understanding of visitors’ behavior thanks to Mixpanel’s quantitative capabilities and Smartlook’s session recordings and heatmaps.
11. Adobe Analytics
- Pricing: No publicly available pricing plans or a free plan.
- Key features: Real-time analytics, customer journey analysis, custom reports, predictive analytics.
Like Amplitude, Adobe Analytics is an enterprise analytics platform with a focus on quantitative analytics. It brings together a suite of tools that can help you capture and analyze real-time data from the entire customer journey. Additionally, its predictive analytics capabilities collect customer data and make predictions about their future behavior. Adobe also has other great tools that might be helpful in analyzing and creating, that include: Adobe InCopy, Adobe Express, etc.
12. Chartbeat
- Pricing: No pre-made pricing plans or free plans. Chartbeat customers report that prices start at $7,000/year.
- Key features: Real-time content analytics, headline and image testing, video analytics, and integrations with Facebook Instant Articles and Google AMP.
Chartbeat is a real-time content analytics tool for content publishers. It helps publishers understand how audiences are connecting with their content across channels and devices. It also has features for testing images and headlines to determine which ones capture readers’ attention.
13. Open Web Analytics
- Pricing: Open Web Analytics is a free framework.
- Key features: Heatmaps, custom event tracking, traffic source tracking, and analytics dashboards.
Open Web Analytics is an open-source framework, which gives you granular control over how you collect and analyze user behavior data. You can use it under your own domain or as part of a web app. However, it does require programming skills, as you have to set up and run it on your own server.
Bonus: 2 tools for SEO and competitor analysis
These final two tools can help you analyze your website’s organic rankings and pay-per-click (PPC) campaigns, as well as monitor your competitors’ performance.
14. Semrush
- Pricing: Free account is available with limited features. Paid plans start at $119.95/month with a free 7-day trial.
- Key features: Keyword tracking (organic and PPC), domain and backlink analytics, on-page SEO analysis, and competitor analytics.
Semrush is a widely-used search engine marketing platform. Its primary focus is on helping you grow organic traffic via search engine optimization (SEO) with its keyword research tool, backlink analysis, technical SEO audits, and more. Besides that, Semrush also has features analyzing PPC campaigns, social media management, market research, and content marketing.
15. Similarweb
- Pricing: Free trial is available for one user and limited data history. Paid plans start at $199/month with a free 7-day trial.
- Key features: Company and industry benchmarks, competitive analysis, keyword research, affiliate research.
Similarweb is one of the most popular ways to get insights into your competitors’ websites. The tool is really simple to use — you just enter a website URL and Similarweb gives you information about its organic rankings, competitors, marketing channels, audience, outgoing links, and tech stack.
Analyze and improve your users’ experience with Smartlook today
Smartlook is the only combined product analytics and visual user insights that won’t take your team forever to set up. Our platform automatically records all user sessions and interactions in your site or app, so you get crucial behavior data with minimal to no intervention from your team.
You can see Smartlook in action without spending any time registering or setting up our platform on your site or app. Just book a free demo using this form and our team will give you a detailed Smartlook presentation that’s tailored to your business at a convenient time for you. Customers leave positive feedback about our demos 99% of the time, so you’re bound to learn something useful from our team.
Lastly, you can also give Smartlook a go yourself by signing up for a full-featured, 30-day trial of Smartlook today (no credit card required).