![The top 16 most important mobile app KPIs to measure performance [updated]](https://hpassets.smartlook.com/wp-content/uploads/sites/2/2023/02/10153930/blog_the-top-16-most-important-mobile-app-kpis-to-measure-performance.png)

Business is all about money and numbers.
A mobile app is a powerful business tool — its success needs to be measured just like any other business key metrics. Measurements that require special attention include tracking revenue, average check size, customer acquisition costs, retention rate, downloads, and user satisfaction.
After reading this article, you’ll understand the most crucial mobile application performance metrics. See the table of contents below:
UX and performance metrics
Engagement KPI metrics
- Session length and depth
- Average screens per visit
- Daily, weekly, and monthly active users
- Stickiness ratio
- Churn rate
- Retention rate
Revenue metrics
- Average revenue per user
- Purchases
- Time to first purchase
- Customer lifetime value (CLV)
- Mobile conversion rate
- Cost per install
Read the article to jump-start your mobile app KPI measurement journey.
Introduction to mobile app KPIs
A mobile app’s technical and marketing performance depends on analytics and metrics.
The first thing you’ll need is a mobile analytics tool to begin collecting data. Even if you build a minimum viable product (MVP), access to app analytics metrics will help you make it more cost-effective.
App analytics are crucial for future growth and success. There aren’t many options available when it comes to gaining valuable insight, including feedback, reviews, ratings, etc.
While the process of collecting and evaluating data begins after deployment, you need to think about analytics before developing your app or running marketing campaigns.
Keep in mind that many of the crucial decisions made in the development phase are based on performance expectations from a business standpoint.
How mobile app analytics differ from website analytics
Though mobile analytics may seem similar to website analytics, they’re completely different. Mobile analytics include plenty of metrics that can be used to improve your product and boost user retention to gain more potential end-users.
However, it can be daunting to understand which mobile app business metrics you need to pay attention to.
Before diving into the metrics, first, you’ll need to understand how web application and mobile app tracking differ:
- Website analytics measure page views, whereas mobile analytics measure screen views
- Website analytics measure site speed while mobile analytics measure app speed
- Website analytics use cookies to identify users, while mobile analytics rely on unique user ID
PRO TIP When choosing mobile analytics software, remember that it has to be compatible with your app’s architecture. For example, if you have an app in Flutter, Unity, or iOS, be sure that your analytics tool supports these mobile frameworks.
In the next section, you’ll learn about the most important mobile app performance KPIs and app user metrics and indicators. You’ll also discover which mobile app analytics metrics, channels, and tools you can use to measure them.
If you want to test the tools yourself, visit the open Smartlook demo environment. You can do the same with Firebase.
The most important mobile app business metrics and KPIs
In the mobile industry, app performance metrics can be divided into 3 categories:
- UX and performance metrics
- Engagement KPI metrics
- Revenue metrics
All of them are equally important for your ROI (return on investment) over a specific period. You can’t analyze and improve your mobile app – or your business – without this information.
Let’s talk about these metrics in detail.
UX and performance metrics
Mobile app performance metrics provide you with data relating to your app’s technical performance. These metrics allow you and your development team to improve your app from a technical standpoint.
With these metrics, you’ll be able to locate in-app performance issues that would otherwise go undetected. This includes slow loading, bugs, or problems with your app’s layout.
Included among UX and mobile app performance metrics, you’ll find the following:
- Load speed
- Devices and operating systems
- Screen resolution
- Crash reports
Load speed
App load speed refers to the amount of time it takes before your app is ready for user interaction. Mobile users don’t like waiting. Although they may have patience for an app download, they won’t hesitate to abandon or uninstall a slow application. For this reason, load times are essential for retaining mobile app users.
Measure your app’s loading time in Firebase by clicking on the Performance tab under the Release & Monitor menu.
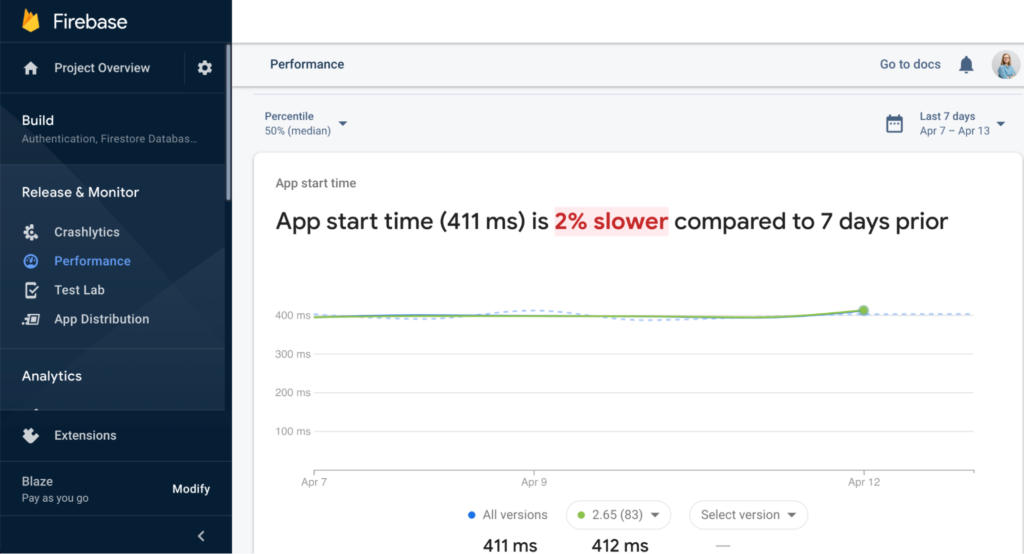
According to Think with Google, your app’s loading time can slow or grow your business — even a one-second delay can impact your bottom line.

Devices and operating systems
This metric displays which devices and operating systems your target audience uses. You can use this information in a variety of ways:
- To define your target audience better and make your offers more personalized. For example, if you’re a retailer, you can offer Apple products to iPhone users, thus influencing other metrics, like revenue.
- To adjust your quality assurance strategy. Once you’ve determined the most used devices, you can focus more on them while testing your application. This allows your developers to cater to the majority of your users.
Another good practice is to analyze user behavior regarding different operating systems. To do so, watch user session recordings. If your app has thousands of users, filter recordings by the operating system.
For example, curious about how to measure Android app performance? Use filtered recordings. Take a look below to see how easy it is to set up this filter.
Screen resolution
Similar to devices and operating systems, this metric gives you a better idea of what you need to test. Knowing the screen resolution of user devices is especially useful for Android apps.
While iPhones have a limited number of models with known resolution and screen sizes, Android phones come in such a wide variety of sizes and resolutions that it’s challenging to test Android apps. There is no shortage of manufacturers that produce Android phones.
Knowing what screen resolutions are the most popular allows you to make the quality assurance process more focused.
Crash reports
As operating systems differ and play by their own rules depending on the device, from time to time, apps experience crashes.
There are various reasons for this, including:
- The complexity of the product
- Unexpected user actions
- The specific operating system functionality of a particular device manufacturer
Crash reports display the exact moment a crash occurs, including what caused the problem and where. They are crucial to making the app development and maintenance process smoother. Furthermore, developers will spend less time triaging and troubleshooting in-app bugs.
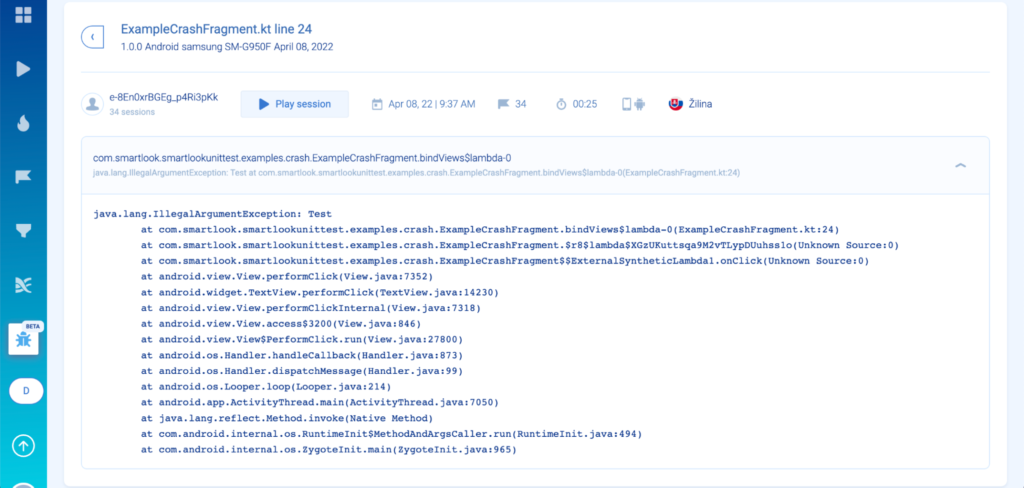
Crash reports are Smartlook’s new mobile feature. Currently, it’s being beta tested.
Engagement KPI metrics
Engagement metrics characterize how users interact with your app. By studying them, you can determine whether your users like your app or not. They often relate to user retention metrics — the better they are, the lower user acquisition costs may be.
You can track engagement with tools like Smartlook. As a qualitative analytics tool, it provides direct insight into user engagement. With session recordings, event tracking & funnels, understanding user engagement in your mobile app is a breeze.
Engagement rates are directly related to your revenue — be sure to pay close attention to them.
Among engagement KPI metrics, you’ll find:
- Session length and depth
- Average number of screens per visit
- Daily, weekly, and monthly active users
- Stickiness ratio
- Churn rate
- Retention rate
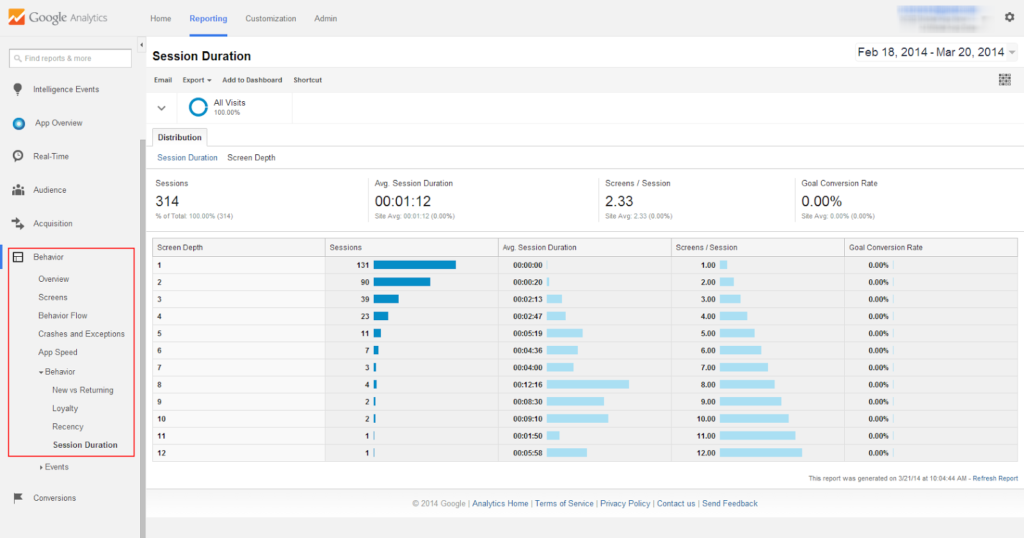
Session length and depth
Sessions refer to the time during which a user performs actions in your app. Regarding mobile, a session begins when a user opens an app and ends when there is no activity over a specific period. Session length can tell you a lot about how engaging your app is.
Session depth is another metric that displays how close a user gets to a targeted action, for example, a purchase.
You can find these metrics in Google Analytics (for mobile) under the “Behavior” tab.
Average screens per visit
This metric demonstrates the quality of the user experience design and your app’s ability to engage users. If the number of average screens per visit is high, your app has a user-friendly design. Such a design encourages users to transition between screens.
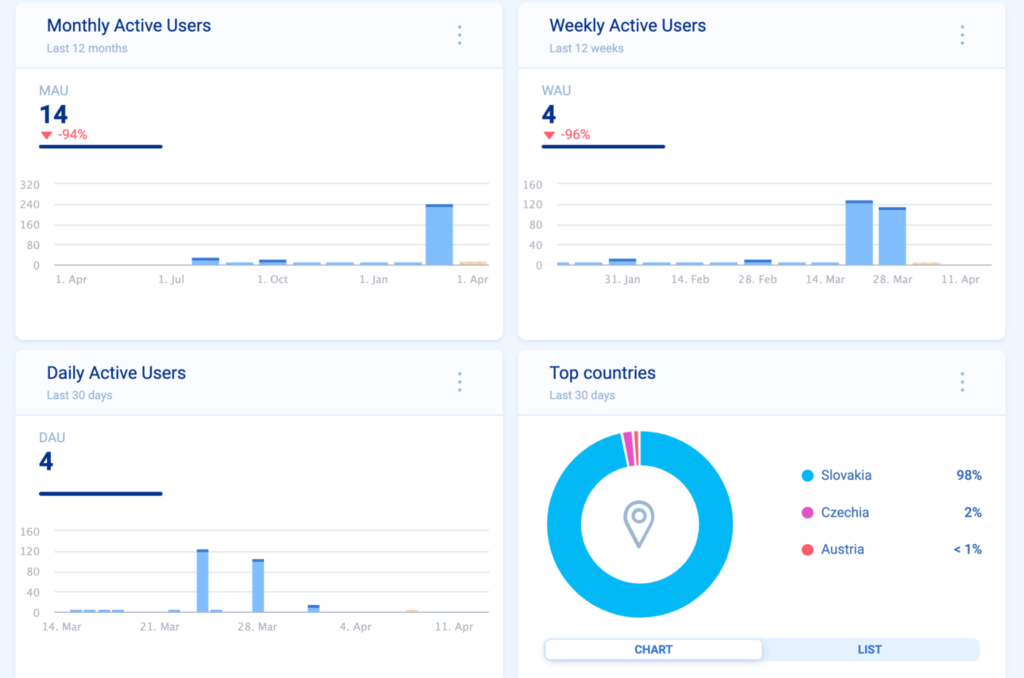
Daily, weekly, and monthly active users
Active users are those who launch your app often and perform actions using it.
There are 3 types of active users:
- Daily active users (DAUs): the total number of mobile users that logged into your app on a given day.
- Weekly active users (WAUs): the total number of users that logged into your app in a specific week.
- Monthly active users (MAUs): the total number of users that engaged with your app over a particular month.
Ideally, the number of active mobile users that engage with your app should grow each month, helping you lower the cost per acquisition. If you see that this number is lagging, you need to take action and adjust your marketing strategy.
For example, push notifications and marketing activities are an excellent way to get your numbers up and make your app more popular in app stores. Consider collecting favorable reviews and using word-of-mouth user recommendations to make your app more popular in app stores. This can lead to more downloads and, thus, more active users.
Test our mobile KPI dashboard and tile creation in the open demo environment.
Stickiness ratio
When discussing daily and monthly active users, the stickiness ratio is worth mentioning. It refers to the number of times a user logs into your app — you should aim at increasing it.
Calculate the stickiness ratio by dividing daily active users by monthly active users.
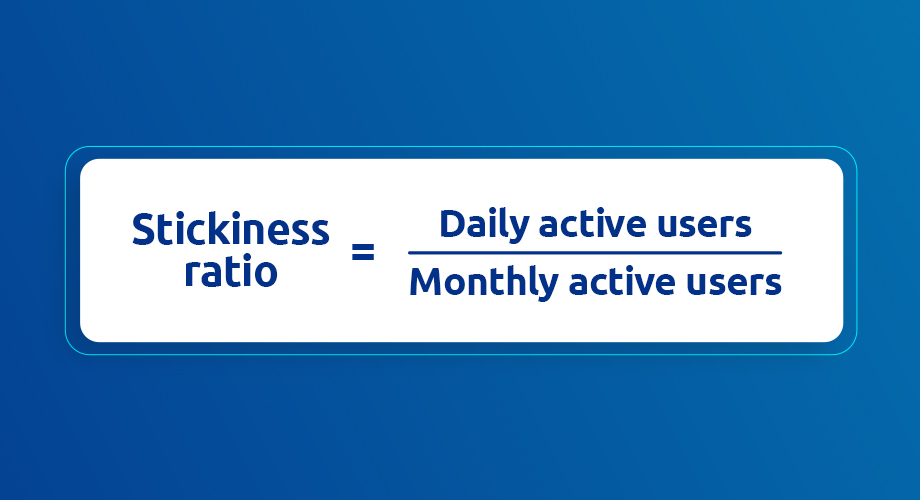
The stickiness ratio is critical as you want your users to log into your app regularly. You can also compare the stickiness ratio between different user categories. For example, you can check the stickiness ratio for paid vs. free users.
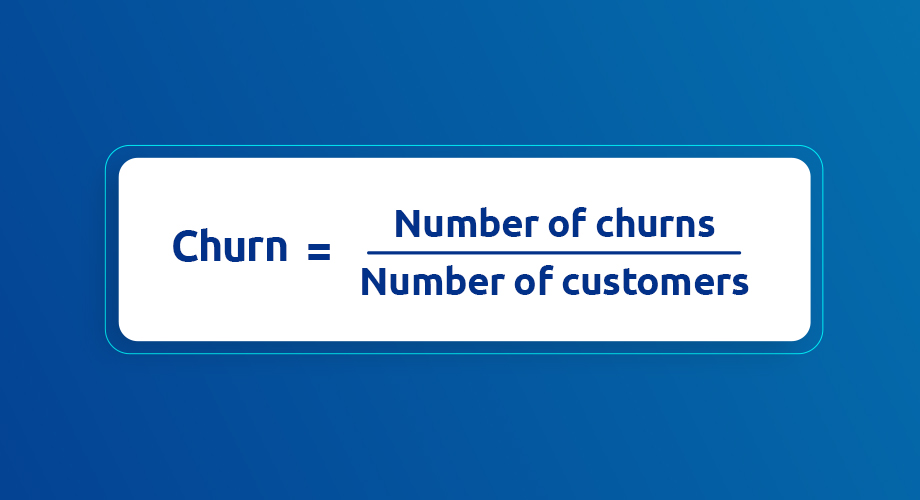
Churn rate
An app’s churn rate refers to the number of users that abandon an app after initial use. You want to keep this number as low as possible.
Suppose users abandon or uninstall your app in high numbers. In this case, it could be due to one of the following reasons:
- Your app crashes or lags
- There are few to no updates or no new content
- There are no more levels of achievement (concerning a gaming or gamified app)
- Your app is challenging to navigate
- Users don’t experience a “AHA” moment or don’t see the app’s value
Calculate the churn rate using this simple formula:
Retention rate
Contrary to the churn rate, the retention rate displays the number of users that return to your app after initial use. This metric highlights whether your app provides real value to users.
To calculate the retention rate, divide the number of monthly active users by the number of app installations. This will give you an aggregated retention rate.
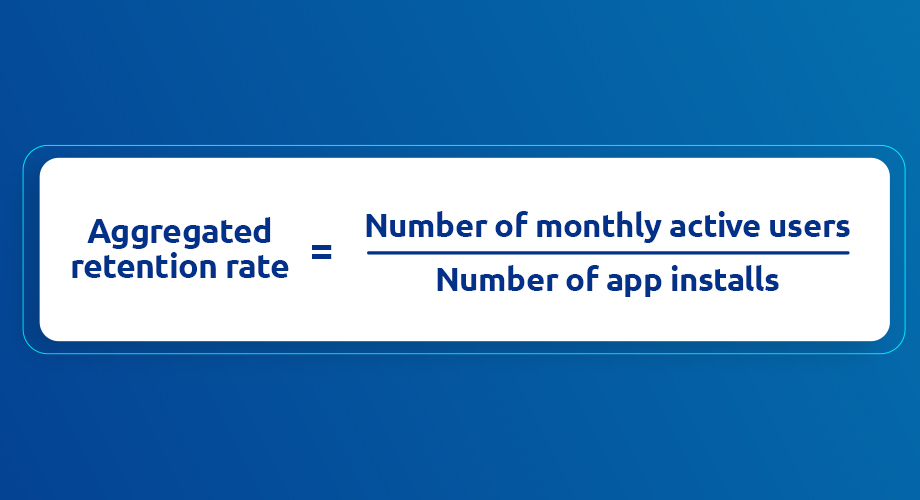
Let’s say you have 600 MAUs, and 1000 users installed your app. The aggregated retention rate is 60%.
Revenue metrics
This is what we’re all here for — revenue. Revenue refers to the profit gained from your app, whether through in-app purchases or purchases through the app (yes, those are different things).
These metrics also include money spent to acquire new users and buyers.
These metrics can be perceived as mobile app marketing KPIs, as many show the direct consequences of your marketing activities.
Among revenue metrics, you’ll find:
- Average revenue per user
- Purchases
- Time to first purchase
- User lifetime value
- Conversion rate
- Cost per install
Average revenue per user (ARPU)
How much do users spend on your app? This metric answers this question and shows you how to make additional sales. It also tells you how solvent your audience is.
Note that users from various operating systems demonstrate different behaviors. While Android users often spend more time in apps and make multiple small purchases, iOS users tend to have a larger average check size.
Purchases
How to measure the success of an app? Easy — by how many successful purchases are made through your app. You can calculate and compare the numbers if you also have a website. If the number of purchases doesn’t grow or starts to decline, you need to rethink your user journey or create more relevant offers using notifications and promo campaigns.
Funnel analysis is a perfect way to keep tabs on in-app purchases. First, you’ll need to create events.
For example, create an event that focuses on:
- Visits to a particular screen
- Tapping on a specific button
- Text-field input
- Custom events like interactions with non-tappable elements or images
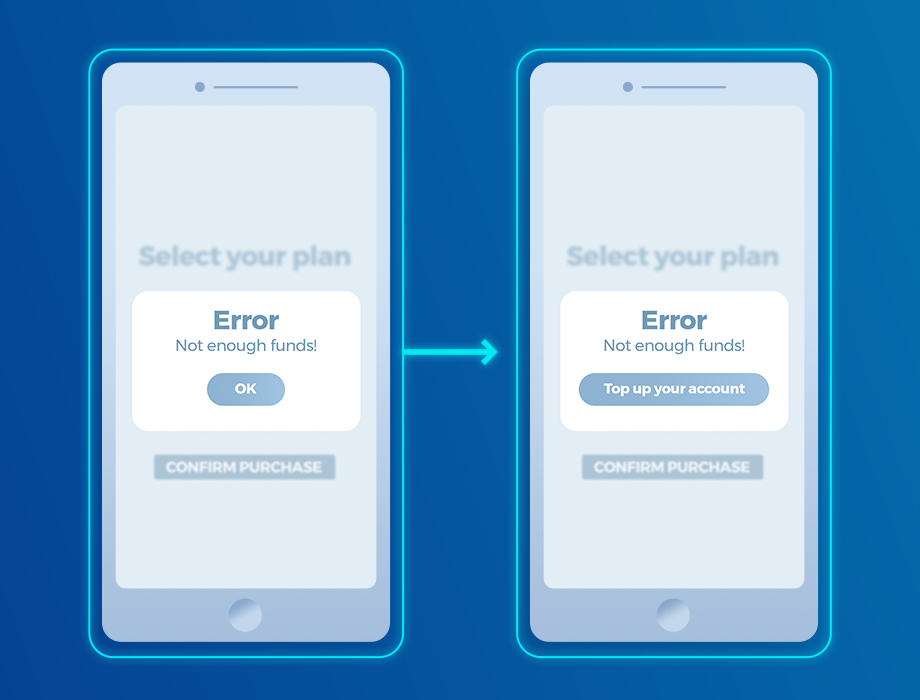
Once you’ve created an event, it’s time to make a funnel that maps the in-app user journey that leads towards a purchase. See the video below to learn how to create a 4-step purchase funnel. You’ll also learn how to view the session recordings of users that dropped off.
The most significant drop-off occurred in step 2 — something stopped 6 users from purchasing a plan. What happened? It looks like the users that dropped off didn’t have funds in their mobile accounts.
To optimize the funnel and convert those users, try swapping the “Ok” button with “Top up your account” button.
Time to first purchase
The time it takes a user to make a purchase differs from industry to industry. You probably know the average for your domain. If the time it takes your users is longer than average (many app session intervals), think about encouraging people to buy and shortening the path to checkout. This is a surefire way to improve app conversion rates.
Knowing the benchmarks of the average time to purchase in your industry is a great way to see how you compare to the competition.
If your time to purchase is higher than the industry average, think of new ways to encourage your users to buy. For example, consider offering discounts, a loyalty program, or reducing friction in the sales funnel.
You can also segment your users based on buyer behavior. With segmented user groups, you can target users with personalized in-app campaigns. This should decrease purchase time among users who refrain from completing sales.
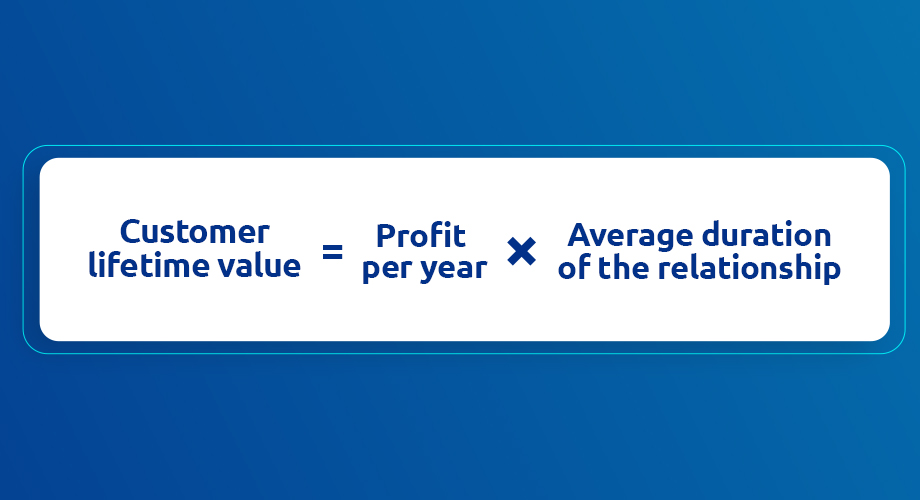
Customer lifetime value (CLV)
This metric displays the amount of revenue your mobile app users have brought you since using your app. Average Customer Lifetime value will allow you to determine how loyal your user base is and what you can do to target them in a more personalized and meaningful way.
How to calculate CLV? There are different methods, but we’ll focus on 2 of them.
The first method is excellent for SaaS mobile apps. Instead of focusing on the average revenue gained per user, this method looks at the average revenue per account (ARPA). Simply divide ARPA by the customer churn rate (we already discussed it).
A more general formula for this mobile app business metric is the following:
Mobile conversion rate
The conversion rate is one of the most critical metrics. While you may have thousands or even millions of users, the conversion rate really matters if your revenue comes from selling goods or services. Or if you earn money with in-app purchases or subscriptions.
To increase the conversion rate, make sure to do the following:
- Personalize your offering
- Craft easy to understand copy
- Adjust call-to-action buttons and ensure they work
- Test the most popular user paths
- Ensure safe payment methods
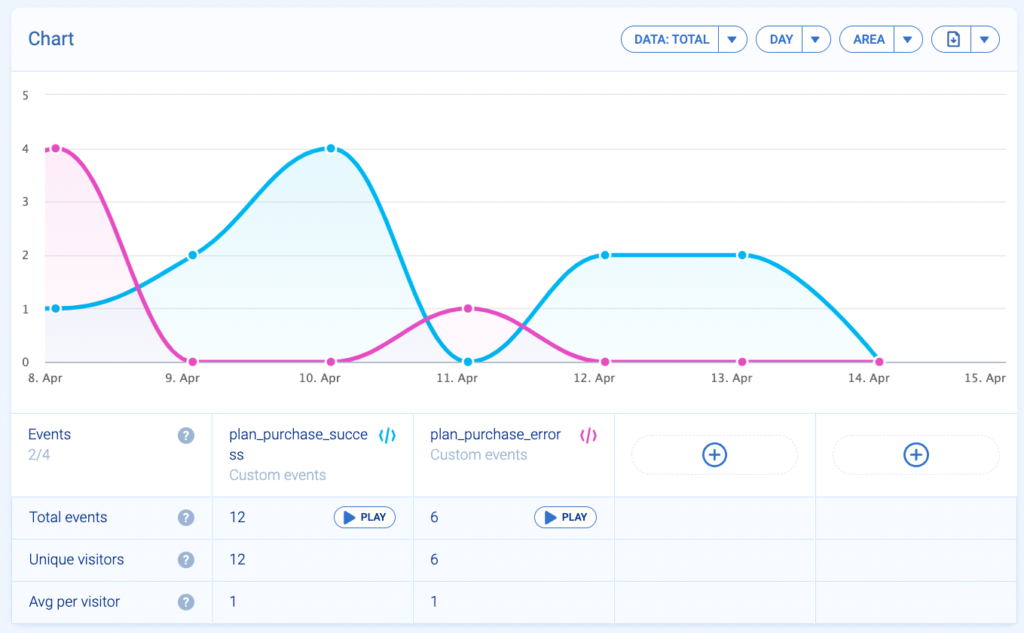
How do you track your mobile app conversions? The simplest way is to set up various events in your mobile analytics.
For example, let’s say you want to see how many app users successfully purchased a plan compared to those who faced an error and dropped off.
First, you’ll need to create 2 events:
- “Plan_purchase_success”
- “Plan_purchase_error”
You can test these 2 events in our free open demo environment. You’ll learn how the events work, plus you’ll be able to compare them by pressing Ctrl/Command and selecting them from the action sidebar.
Your comparison will look like the following graph:
Cost per install
It may be a challenge to acquire users, especially in the beginning. To do this effectively and determine how much revenue you’ll receive, you must first determine how much you spend to acquire a new user.
It’s also essential to identify which marketing channel brings you the highest percentage of customers — focus on it when planning your marketing budget.
These are the mobile app metrics you need to focus on most, whether you launched your app yesterday or five years ago.
Mobile app measurement: final thoughts
In this article, we broke down the top mobile app KPIs and app performance metrics for any mobile app. Keep in mind that your mobile product may require additional reports from Google Analytics. If you wish to improve your app, you need to understand how to track mobile app KPIs and act on the insights and acquisitions you receive from them.
Mobile app metrics are crucial for any application. They tell you how well your application performs from a technical standpoint, how engaged your users are, and how much money active users bring to your business. Apart from that, you should look into App Store optimization and Google Play Store efforts.
The most important KPI for application performance includes load time, crash reports, and device information, including screen resolution and operating systems. These metrics allow you to control your app’s technical performance and improve the testing process. Identifying the devices your app runs on will give you a better understanding of your target audience and their sessions.
User engagement metrics influence revenue. They’re by far the most important mobile app KPIs. Learn how long people spend on your app and how many screens they visit before churning or completing a target action (like making a purchase).
To keep track of these application KPIs, you’ll need to integrate analytics into your mobile app. Mobile analytics tools come in all shapes and sizes. Do the research to select the right tool for your needs. A comprehensive analytics tool will include demographics, crash reports, heatmaps, and session recordings to give you a comprehensive understanding of how users interact with your app.