There are more than 2.5M mobile applications in Google Play. iPhone users choose from a variety of 4.7M apps in the App Store. Because the mobile app market is so saturated, it’s hard to stand out with your native mobile app for Android and/or iOS. What can you do to ensure the success of your app?
Offer a good mobile user experience (UX). Make the app easy to use, so people feel in control while using it. Design the app in a way that lets people complete a desired action. But, how to verify whether users are happy with the app or not?
The best way to check whether your app satisfies people or not is to analyze in-app user behavior. But if you don’t want to dive into numbers straightaway, mobile app heatmaps are a good starting point.
These are the topics the article covers:
- What are mobile app heatmaps (heat maps)?
- The 5 benefits of mobile app heatmaps
- 5 hands-on examples of using heatmap analytics to improve your mobile app
- Advance your analysis: Combine heatmaps with session recordings, events, and funnels
- Complement your mobile app heatmaps with the right analytics tools
Read the whole article or go straight to the most interesting section for you.
What are mobile app heatmaps (heat maps)?
Mobile app heatmaps are also called touch heatmaps. They are visual representations of numerical data in an app. The color overlay shows how each element of your mobile app engages users. Heatmaps in mobile analytics are the first overview of in-app user behavior.
How to read a mobile heatmap? Hot (the most engaging) spots are red and cold (the least engaging) elements are blue. There is also a range of colors between red and blue to show average user engagement.
Based on the mobile heatmap analytics, you’ll see if people use your app in the way you intended them to. You’ll spot what attracts attention and which areas might need improvement. Also, behavioral analytics tools like Smartlook let you mark a specific area to see the aggregated number of taps.
The 5 benefits of mobile app heatmaps
Heatmaps for mobile can help you answer questions related to the intuitiveness of your user interface (UI) or the number of button taps. They can also pinpoint areas of your app that might be confusing for users.
Thanks to mobile app heatmaps, you can:
- Get a quick visual overview of your app, so you don’t need to dive into numerical data straightaway
- Check if users engage with call to actions (CTAs) and non-interactive elements
- Support your hypothesis testing if you plan to redesign your app
- Come up with ideas to declutter your mobile app user interface (UI)
- Generate new ideas about ways to improve your conversion/sign-up form
Let’s see how you can use those benefits in a practical way.
5 hands-on examples of using heatmap analytics to improve your mobile app
We have 5 practical use cases from different industries for you. You’ll see that no matter your industry, heatmaps can always help improve your mobile app.
The way you’ll use mobile app heatmaps will depend on your company’s goals. But you’ll find below use cases adjustable to your specific needs. Read on and discover what problem you can address with heatmap analytics for mobile.
1. Use mobile app heatmaps for a general overview
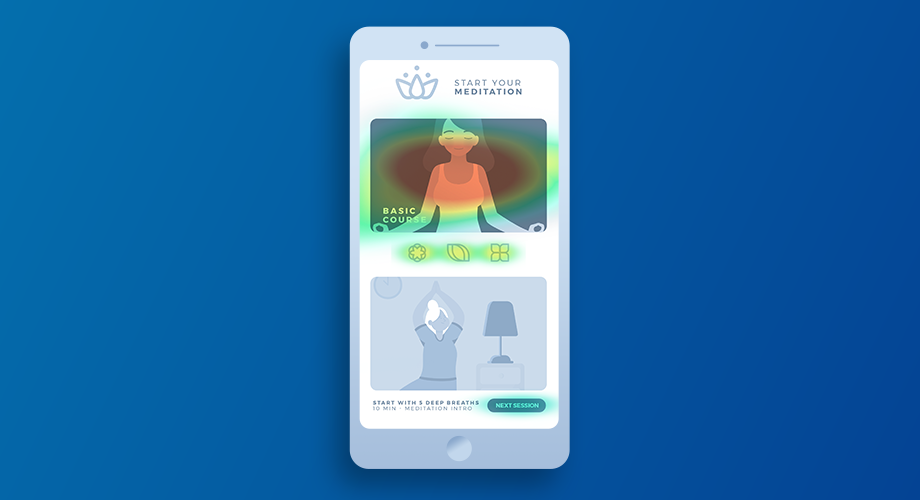
If you’ve a lot of numerical data, but you want to get a big picture first, mobile app heatmaps are a good start. Thanks to its visual format, you’ll see at a glance which elements are engaging and which are skipped by users.

Based on the mobile app heat map above, you see that users engage with the top CTA “Sign up for free” button. The “Play” button at the bottom isn’t engaging for users. And the company’s headline attracts average user interest.
Based on the heatmap, you can make improvements to your mobile home screen. You can either:
- Think about making the “Play” button more prominent and placing it higher on the screen
- Remove the “Play” icon and video and implement something else there. For example, a short description of your company’s hosting service.
At the same time, the high engagement with the “Sign up for free” button is a good thing for you. It means users want to try your services, so you shouldn’t plan any radical changes to your home screen design.
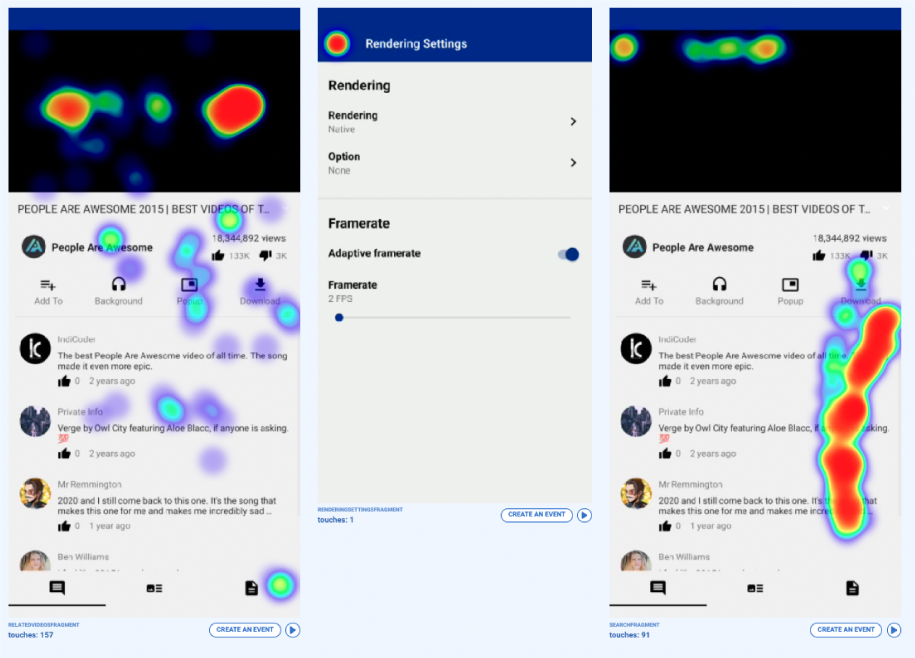
2. Use mobile heatmap analytics to check the engagement with UI elements
Buttons and links help users navigate through your app. But if the call to actions (CTAs) aren’t prominent enough, users can miss them. And if users tap or swipe non-interactive elements, they face unresponsive gestures that may confuse them.
To make sure your app design is explicit, check the engagement of all buttons and non-interactive elements. A mobile app heatmap will show you what attracts users and where they tap.
Based on the mobile app heatmap above, you see the top banner engages users. Also, they tap the 3 icons below. It seems users want to start the “Basic course” by tapping the banner or icons, but those elements aren’t interactive. At the same time, the button “Next session” at the bottom gets very few taps, meaning users might miss it.
You can improve the confusing UI of your mobile app by:
- Making the top banner and 3 icons interactive. Make it clear for users where they’ll land after they tap on it
- Making the bottom banner similar to the top banner and enlarging the “Next session” button so people see it
Either way, make sure that the UI serves its purpose, so users access the meditation courses they want.
3. Use heatmap mobile analytics to test a hypothesis about UI redesign
Mobile heatmaps are a good starting point when you plan to redesign a part of your app. They will support you in hypothesis testing and verify how users engage with your app.
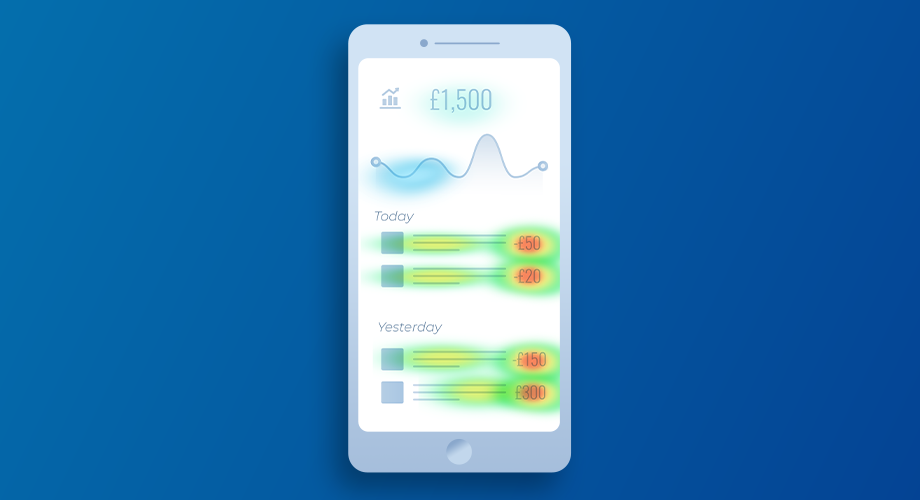
For example, you develop a banking app where users can:
- Access their account balance
- Slide chart to see money spent over time
- View how much they’ve spent, when, and with what merchant
Let’s say your team had a hypothesis: “Users interact a lot with the chart. It’s an important element of the app, and we need to improve it.”
The mobile app heatmap above can support you in verifying if the hypothesis is true or not. As you see, the chart is almost untouched by any users while they interact with the bottom part of this screen.
This can signal to you that the chart doesn’t need changes, and you can use your developers’ time to fix a more serious bug or app issue. But if you’d like to explore the chart topic further, be sure to add more context to the mobile app heatmap. Use other analytics tools to be sure you make decisions backed by data.
4. Use mobile app heatmaps to help with UI decluttering
Mobile screens have limited space, so you’ve to make the UI simple and easy to navigate. Too many fields and too small buttons are prone to erroneous taps. Users might feel lost and unable to complete the desired task fast.
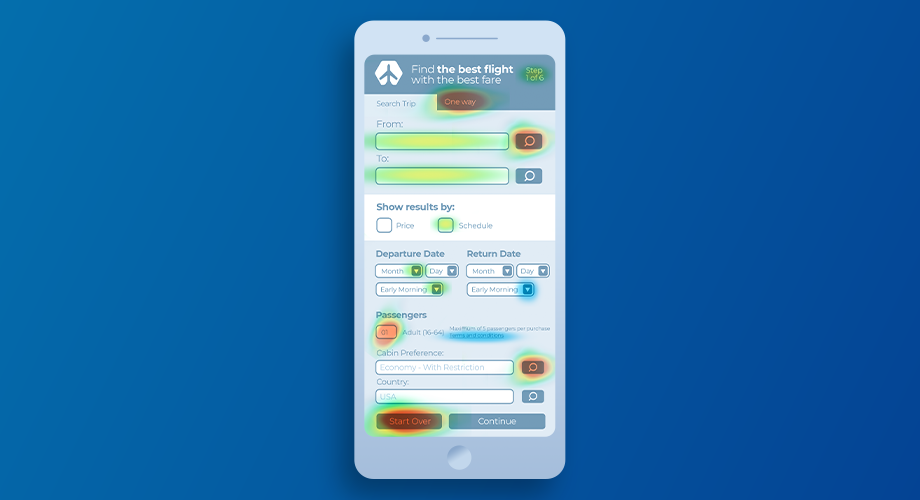
For example, the app for a flight search engine above has a lot of fields to complete, and the buttons are small. The UI might feel heavy for users. Analyze the heatmap, and you’ll see that the heat spots don’t make sense. This is a clue that something with the UI might be wrong.
With this mobile app heatmap, you can assume that:
- There are unnecessary fields that make it hard for users to complete a search
- The longer the search form, the fewer users will reach the end
- The “Continue” button at the right bottom isn’t prominent enough
Explore the UI issues with other analytics tools to justify the redesign. Remember that significant UI changes affect users. So make sure you back your redesign decisions with hard data.
5. Use heatmap analytics to improve your form conversion rates
Most mobile apps have their unique goals – fill in a form, create a playlist, make a payment, or start a new course. No matter if you’re a for- or non-profit organization, you’ve mobile app-specific goals, too.
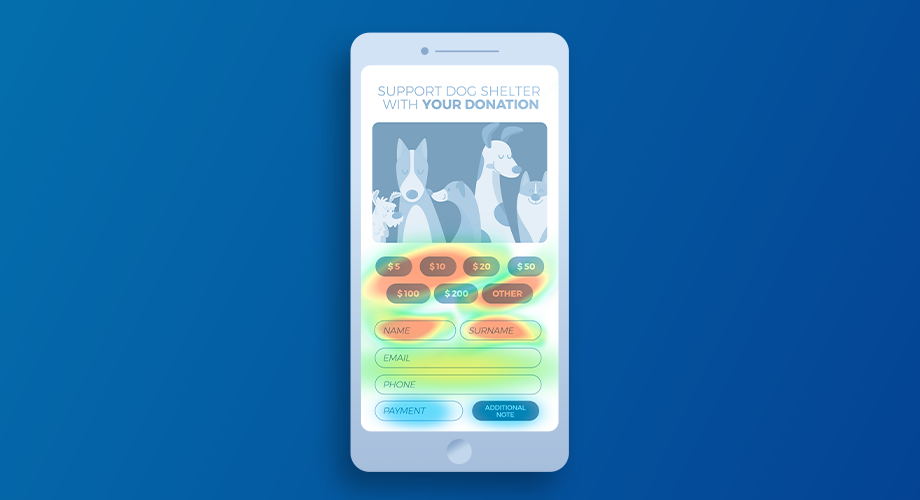
For example, you’re a non-profit organization that supports dogs. With a heatmap for mobile apps, you can check how your users engage with the money donation form.
Above, you see that a lot of users engage with money tiles, and name fields. But the engagement decreases when users have to type an email, phone, and set a payment method. This might indicate that users are reluctant to give you their personal data.
To increase conversions of your form, experiment with your form redesigns and:
- Make the form shorter and remove the email or phone number field
- Justify why you need personal data from your users
- Make some fields optional
Before you implement changes, be sure to explore data by watching session recordings of how users navigate this form. Using more analytics tools will give you a true overview of what’s the real issue.
Advance your analysis: Combine mobile app heatmaps with session recordings, events, and funnels
Despite mobile heatmaps being great for the start of your analytics journey, they’re limited.
The 3 heatmap limitations are:
- The insights tend to be obvious and sometimes not that actionable
- They only show aggregate trends about a single screen of your mobile app
- Many heat mapping tools can’t handle dynamic content
To move past those limitations, combine heatmaps with session recordings, events, and funnels. See how to use heatmaps with those analytics tools below.
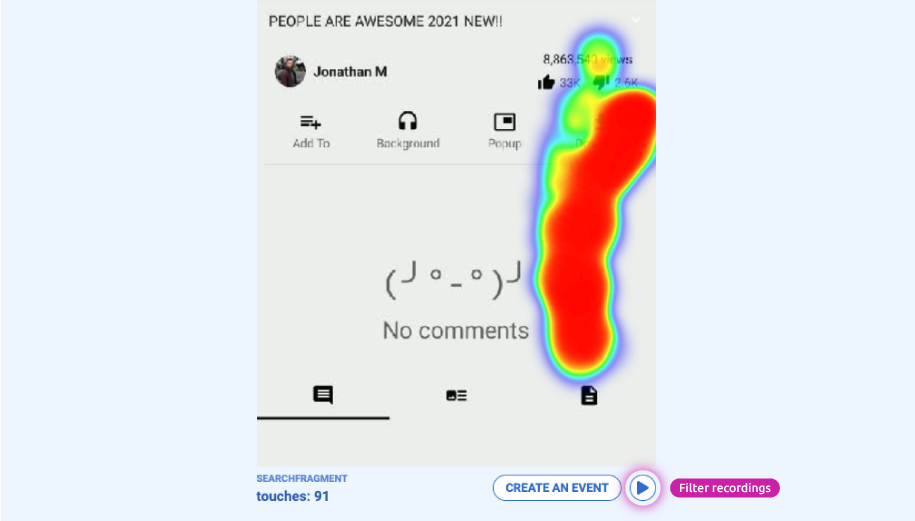
Pair mobile app heatmaps with session recordings
Mobile heatmaps are way more powerful when combined with real-time session recordings.
You can pair them in 2 easy ways:
- Go to a public demo or create a free account.
Press the “Heatmaps” section and choose a heatmap gallery. If one mobile heatmap screen gets your interest, watch session recordings of it. To do so, press the “Play” icon under that particular heatmap. You’ll see recordings of the users who interacted with that particular screen.
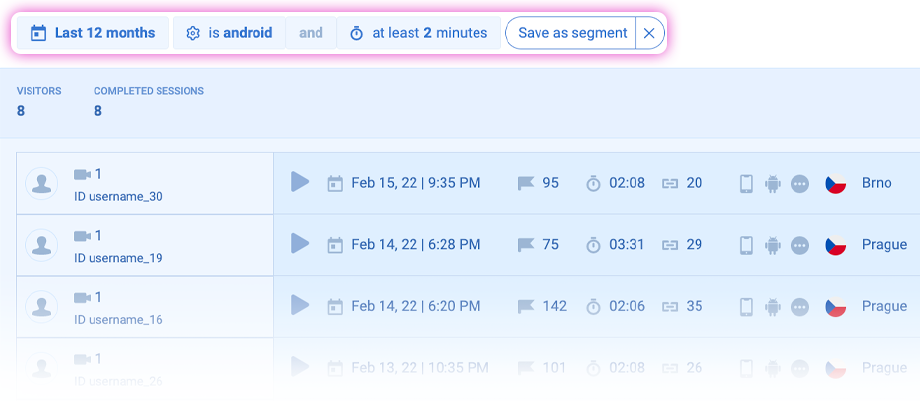
- Go to the “Recordings” section and watch all recordings or filter them by duration, location, technology, and more.
Filtered session replays let you see user actions that interest you the most. For example, Android users reported that they can’t submit an order form. To get actionable insights filter recordings by Android OS, specific duration, and screen with the form. You’ll learn what’s wrong in minutes.
Pair mobile heatmaps with events
Similarly to recordings, you can pair a mobile app heatmap with events in 2 ways.
- Create an event based on a mobile app heatmap.
If a screen in a heatmap gallery catches your attention, make an event out of it. Press the “Create an event” button under the specific heatmap, and you’ll create a new event, which is a visit to that specific screen.
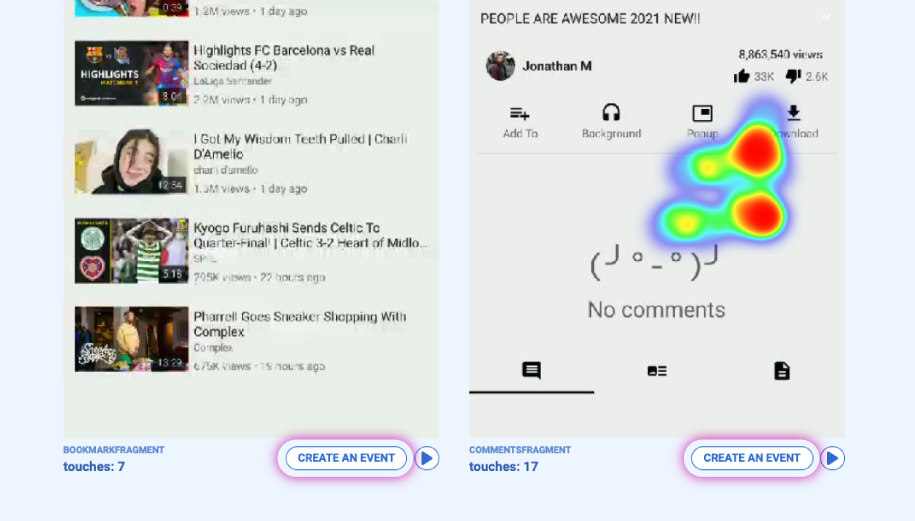
- Go to “Events” and press the orange “Create a new event” button at the top.
Choose if you want to create a new event based on a visited screen, tapped element, or another more advanced option.
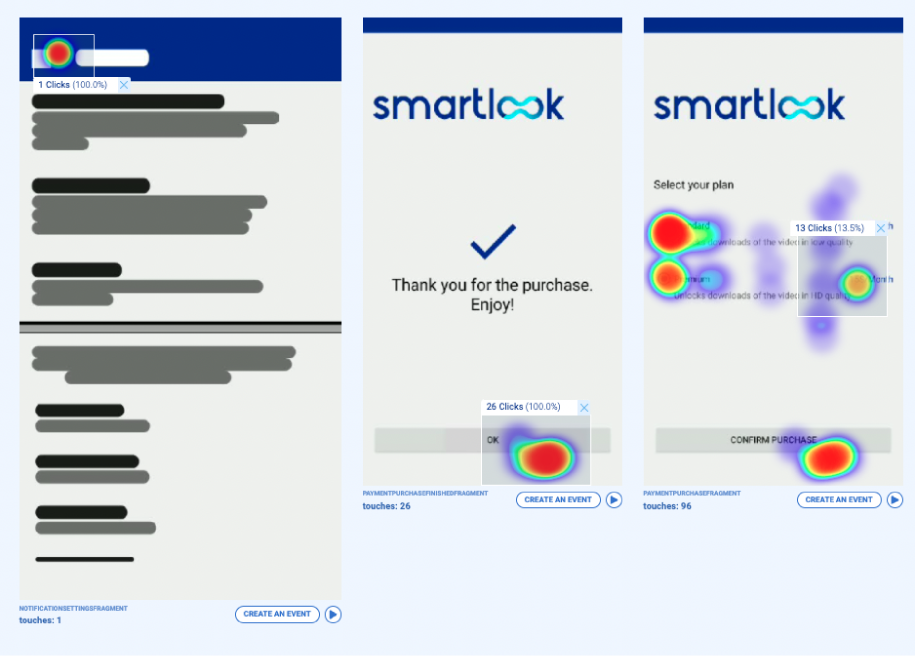
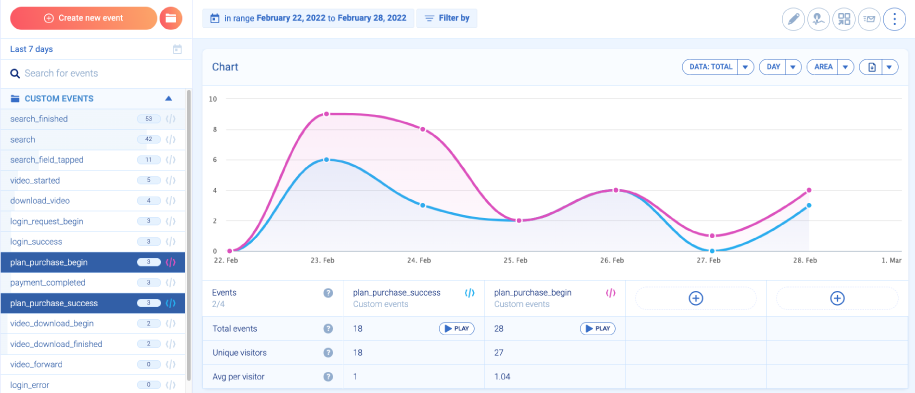
For example, you want to compare 2 events:
- Plan_purchase_begin – users who started the purchase
- Plan_purchase_success – users who completed the purchase
Compare them by pressing Ctrl/Command and choose those events from the action sidebar.
Below, you see that not all the users who started the plan purchase finished this process. To explore this case, press the “Play” button to watch session recordings of those who performed each event.
Pair mobile heatmaps with funnels
Create event-based funnels that are a powerful addition to your mobile app heatmaps. Heatmaps show you only a single app screen. Funnels give you more context, so you see what users did before getting to this screen and what happened next.
For example, create a funnel based on 2 events in a sequence: Login_request_begin and Login_success. Next, check how many people completed it.
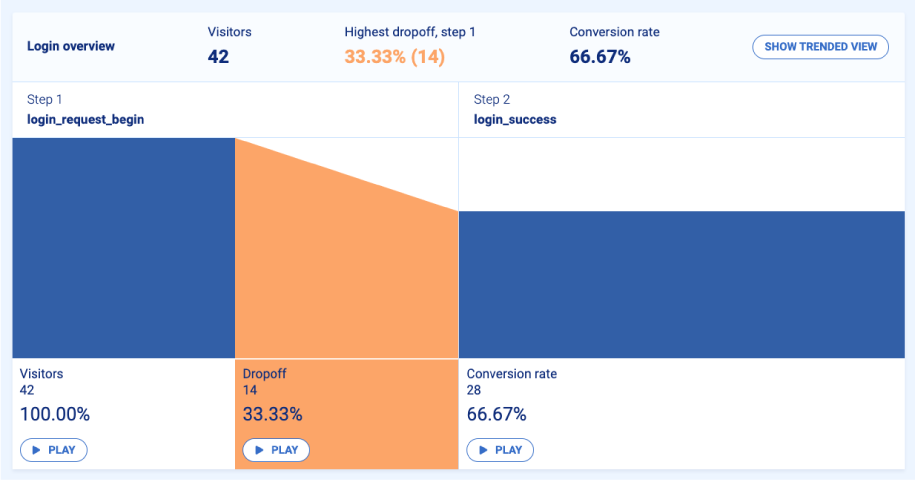
As you see, not all users log in successfully. Out of 45 users who tapped the “Login” button, 14 users didn’t reach the post-login area. You wouldn’t get this information if you only looked at the mobile app heatmap.
To explore what took those 14 users away from getting to the post-login area, press the “Play” button at the bottom of the funnel.
Now you understand how powerful mobile app heatmaps can be when combined with recordings, events, and funnels. Thanks to advanced analytics, you’ll see all in-app user behavior patterns. If you want to learn more about how to improve your mobile app UX, read our article.
Complement your mobile heatmaps with the right app analytics tools
Mobile app heatmaps give you a good overview of your mobile app. But be sure to take them with a pinch of salt because, often, they lack a wider context. Before you make any decision, dive deeper into the data and see different perspectives.
Also, collect user feedback and combine it with analytics data. This will help you optimize your mobile app usability and UX. By constantly optimizing your app, you’ll stand out in the competitive mobile landscape.
Check Smartlook’s pricing plans and sign up for a 30-day trial.