While Amplitude and Mixpanel are two of the most popular product analytics platforms, there are important differences between them that affect the kind of insights you can get.
In this article, we’ll explore these differences in detail and explain how they can affect your day-to-day workflow, as well as how much effort it takes to utilize each platform correctly.
We’ll also discuss situations when Smartlook — our combined product analytics and session recording platform — can be a great addition or alternative to Mixpanel and Amplitude.
In short, throughout this article, we’ll compare Amplitude, Mixpanel, and Smartlook, with a focus on:
- Their workflows and unique capabilities
- Their overlapping reports and features
- Their setup and data collection mechanism
- Their pricing structure
Before we dive in, here’s a quick rundown of the essential differences between the three platforms:
Unique features and capabilities
- Amplitude is focused entirely on quantitative analytics (i.e., stats and metrics). As an advanced solution, Amplitude has unmatched advanced charts and reports for analyzing quantitative data, provided you have the engineering time and data analytics know-how to use the platform.
- Like Amplitude, Mixpanel is also primarily a quantitative analytics platform. While it doesn’t have as many advanced reports as Amplitude, Mixpanel comes with a unique data enrichment functionality and supports a wide range of third-party integrations.
- Smartlook combines the power of quantitative analytics with qualitative data (gathered via session recordings). As a result, you can see what your users are doing and more importantly — understand why they’re doing it with the help of session recordings, which Amplitude and Mixpanel don’t offer.
Setup and data collection mechanism
- Amplitude and Mixpanel require you to define the events you want to monitor ahead of time and manually set up tracking for each one. This process is difficult and time-consuming and requires a lot of developer assistance. Between the planning, implementation, and data collection, it can take months before you have product usage data to analyze.
- Smartlook automatically captures every user interaction in your product with a single code snippet and lets you track events without coding. Thanks to this simple setup, you get insights much faster, since you don’t need to spend months creating tracking plans and implementing Smartlook.
Pricing
- All three platforms have a free plan and free public demo.
- Amplitude is by far the most expensive platform of all three. The lowest price that users report online is $5,000/year paid annually with a 20% discount. Amplitude also doesn’t have transparent pricing, since you have to contact their sales team to get a quote.
- Mixpanel and Smartlook both offer transparent and cost-effective plans, as well as an option to build custom ones. This makes Mixpanel and Smartlook suitable for all kinds of businesses, including startups and mid-sized companies, unlike Amplitude, which is mostly enterprise-oriented.
Smartlook is the only combined product analytics and visual user insights platform that won’t take your team forever to set up. Start analyzing and improving your users’ experience with Smartlook’s full-featured, 30-day trial — no credit card required.
Amplitude vs Mixpanel vs Smartlook: Each tool’s workflow and unique capabilities
Amplitude, Mixpanel, and Smartlook all help analyze user behavior, but they do so in dramatically different ways.
For starters, they collect different types of user behavior data:
- Amplitude and Mixpanel are focused primarily on quantitative analytics. Their features are geared towards analyzing stats and metrics about your users’ behavior and visualizing them in reports, charts, and dashboards.
- Smartlook allows you to perform both quantitative and qualitative analysis. Smartlook’s unique mix of quantitative (events and funnels) and qualitative analytics features (session recordings) means you can go beyond the raw numbers and uncover why users are doing what they’re doing.
With that in mind, let’s explore each tool’s unique workflow and capabilities.
Amplitude
Amplitude is one of the most comprehensive analytics solutions on the market. It lets you do all kinds of event-based analysis and build custom dashboards that are relevant to your business.
The Amplitude platform is comprised of a few different products:
- Amplitude Analytics: Used for analyzing customer behavior in real-time and finding actionable insights.
- Amplitude Experiment: Used for creating targeted experiments and measuring their results.
- Amplitude Recommend: Used by product and marketing teams to build audience lists and automate campaign targeting.
- Amplitude CDP: Helps with data governance by allowing data teams to bring in user data from across their technology stack and create a consistent taxonomy.
While these are part of the same platform, they’re also sold as separate products.
Amplitude’s workflow
Before you can start using Amplitude, you have to go through an extensive planning, implementation, and testing process to ensure you’re sending the correct events and properties to the platform. This is a highly-technical task that should be handled by a developer, based on Amplitude’s instructions.
Once Amplitude is set up and has collected enough data, you can start utilizing it. The platform is organized into reports, which you can fill with different charts.
For example, the screenshot below shows an Amplitude dashboard (which is a type of report) for tracking business KPIs like daily revenue and year-over-year growth.

These reports are not created by default. You have to customize each dashboard and chart upfront, meaning you’ll likely spend more time on your workspace’s initial setup than with Mixpanel or Smartlook.
You have four options for customizing your workspace:
1. Analysis: This option lets you create a new chart, like a funnel chart, data table, engagement matrix, retention chart, and more.

2. Cohort: This option lets you group users based on their behavior patterns, e.g., power users or users who successfully made an in-app purchase. Cohorts can be used in analysis to compare groups of users against each other.

3. Report: This option lets you create dashboards or notebooks for summarizing findings. For example, you can create a dashboard filled with funnel charts that monitor the conversion rates for your most important user flows (onboarding, checkout, etc.)
4. Space: This option lets you organize relevant charts and reports, so you can share them with colleagues.
Amplitude’s unique capabilities: Advanced reports and additional ways to visualize data
Amplitude has some of the most advanced features for analyzing and visualizing quantitative data.
For example, here are two types of analyses that only Amplitude offers:
1. Personas Charts: These charts group users into clusters based on the similarities of their event behavior, as shown in the screenshot below. They’re helpful for exploratory data mining analyses of how users navigate a product, which can surface unexpected similarities between user cohorts.

2. Impact Chart: With impact charts, you can determine if users who interacted with a new feature are taking certain actions more frequently (e.g., making an in-app purchase), relative to the time before they first used the new feature.

For more details on all of Amplitude’s charts, refer to their documentation.
Mixpanel
Mixpanel is a product analytics platform comprised of three solutions:
- Convert: This includes features for analyzing the user journey leading up to a conversion, like funnel reports and behavior flows.
- Engage: This includes features for analyzing product usage, such as lifecycle analysis and user segmentation.
- Retain: This includes features for understanding and improving retention, like cohort analysis and re-engagement via personalized campaigns.
While Mixpanel is primarily focused on quantitative data, it can be integrated with Smartlookto use session recordings to go beyond the raw numbers and understand why users do what they do.
Mixpanel’s workflow
Similar to Amplitude, Mixpanel requires manual instrumentation. You start by deciding which events to track, implementing the tracking, and waiting for data to roll in. Again, the implementation process should be handled by a developer familiar with Mixpanel’s documentation.
Unlike Amplitude, Mixpanel starts you off with a few pre-made reports out of the box, so you likely won’t have to spend as much time customizing the platform right away.
In Mixpanel, data is organized into dashboards, like the “Core Company KPIs” dashboard below.

While this is subjective, some online reviews mention that Mixpanel’s UI and data visualizations are more easily digestible than Amplitude’s.
When creating new dashboards, you get to choose what type of reports get added to them. Mixpanel offers four report types:
1. Insights Report: For analyzing events, cohorts, and user profiles and displaying the data in various chart types (line, bar, pie, etc). For example, the screenshot below shows an Insights report that displays new user accounts as a line chart.

2. Funnels Report: For analyzing how users go through a series of events and where they drop off. The screenshot below shows a four-step funnel report with a 30-day timeframe.

3. Retention Report: For analyzing user engagement over a period of time.
4. Flows Report: For identifying the most frequently taken paths to or from any event.
For even more details on how to create and customize these reports, refer to Mixpanel’s documentation.
Mixpanel’s unique capabilities: Data enrichment and extensive integrations
Mixpanel has a unique data enrichment feature that lets you join historical events with new business data (i.e., retroactive enrichment). This can be very useful if you forget to track something and later need additional data for your analysis.
For example, say you track in-app purchases within Mixpanel (with a ProductID property), but forgot to add Price and Category as additional properties. You can easily enrich the data you’ve been collecting by uploading a table with the ID, Price, and Category. This lets you analyze in-app purchases by all of these properties, without having to start your event instrumentation all over.
Check out Mixpanel’s documentation on Lookup tables to learn more.
Also, Mixpanel’s team has built tons of integrations with A/B testing and experimentation platforms (like VWO and AB Tasty), marketing and messaging automation solutions (like CleverTap and Taplytics), CRMs (like Salesforce and HubSpot), and other popular tools.
This was done to compensate for the retirement of Mixpanel’s built-in testing and messaging features (push notifications, in-app messages, etc.) and allows the platform to support several use cases.
While Amplitude also integrates with some of these tools, Mixpanel has an edge with its 90+ integrations.
Smartlook
Smartlook is our combined product analytics and visual user insights platform that brings together four key tools:
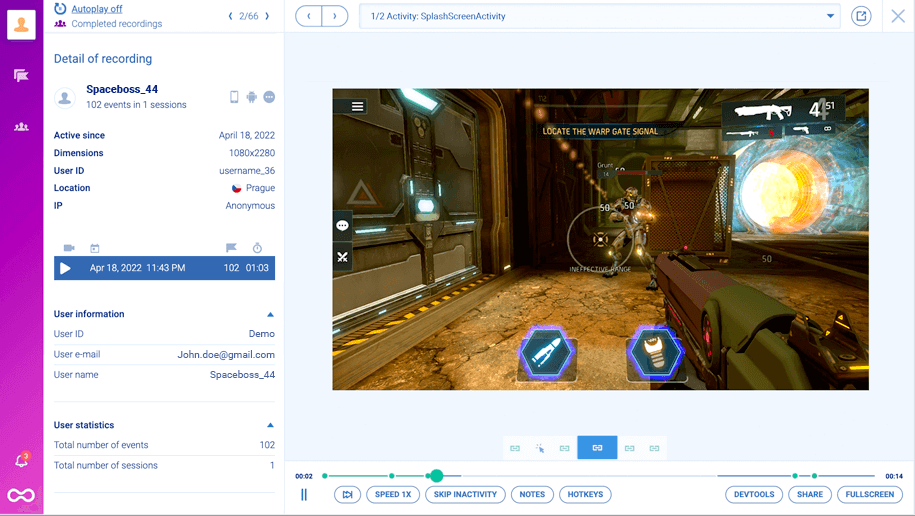
1. Session recordings: This shows you exactly how your users experience your product, from the moment they open it to the moment they close it (as you can see in the screenshot below.) Session recordings can help you understand why users do what they do, fix bugs faster, make product insights easily accessible to everyone, and more.
2. Events: Similar to Amplitude and Mixpanel, Smartlook tracks specific user interactions as events. The difference is that Smartlook tracks user interactions with a single code snippet and lets you track events without coding, which you can’t do with Mixpanel or Amplitude.
3. Funnels: Funnels help you analyze your most important user flows.Again, this is similar to the funnel reports in Amplitude and Mixpanel. However, since Smartlook offers session recordings, you can quickly find and watch the session replays of users who dropped off at a specific stage, so you can see what’s hurting your conversions.
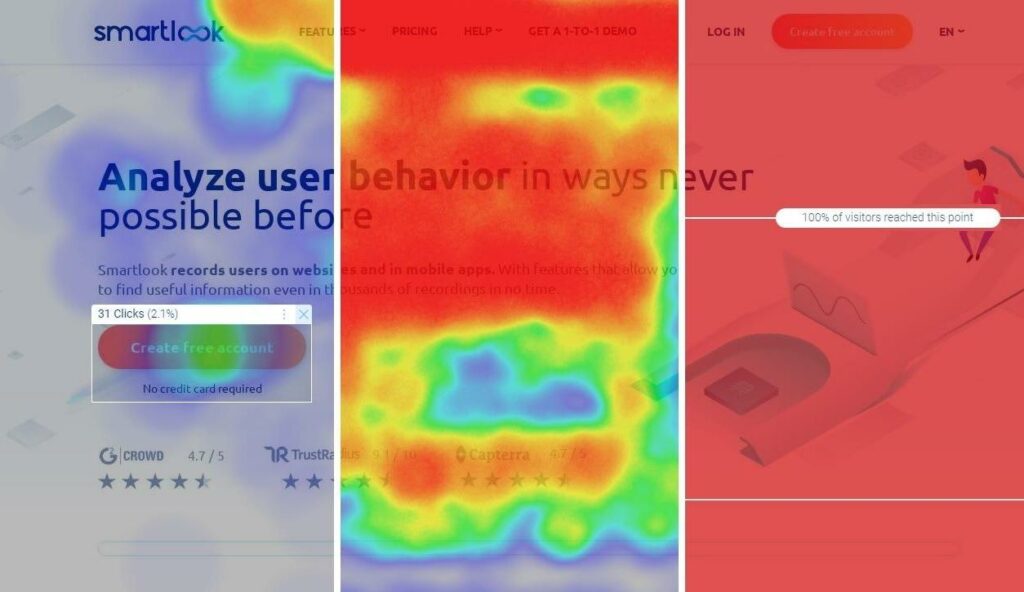
4. Heatmaps: Heatmaps show you an overview of a typical user’s behavior on a page or screen. Smartlook supports three types of heatmaps — click maps (left in the screenshot below), move maps (middle), and scroll maps (right). Like our session recording feature, heatmaps are also something you can’t get in Amplitude and Mixpanel.
We have detailed articles on how to use these features, so if you’re interested, check out:
- Our guide on tracking user activity on websites
- Our guide on setting up mobile app tracking to analyze user behavior
Smartlook’s workflow
Unlike Mixpanel and Amplitude, Smartlook doesn’t require extensive planning and implementation.
Instead, our platform automatically captures every user interaction in your product with a single code snippet.
Once Smartlook’s been set up, you can open the dashboard and choose what information you want to see there by adding and removing tiles. For example, the screenshot below shows a dashboard with tiles that report on the conversion rate for a funnel, the top user devices, most visited pages, and more.

Say you’re working on a SaaS product and want to track your daily, weekly, and monthly active users. You can click on “Add new tile”, go to “Active Users”, choose the interval, and select the data range you want to analyze (seven, 30, or 60 days).

Click “Save” and the newly created tile will appear in your dashboard. That way, you can easily keep track of your daily, weekly, or monthly active users when you open Smartlook.
Smartlook’s unique capabilities: Simple setup, session recordings, and the ability to combine quantitative and qualitative data
Smartlook’s simple setup ensures you get product insights much faster because you don’t have to spend months on planning, tracking implementation, and data collection.
Instead, you start analyzing user behavior with session recordings, events, funnels, and heatmaps only minutes after setting up Smartlook.
Additionally, our session recordings:
- Capture every user session in your product automatically.
- Allow you to actually see how individual users interact with your product.
- Make product insights available to everyone, not just the few people who have the analytics skills to work with quantitative data.
Smartlook lets you combine the power of quantitative data (events and funnels) with qualitative data (session recordings).
For example, every event in Smartlook can be traced back to a session recording by clicking the small “Play” button under its name. This means you can see everything a user did before or after triggering that event.
You can also watch session recordings of users who dropped off at a specific stage in a funnel to find out what’s hurting your conversions. For example, the screenshot below shows a funnel that maps tutorial completions, with an overall conversion rate of 71.43%.
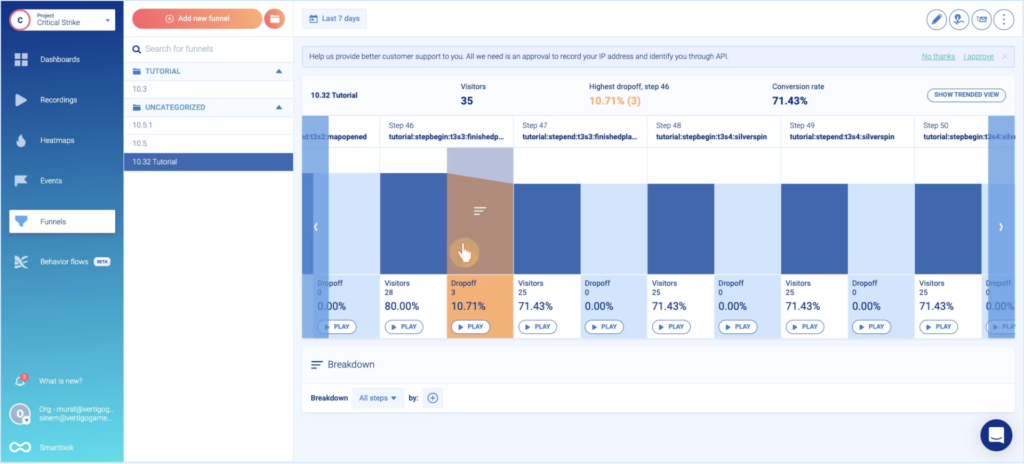
There’s a “Play” button under each step of the funnel, including the drop-off stages, which takes you directly to the session replays of users dropping off at that stage. This lets you:
- Find out why users drop off by watching them interact with your product.
- Save time and effort because you watch only the sessions of users who didn’t complete that step in the funnel, instead of going through all other sessions.
Amplitude vs Mixpanel vs Smartlook: Overlapping reports and features
All three platforms can be used to analyze user behavior on web and mobile apps and they also support a wide range of SDKs for popular platforms and technologies, like iOS, Android, React Native, Flutter, Unity, and more.
Here are three types of analyses you can do with Amplitude, Mixpanel, or Smartlook:
1. Segmentation
Segmentation is the process of grouping users together based on common properties, like their device, country, or actions (events) they’ve performed.
Amplitude allows you to create Segmentation charts by selecting events and user properties.

Mixpanel doesn’t have a separate report for segmentation, but it does let you break down the other reports based on properties. For example, the screenshot below shows an Insights report for monitoring newly created accounts, broken down by device and platform.

In Smartlook, you can do something similar by breaking down each event by the location of the user, their device, operating system, plus a variety of custom event properties (e.g., registered or unregistered users, type of subscription, product availability).
Just open the event you want to break down, click on “Set breakdown” and select your criteria:
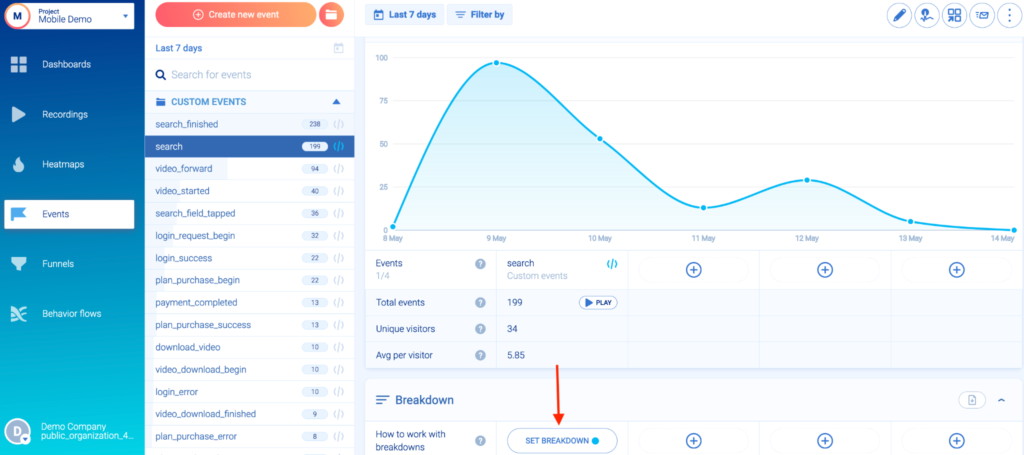
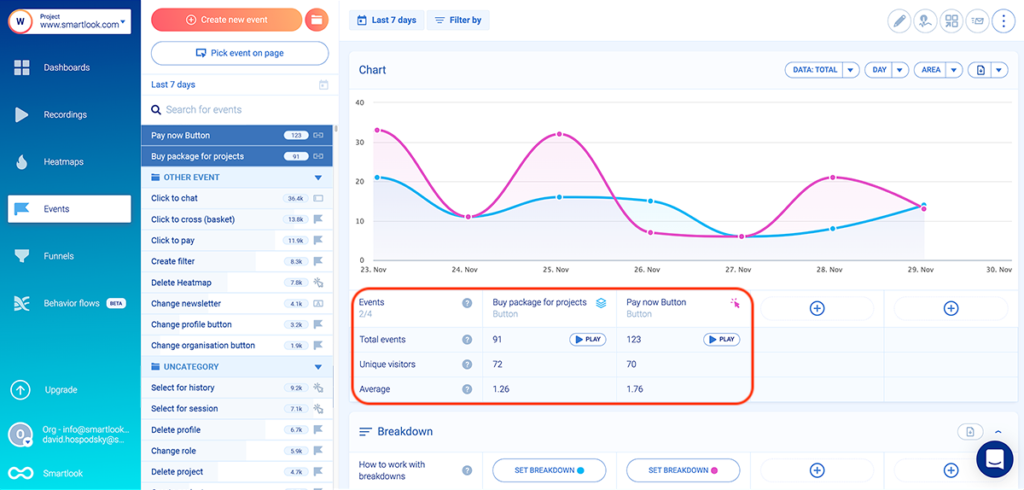
Then, a breakdown table like the one below will appear under the event.
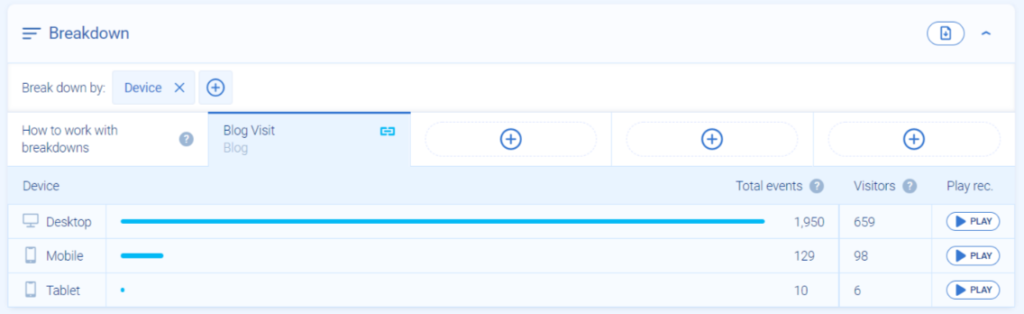
You can save any combination of events and properties as a user segment (e.g., first-time visitors on Android devices who made an in-app purchase). Then, you can monitor how this segment performs right in your dashboard.
And since Smartlook also offers session replay, you can click on the “Play” button next to any segment to watch how users from it interact with your product.
2. Funnel analysis
Funnels are sequences of steps users take to achieve a goal, like making an in-app purchase, trying out a new feature, or completing a game level.
Building funnels lets you analyze user behavior through these key flows, find out where users drop off, and calculate conversion rates.
Amplitude has funnel charts, while Mixpanel offers a funnel report (which we also showed earlier) as one of its four key reports:
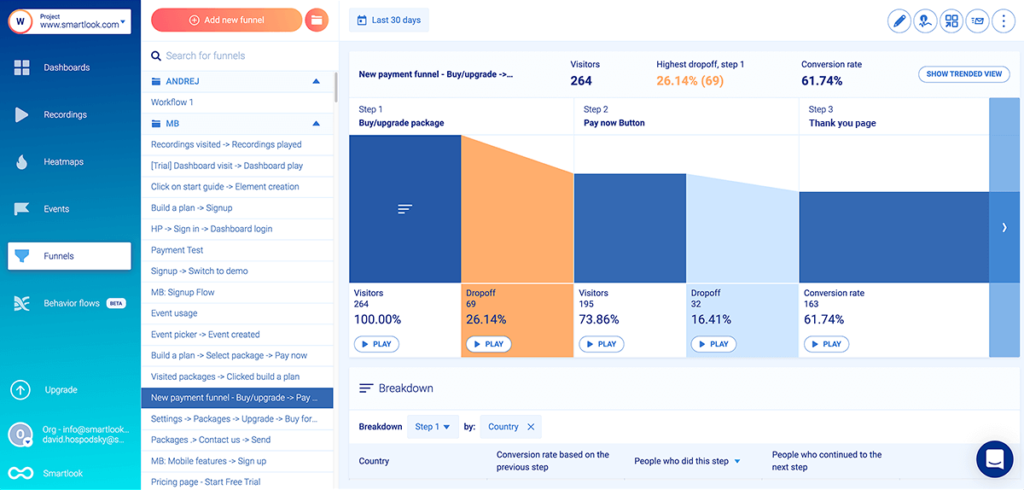
In Smartlook, you can create a funnel by placing two or more events in the order you believe your users follow. For example, the screenshot below displays a 3-step funnel that maps a purchase flow.
You can see the overall conversion rate (61.74%), as well as the conversion rates and drop-offs between each step. Again, with Smartlook, you can jump into the session recordings of users who dropped off at a certain stage, which can help you find and eliminate friction points that reduce your conversions.
This is a massive benefit over Amplitude and Mixpanel since they can’t show you how users experience your product. As a result, their funnels let you see where users drop off, but finding out why often requires weeks or months of testing hypotheses.
3. Retention analysis
Retention analysis refers to the process of tracking what percentage of visitors that perform an action (e.g., log into their account or make an in-app purchase) continue to do so over the next days, weeks, or months.
Similar to funnel analysis, Amplitude lets you build Retention charts (shown in the screenshot below), while Mixpanel has Retention reports.

Smartlook also has a special feature called Retention Tables, which lets you track user cohorts over time while calculating retention for you. You can easily generate a retention table like the one shown below for any event.
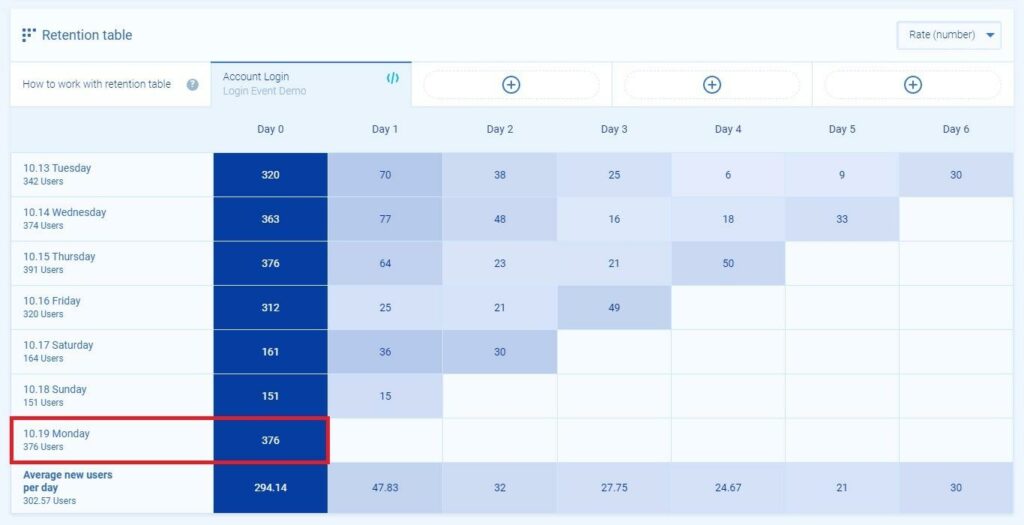
As you can see in the screenshot, the retention table shows that 376 users triggered the “Account Login” event for the first time on Monday, 10.19, which is our Day 0.
Over the next few days, the table automatically tracks this user cohort (users who first performed the “Account Login” action on 10.19).
Here’s the retention data for the next 5 days:
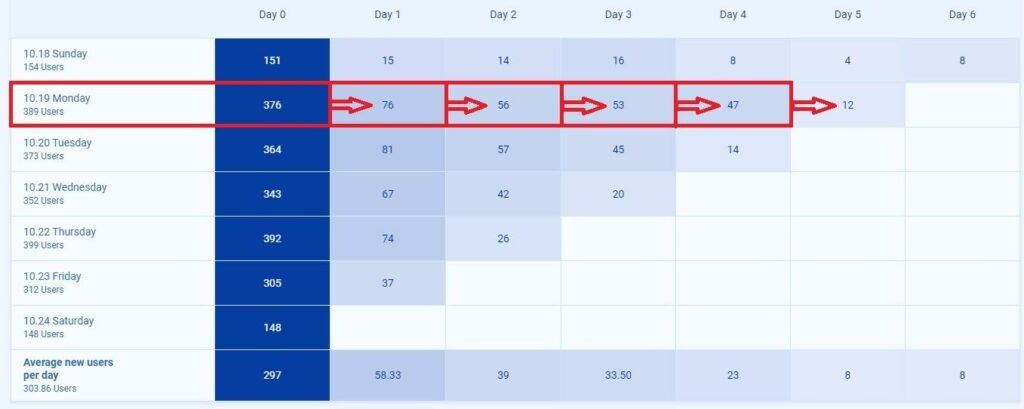
As you can see, on Day 1, 76 of the 376 users performed the action again. That number gets progressively lower, with a big drop between Days 4 and 5.
Amplitude vs Mixpanel vs Smartlook: Setup and data collection mechanism
The process of collecting user behavior data with each tool is different, which has massive consequences for your workflow.
Amplitude and Mixpanel take the traditional approach to product analytics and require manual instrumentation. This means that before you get any product insights, you need to:
- Plan what events you want to track.
- Have your engineering team implement the tracking.
- Go through a testing and QA phase to ensure you’re sending the correct events and properties to the platform.
- Wait for enough data to accumulate.
While manual instrumentation provides granular control over everything you collect, it comes at the expense of being difficult and time-consuming to implement.
Smartlook takes the opposite approach by collecting all user interactions inside your product with a single code snippet.
When talking to scaling product teams, we’ve found this automatic approach of collecting data with session recordings has three major benefits:
1. Less engineering hours to get started + faster time to insights
Both Amplitude and Mixpanel provide extensive documentation to guide you through implementation, and Mixpanel even has a setup course with over 3 hours of content.
But many positive reviews for Mixpanel and Amplitude still mention the lengthy setup or heavy reliance on the data analytics team as a downside, like this one:

Several Amplitude reviewers have a similar complaint:

In contrast, Smartlook only requires you to insert a single code snippet before it starts recording every user session in your product. As a result, you get the insights needed to build better products within hours or days of using Smartlook (rather than weeks or months).
2. Tracking events without coding, even retroactively
Mixpanel and Amplitude don’t collect user interaction data automatically. You have to tell them which events to track, so every time you want to track a new event, you need to go through the implementation process again.
This is a common problem with traditional analytics tools (like Google Analytics) since teams often don’t know everything they’ll want to track in advance.
Smartlook avoids this problem by automatically collecting user interaction data via always-on session recordings.
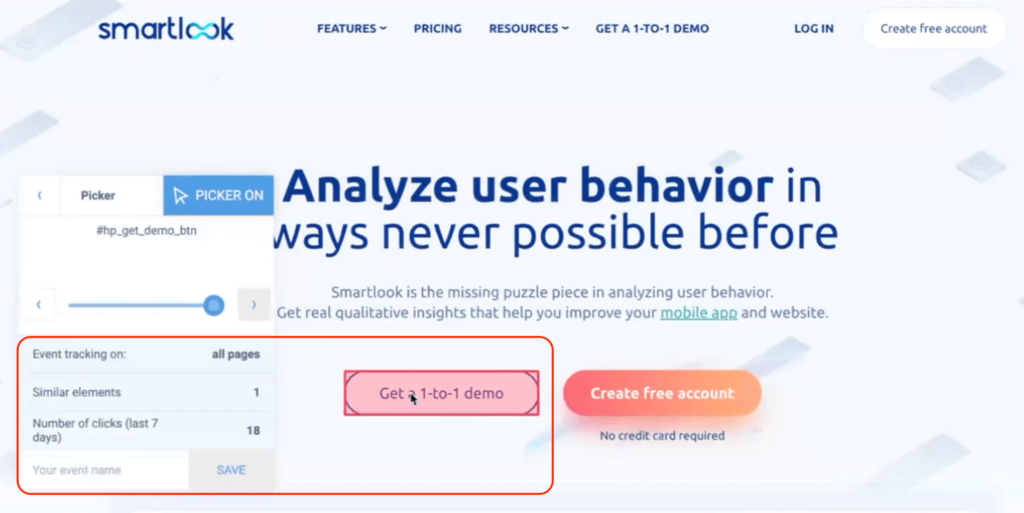
With Smartlook, the data has already been collected, so you just have to decide which interactions you want to analyze in the platform. That process is called defining an event. We offer a few ways to define events without coding, like selecting from a list of standard events and clicking on user interface (UI) elements, as shown in the screenshot below.
Once you define an event, Smartlook immediately identifies every instance of that event, going back to the moment you added the snippet or as far as your data retention plan goes.
As a result, the event tracking visualization appears instantly, like in the GIF below:
Madfinger Games, an award-winning game development studio, highlighted the ability to define events retroactively as one of the biggest benefits of working with Smartlook. As their CTO said:
“That’s the cool thing about Smartlook — we often have no idea what we’re going to need. And Smartlook captures everything for us. We can always set up an event later and start focusing on the problem when it pops up.”
Smartlook also lets you create custom events via JavaScript, so you can track pretty much anything you can imagine.
Additionally, Smartlook has a special feature called anomalies, which alerts you when a sharp surge or drop in the occurrence of an event happens.
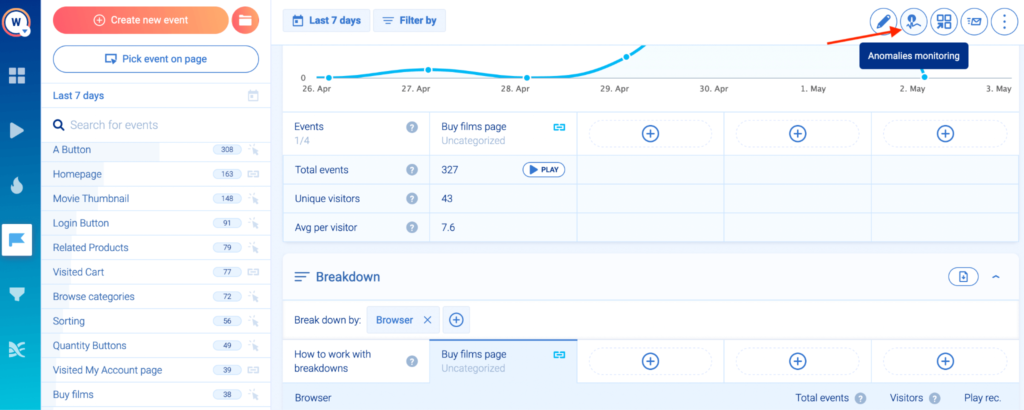
Once an anomaly is created, you’ll be notified via email in case of a sharp drop or surge. You can even set up notifications via webhook to deliver alerts in other applications (e.g., in a specific Slack channel.)
3. Getting everyone involved in the product analytics process
Amplitude and Mixpanel (as well as other traditional analytics tools) provide mostly quantitative data. While useful, these raw stats and metrics require more technical data analysis skills to interpret.
As a result, most organizations don’t benefit from the insights provided by Mixpanel and Amplitude because the learning curve for understanding their data is too steep.
This is a common problem for Amplitude users, as many reviewers report spending months learning how to utilize the platform:

Some Mixpanel reviewers also have similar complaints:

In contrast, Smartlook’s session recordings and no-code event tracking lower the barrier to entry. Here are a few examples of how different teams can take advantage of Smartlook in their daily workflows:
- Product teams can collect relevant product events with a single snippet, without needing constant engineering help. For example, they can use the no-code event picker to track clicks on a new feature as events. They can also use session recordings to show others exactly what’s going on with the product, which makes it much easier to communicate their findings and strategy.
- Customer support teams can use session recordings to quickly understand bugs reported by users. With Smartlook’s Identify API, you can locate users’ session recordings, based on an identifier like email or username. When an identified user reports a bug, support teams can see exactly what went wrong and resolve the problem themselves or send the recordings to the dev and QA teams.
- Dev and QA teams can watch session recordings to see the exact situations in which bugs occurred. This makes bug reproduction much easier. And developers can often skip reproduction altogether by reviewing the session recordings and the data sent in the background, which Smartlook provides.
- Marketing teams can track user actions and analyze the effectiveness of changes. For example, say your marketing team updates your checkout page’s copy with the goal of getting more people to complete your form. They can set up events to track text inputs into the form field and clicks on the CTA, allowing them to understand the impact of their changes.
Mixpanel vs Amplitude vs Smartlook: Pricing comparison
Pricing is another area where Amplitude, Mixpanel, and Smartlook have significant differences.
- Amplitude and Mixpanel have event-based pricing.
- In Amplitude’s case, you need an estimate of how many events you want to monitor in your product.
- For Mixpanel, you need the number of users who trigger at least one event in your product per month.
- Smartlook’s pricing is based on the number of sessions you want to record each month. You only need to know your monthly sessions and select (or build) a plan with a slightly higher number to account for traffic spikes.
Now, let’s dive a bit deeper into each platform’s pricing.
Amplitude pricing
Amplitude has a generous free plan, which lets you collect up to 10 million events per month, comes with basic analytics features, and supports unlimited data sources and users.

However, after the free tier,Amplitude is by far the most expensive platform on this list.
As with most enterprise platforms, their pricing isn’t transparent, as you have to talk to their sales team for a quote. The lowest price that Amplitude customers report is around $5,000/year paid annually with a 20% discount. Some customers report prices between $33,000/year for 25 million events and $40,000/year for 50 million events.
Mixpanel pricing
Mixpanel also has a free plan for up to 100,000 monthly tracked users in total (MTUs, the number of unique visitors who trigger at least one event), with unlimited data history, however, the free plan doesn’t provide access to any of the advanced analytics features like finding causal relationships between feature launches and user behavior.

If you want access to the advanced features (or if you need more than 100K MTUs), you can build a customizable plan, starting at $25/month. For 1,000 MTUs, Mixpanel costs $36/month when paid monthly and $299/year when paid annually (but volume discounts are baked into the price as your MTUs grow). They also have an option to build enterprise plans with additional reports and dedicated customer success.
Important note: Mixpanel upsells two features as add-ons — Data Pipelines (20% of base plan) and Group Analytics (40% of base plan). Data Pipelines let you export Mixpanel data directly to warehouses like Snowflake, BigQuery, and Azure. Group Analytics lets you calculate metrics like active usage and retention at the account or company level. If you need these features, Mixpanel will be between 20-60% more expensive.
Smartlook pricing
Smartlook has a generous free forever plan, which lets you record up to 3,000 user sessions per month (no credit card required).

The paid plans start at $55/month and come with a full-featured 30-day trial (again, no credit card required). You can also build custom plans based on how many sessions you want to record every month or an ultimate plan with custom sessions, events, funnels, and heatmaps.
Lastly, if you want to learn how Amplitude, Mixpanel, and Smartlook compare to other product analytics solutions like Heap and FullStory, check out our article on the top product analytics tools.
Streamline or enhance your tech stack with Smartlook
Smartlook gives you robust analytics that show what your users are doing — paired with session recordings and heatmaps that show why — all in one place.
If you’ve already invested in a product analytics solution like Mixpanel or Amplitude, adding Smartlook can give you the necessary context to understand user behavior. Alternatively, many teams find that Smartlook provides all the quantitative analytics capabilities they need, while the qualitative insights from session recordings empower more of their team members to understand user behavior.
If you want to see how you could streamline or enhance your product analytics tech stack with Smartlook, sign up for a full-featured, 30-day trial (no credit card required).
Or, for an in-depth Smartlook presentation that’s tailored to your business, schedule a demo with our team.