Mixpanel is one of the most seasoned and widely-used product analytics tools on the market.
However, it also has limitations that prevent many teams from utilizing its capabilities and understanding their users’ experiences. Specifically:
- Due to Mixpanel’s manual setup, teams spend months planning and implementing their event tracking before getting any useful behavior data. This manual instrumentation provides granular control over everything you collect, but it also makes the setup time-consuming and dependent on constant developer assistance.
- Mixpanel collects only quantitative data, which often isn’t enough to find UX problems or understand the “why” behind users’ actions. In most cases, getting an in-depth, nuanced understanding of your users’ experience also requires qualitative data — the subjective insights into what users want or why they do what they do — which Mixpanel doesn’t collect.
- Mixpanel’s quantitative nature makes its insights available only to team members with a data-oriented personality and skills. This high barrier to entry means most teams can’t take full advantage of Mixpanel without someone “translating” the quantitative data for them.
In this article, we’ll show you how Smartlook — our product analytics and visual user insights platform — helps teams overcome these limitations with a simple setup and a feature set that combines both quantitative and qualitative analytics.
We’ll also discuss situations in which Smartlook can be a great alternative or addition to Mixpanel.
Lastly, we’ll cover 13 other Mixpanel alternatives, with a focus on their setup, data collection mechanism, use cases, and pricing.
Here are all the Mixpanel alternatives and competitors covered below:
- Smartlook
- Amplitude
- Pendo
- Google Analytics
- Heap
- CleverTap
- FullStory
- Adobe Analytics
- Kissmetrics
- Countly
- Woopra
- Contentsquare
- LogRocket
- Glassbox
Smartlook is a Mixpanel alternative that offers robust product analytics and session recordings, and it won’t take your team forever to set up. Schedule a free demo or try Smartlook today with our full-featured, 30-day trial (no credit card required).
1. Smartlook
- Data capture and event tracking method: Automatic. Smartlook records every user session on your site or app with a single snippet and lets you track events without coding.
- Quantitative or qualitative analytics: Both. Smartlook combines the power of quantitative analytics with qualitative data, gathered via session recordings.
- Pricing: Smartlook has a free plan that captures up to 3,000 user sessions/month. Paid plans start at $55/month and come with a full-featured, 30-day free trial (no credit card required).
Smartlook brings product analytics and visual user insights under one roof for fast-growing, fast-building product teams. Our platform combines four key quantitative and qualitative analytics features: session recordings, events, funnels, and heatmaps.
Thanks to this diverse feature set and its simple setup, Smartlook is a great alternative or addition to Mixpanel, because:
- It records every user session and interaction in your product with a single code snippet. This makes Smartlook ideal for teams that don’t want to (or can’t) spend the time and engineering resources required for Mixpanel’s setup.
- It offers qualitative analytics features like session recordings and heatmaps, which help you understand why users do what they do. Mixpanel users can integrate Smartlook and Mixpanel and access session recording URLs right in their event feed. This allows you to go beyond the raw numbers that Mixpanel provides and understand your customers’ experiences, problems, and actions.
In the next sections, we’ll do a detailed breakdown of Smartlook’s benefits as an alternative or addition to Mixpanel.
Collect user behavior data automatically with a single code snippet
As we said, Mixpanel’s setup process requires careful planning of the events you want to track, followed by developer implementation, testing, and waiting for enough data to roll in.
As a result, teams often wait for months before getting any user behavior data.
Smartlook removes the most tedious parts of this process by recording all user sessions in your product with a single code snippet.
Once the snippet is added, Smartlook’s always-on session recordings automatically capture every user session, which means:
- You need very little intervention from your dev team since they only have to install one snippet.
- You won’t be missing valuable data when analyzing user behavior since all sessions are recorded by default.
- You get useful behavior data in minutes, not months, since session recordings start rolling in automatically.
After the setup, you can watch each session recording to see users’ exact experience with your product — which you can’t do with Mixpanel.
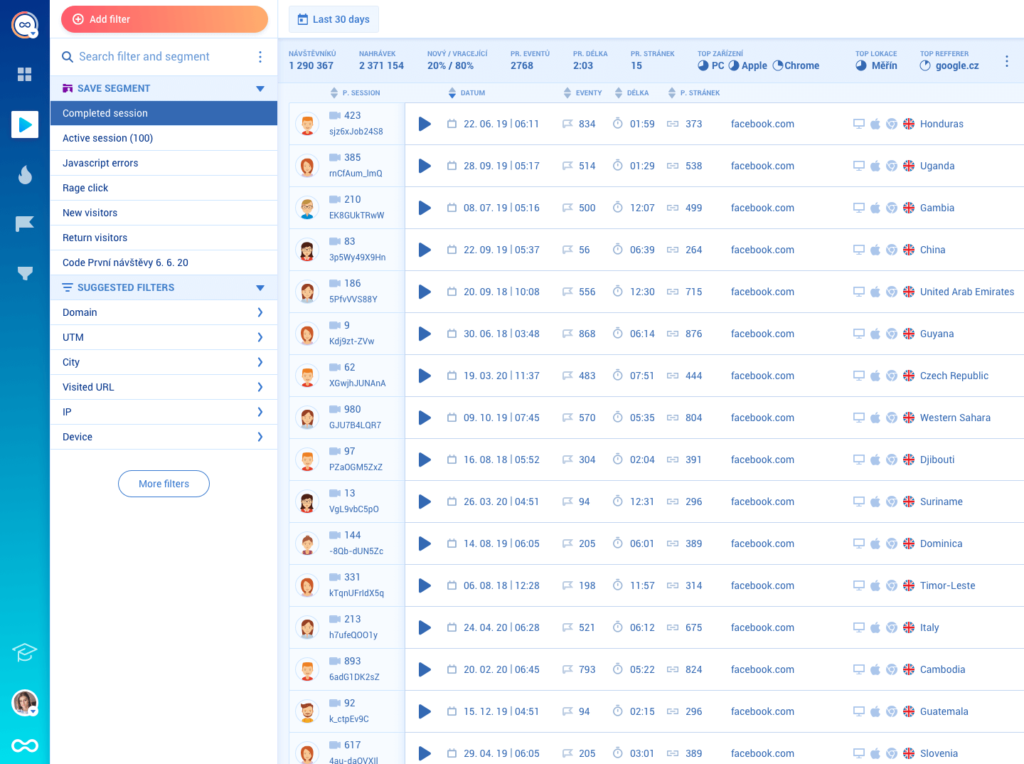
In most cases, it’s not practical to watch every session, which is why Smartlook makes it easy to find the ones you need.
First, our platform has 30+ filters, including technology- and location-based filters like device, operating system, country, and IP address. Additionally, if you set up Smartlook’s Identify API, you can locate session recordings of individual users, based on an identifier like their email or username.
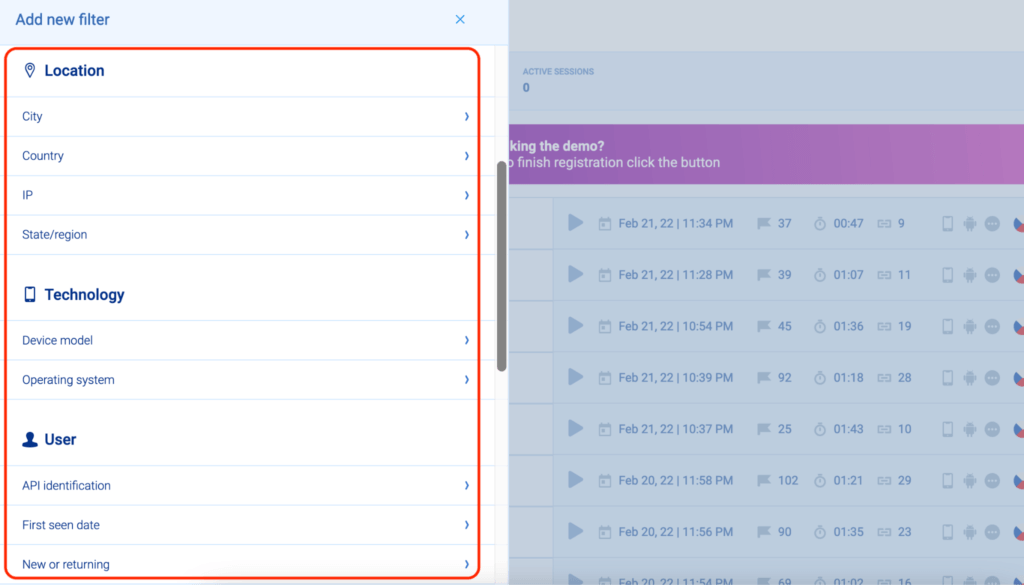
Second, Smartlook tracks JavaScript errors and rage clicks by default, so you can instantly jump into session replays of users who were frustrated or experienced an error.

Lastly, Smartlook lets you filter session replays, based on events and funnel stages, which we’ll discuss in a bit.
As Cyn Armistead, Technical Support Engineer at Travel Syndication Technology, says:
Track events and build funnels retroactively without coding
Mixpanel’s manual setup forces teams to carefully plan everything they’ll want to track in advance. And because there are so many ways users can interact with a product (and because it’s a big ask for the dev team), deciding exactly what to track often takes way too much time.
Plus, in some cases — e.g., when introducing a new product or feature — it’s almost impossible to predict everything you’ll need ahead of time.
During all of this planning and theorizing, you’re missing opportunities to find problems and improve your UX and conversion rates.
That’s why Smartlook automatically records all user interactions — e.g., button clicks or text inputs — and lets you track events retroactively without coding.
Having all user sessions and interactions recorded automatically means:
- You don’t have to set up tracking on each element separately (e.g., buttons or text fields).
- You don’t need to know all the events you’ll want to analyze in advance. Instead, Smartlook collects the interaction data by default and you just need to select which interactions you’ll monitor as events. This process is called defining an event and can be done in different ways without coding, for example, by clicking on elements in your site or app’s UI (as shown in the screenshot below).

With the proper tracking criteria and parameters, Smartlook is capable of tracking all kinds of complex user behaviors, and the support team is available to help users navigate any challenges they face with the setup.
As Juan Pablo Barrientos, user experience designer and front-end developer at Componata, notes:

For now, it’s important to note that when you define an event, Smartlook retroactively identifies every instance of that event, going back as far as your data retention plan goes.
As a result, the event tracking visualization appears immediately.

The CTO of Madfinger Games, an award-winning game development studio, highlighted the capability to define events retroactively as one of the biggest benefits of Smartlook:
Thanks to these capabilities, building and analyzing funnels can also be done retroactively (and is just as easy).
Funnels are sequences of events users go through to complete a goal, like purchasing a product, upgrading from free to paid, or completing an onboarding tutorial.
Smartlook lets you create funnels by placing two or more events in the order you believe your users follow. Then, the funnel visualization appears instantly.

After that, you can see the funnel’s overall conversion rate, as well as the conversion rates and drop-offs between each step.

For example, an e-commerce store may want to track the user journey from landing on the homepage, to searching for an item and completing the purchase.
In Smartlook, you can build such a funnel with five events without coding:
- Event 1: A homepage visitor clicks on the shop (select the button with our no-code event picker).
- Event 2: The visitor searches for an item (use the “Typed text” event).
- Event 3: The visitor clicks “Add to cart” (select the button with our no-code event picker to define the event).
- Event 4: They click on the “Pay Now” button (again, select that button with the no-code event picker).
- Event 5: They land on the “Thank you” page (use the “Visited URL” standard event and enter the page URL).
Find UX problems and opportunities for improving your conversions by combining quantitative and qualitative data
As we said, Mixpanel helps teams collect and analyze only quantitative data. However, without qualitative data — the subjective insights into what users want or why they do what they do — it’s usually difficult to find UX problems and boost your conversion rates.
To overcome this problem, Smartlook allows you to use both quantitative (events and funnels) and qualitative (session recordings) data.
Here’s how:
- You can watch all session recordings where a certain event took place. This gives you the full context behind users’ actions, which you can’t get with Mixpanel. For example, you can watch all sessions where users opened a certain feature and see what they did before and after that.

- You can also filter session recordings based on funnel stages. As you can see in the screenshot below, each funnel has a “Play” button under its stages, including the drop-offs. Clicking that button takes you directly to the relevant session recordings.

By watching session recordings of users who dropped off, one of our clients found out that shipping prices were the biggest factor driving away potential customers. When they implemented changes based on their findings, orders increased by 161%, bringing in half a million dollars more in yearly revenue.
Make behavior insights accessible to everyone in your organization
Mixpanel’s quantitative nature means that its reports, stats, and metrics require a technical mindset and data analysis skills to interpret. Due to this barrier to entry, most people can’t fully benefit from most of Mixpanel’s features.
In contrast, Smartlook’s session recordings and no-code event tracking empower many teams to find valuable user behavior insights.
Here are some examples:
- Product managers can speed up the product analytics process by collecting product events with a single snippet, instead of needing constant help from the dev team. For example, they can use the no-code event picker to track clicks on a new feature. They can also share session recordings with other teams to build a mutual understanding of the user experience.
- Marketing teams can track user actions as events and analyze the impacts of certain changes. Let’s say the marketing team updates your checkout page’s copy with the goal of getting more people to complete your form. They can use the no-code event picker to set up events to track clicks on the CTA as well as text inputs into each form field, allowing them to understand the impact of their changes.
- Customer support teams can quickly find and understand bugs reported by users, without needing explanations from them. Again, Smartlook’s Identify API lets you locate users’ session recordings, based on an identifier like email or username. When an identified user reports a bug, support teams can see exactly what went wrong. Then, they can resolve the simpler issues or, with more technical problems, send the session recordings to the development and quality assurance (QA) teams.
- Dev and QA teams can watch session recordings to see the exact situations in which bugs occurred, making bug reproduction much easier. In some situations, developers can also use the data sent in the background (which Smartlook provides) to skip reproduction altogether.
Mixpanel vs Smartlook
When comparing Mixpanel and Smartlook directly, you’ll find a few overlapping capabilities, like:
- Segmentation, which refers to the process of grouping users together based on common properties, like their device, country, or events they’ve triggered. Both tools allow you to build, save, and monitor user segments over time.
- Retention analysis, which refers to the process of tracking what percentage of visitors that perform an action (e.g., make an in-app purchase) continue to do so over the next days, weeks, or months. Mixpanel offers a Retention Report, while Smartlook has Retention Tables, which let you track user cohorts over time while calculating retention for you.
- Funnel analysis, which we discussed above.
Both tools can be used on websites, as well as web and mobile applications.
In terms of differences, Smartlook does both quantitative and qualitative analytics and captures all user sessions and interactions with one snippet.
In contrast, Mixpanel offers more ways to analyze quantitative data, but it requires much more time and engineering resources to set up and utilize correctly.
Lastly, Mixpanel doesn’t have any qualitative analytics features, which makes it difficult to understand the “why” behind your users’ behavior. If you’re facing this problem, you can get a qualitative upgrade to your Mixpanel data by integrating Mixpanel and Smartlook.
Analyze and improve your UX, conversions, and revenue with Smartlook’s full-featured, 30-day trial — no credit card required. If you need more time to evaluate, use our forever-free plan as long as you need.
For a detailed Smartlook presentation that’s tailored to your business, schedule a demo with our team.
2. Amplitude
- Data capture and event tracking method: Manual. You need to plan which interactions you’ll want to capture in advance and have a developer implement event tracking.
- Quantitative or qualitative analytics: Quantitative only.
- Pricing: Free plan is available for up to 10 million monthly events and basic analytics features. There are no publicly available pricing plans, but the lowest price that Amplitude customers report is around $5,000/year.
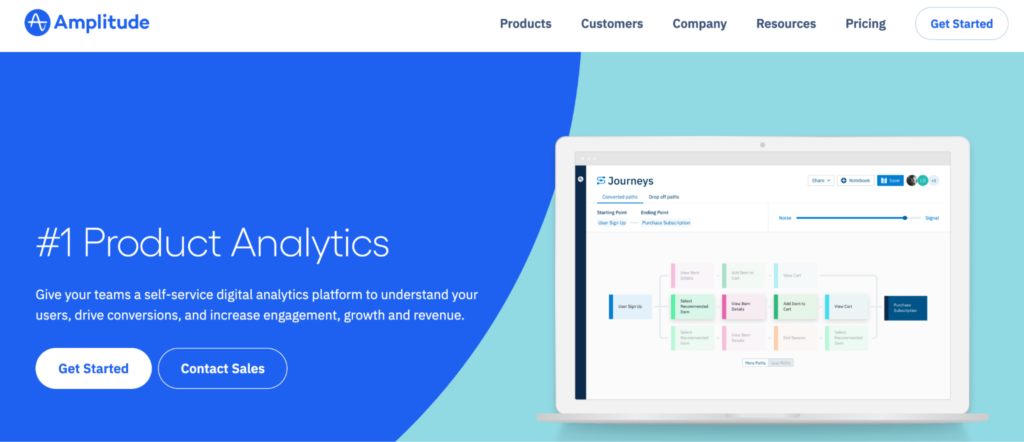
Amplitude is one of the most comprehensive product analytics platforms on the market. It combines a few different products, one of which is Amplitude Analytics — a tool that helps analyze the customer journey and build better products. As an enterprise-grade platform, Amplitude offers tons of ways to analyze quantitative data and do all kinds of event-based analytics.
Mixpanel vs Amplitude
Since both Mixpanel and Amplitude are focused only on quantitative analytics, there’s a lot of overlap in their capabilities, although they use different terminology (Mixpanel uses “Reports”, while Amplitude calls them “Charts”).
However, the sheer breadth of features that Amplitude supports is almost unmatched. As a result, there are some advanced data analytics capabilities that Amplitude has and Mixpanel doesn’t. At the same time, Amplitude also has a steeper learning curve and is much more expensive.
For a more detailed comparison, check out our article on Amplitude vs. Mixpanel vs. Smartlook.
3. Pendo

- Data capture and event tracking method: Automatic. Pendo records feature clicks, screens, and page loads and lets users define events retroactively.
- Quantitative or qualitative analytics: Both.
- Pricing: Free plan is available for apps with up to 1,000 monthly active users. Pricing for paid plans is available upon request.
Pendo is an analytics platform with two key use cases — product experience (for customer-facing apps) and digital adoption (for employee-facing software). In terms of product analytics, it has both quantitative and qualitative capabilities.
It’s worth noting that Pendo collects qualitative data via surveys and other user feedback features, not session recordings like Smartlook. This means you’re counting on users wanting to share their authentic experience with you, which typically doesn’t happen.
Mixpanel vs Pendo
The biggest difference between both tools is their area of specialization. Mixpanel is focused entirely on product analytics, so it offers more ways to analyze user behavior. Conversely, Pendo supports more use cases outside of analytics. For example, you can use it to create and share a product roadmap, communicate with users, improve employee productivity, and more.
4. Google Analytics

- Data capture and event tracking method: Manual with Universal Analytics (older version). Google Analytics 4 has taken some steps into automatic event tracking.
- Quantitative or qualitative analytics: Quantitative only.
- Pricing: Google Analytics is free.
Since its release in 2005, Google Analytics has become the most popular web analytics tool, to the point of being almost synonymous with the entire analytics category.
At the same time, it also has some downsides, like its manual event tracking setup and lack of qualitative analytics features, which we discussed in our article on the top 13 Google Analytics alternatives.
Mixpanel vs Google Analytics
Since its inception, Google Analytics has been a great tool for finding out how users arrive on your site, as well as getting aggregated data about your traffic (like pageviews, bounce rates, demographics, etc.). Mixpanel, instead, is much better at showing you what your users do after they arrive with easier-to-use funnels, segmentation, and retention reports.
Lastly, it’s worth noting that all of Google Analytics’s features are free, whereas Mixpanel has a free plan with limited capabilities.
5. Heap
- Data capture and event tracking method: Automatic. Heap’s auto-capture feature collects every click, swipe, tap, pageview, and form fill with a single snippet.
- Quantitative or qualitative analytics: Both.
- Pricing: Free plan is available for one product or website and up to 10,000 monthly sessions. Pricing for paid plans is available after a request to their team.
Heap is a digital insights platform that offers a few different categories of tools for data analysis, data foundation, and data management. While it started as a quantitative analytics platform, Heap recently acquired session recording tool Auryc and made session replay a part of the core platform.
Mixpanel vs Heap
Mixpanel and Heap share some features like segmentation, funnels, and retention analysis. In terms of differences, Heap collects user interactions automatically and offers both quantitative and qualitative analytics (like Smartlook).
Unlike Heap, Mixpanel has transparent pricing and lets you build a custom plan without contacting their team.
6. CleverTap

- Data capture and event tracking method: Mostly automatic, but some events have to be tracked manually with the SDK or API.
- Quantitative or qualitative analytics: Quantitative.
- Pricing: Available after a demo with their team.
CleverTap is a tool that helps teams increase app engagement and boost growth. It combines several different features and capabilities, like analytics, omnichannel engagement, push notifications, and A/B testing.
Mixpanel vs CleverTap
Similar to Pendo, CleverTap supports a wide range of use cases — from app analytics to user engagement and campaign optimization. Mixpanel, as a specialized analytics solution, offers advanced reports that CleverTap doesn’t and relies on integrations for things like A/B testing and user engagement.
7. FullStory
- Data capture and event tracking method: Automatic with a single code snippet.
- Quantitative or qualitative analytics: Both.
- Pricing: Available upon request to their team. No free forever plan, only a 14-day free trial of their web product.
FullStory is a Digital Experience Intelligence (DXI) platform that has a session replay tool, conversion funnels, features for segmenting and filtering users based on their actions, and more.
Similar to Amplitude, FullStory is also geared toward enterprises, so many online reviews mention it has a very steep price tag, as we discuss in our FullStory alternatives article.
Mixpanel vs FullStory
Like Smartlook, FullStory offers both quantitative and qualitative analytics features and collects user behavior data with a single code snippet. However, Mixpanel is much more affordable and transparent with its pricing, making it a better choice for startups and other smaller businesses.
Additionally, both tools can be used together thanks to their official integrations.
8. Adobe Analytics
- Data capture and event tracking method: Manual. You need to plan which interactions you’ll want to capture in advance and have a developer implement event tracking.
- Quantitative or qualitative analytics: Quantitative only.
- Pricing: Available after a demo with their team. No information about a free plan.
Adobe Analytics is another popular analytics software platform for enterprises. It’s part of Adobe’s Experience Cloud, so it can be used with other popular Adobe products like Marketo Engage and Adobe Commerce.
Mixpanel vs Adobe Analytics
Like many of the previous tools discussed, you can find many overlapping capabilities, such as segmentation, funnel analysis, retention analysis, and user cohort tracking.
Being an enterprise solution, Adobe Analytics supports a larger breadth of advanced features, like predictive analytics, marketing attribution tracking, and cross-platform analytics. However, Adobe Analytics is also much more expensive and takes more time to set up and master than Mixpanel.
9. Kissmetrics
- Data capture and event tracking method: Manual.
- Quantitative or qualitative analytics: Quantitative only.
- Pricing: Starts at $299/month for up to 10,000 monthly tracked users. There’s no free plan or trial, only a demo.
Kissmetrics is a product and marketing analytics solution for websites and mobile apps. It has specialized features for SaaS and e-commerce businesses, such as sales and revenue tracking, user cohorts, and the ability to tie every action to a specific user.
Mixpanel vs Kissmetrics
Mixpanel and Kissmetrics are both quantitative analytics solutions, so they overlap in a few areas, such as key metric tracking, funnel analysis, segmentation, and user cohorts.
Pricing is a big differentiator — Kissmetrics starts at $299/month for 10,000 monthly tracked users (MTUs) and you can only pay for a whole year, while Mixpanel starts at $190/month for the same number of MTUs on the monthly plan or around $133/month on the yearly plan.
10. Countly
- Data capture and event tracking method: Manual.
- Quantitative or qualitative analytics: The core platform is quantitative-only, but it can be extended via Countly’s official plugins.
- Pricing: There’s a free self-hosted version with limited features. Pricing for the paid version is available upon request.
Countly is a product analytics platform for web, desktop, and mobile apps. It can be installed on-premises or in a private cloud from any location.
Countly offers many plugins for additional capabilities like surveying users, sending push notifications, and A/B testing.
Lastly, Countly has 15+ open-source SDKs for mobile analytics and marketing, web, desktop, smart TV, and more.
Mixpanel vs Countly
Mixpanel and Countly can both help you analyze retention, user cohorts, funnels, and behavior flows, as well as segment users and build custom events.
However, both tools take a different approach to enhancements and integrations. On the one hand, Countly doesn’t support many integrations with third-party tools. Instead, it has a library of plugins, which can be added on top of their core platform.
Mixpanel, on the other hand, has integrations with 90+ other widely-used tools for A/B testing, push notifications, marketing automation, storing customer data in data warehouses, and much more. This makes it easier to incorporate into widely-used product, marketing, data analytics, and dev tech stacks.
11. Woopra
- Data capture and event tracking method: Pageviews are tracked automatically, but all other events need to be set up manually.
- Quantitative or qualitative analytics: Quantitative only.
- Pricing: Free plan for tracking up to 500,000 user actions per month. Paid plans start at $349/month with a 14-day free trial.
Woopra is a platform that helps teams analyze their users’ journeys in real time and automate personalization and engagement campaigns. Their analytics functionalities are separated into three modules:
- Journeys, for mapping out the paths that users take and measuring marketing campaign attribution.
- Trends, for analyzing the changes in product performance metrics.
- Retention, for analyzing how long users continue to engage with specific features.
Mixpanel vs Woopra
Outside of the standard quantitative analytics capabilities that both tools have (e.g., funnel analysis, segmentation, metric tracking, and retention analysis), Woopra stands out with its features for automating personalization and engagement campaigns.
However, Mixpanel is much more cost-effective, starting at $25/month, while Woopra’s cheapest plan is $349/month.
12. Contentsquare

- Data capture and event tracking method: Automatic.
- Quantitative or qualitative analytics: Both.
- Pricing: Pricing is available after a demo with their team. No information about a free plan or trial.
Contentsquare is an enterprise digital experience platform, which acquired Hotjar (a popular behavior analytics tool) in 2021. It supports tons of quantitative and qualitative analytics features for marketing, analytics, IT operations, UX, and product teams.
Mixpanel vs Contentsquare
As with the other enterprise solutions on this list, Contentsquare simply has many more advanced quantitative and qualitative analytics features than Mixpanel. For example, Contentsquare has both heatmaps and session replay — two of the most useful qualitative analytics tools.
Mixpanel is a much more specialized solution (so there’s less risk of paying for features you don’t need), while also being affordable and transparent with its pricing.
13. LogRocket

- Data capture and event tracking method: Mostly automatic.
- Quantitative or qualitative analytics: Both.
- Pricing: Free plan is available for recording up to 1000 user sessions/month. Paid plans start at $99/month for 10,000 monthly user sessions.
LogRocket is a frontend monitoring and product analytics solution that combines session replay, performance monitoring, and product analytics. This diverse feature set makes LogRocket a useful tool for engineering, product, and marketing teams.
Mixpanel vs LogRocket
From a product analytics standpoint, Mixpanel brings more to the table with advanced features like Impact and Signal reports.
However, LogRocket has an edge in other use cases, since you can use it to watch how users interact with your product (via session replay), as well as monitor CPU and memory usage, page load times, network speeds, browser crashes, and other frontend performance issues.
14. Glassbox

- Data capture and event tracking method: Automatic.
- Quantitative or qualitative analytics: Both.
- Pricing: Pricing is available after a demo with their team. No information about a free plan or trial.
Glassbox is a digital customer experience analytics platform. It allows product teams to automatically capture, visualize, and analyze 100% of their customers’ journeys.
Mixpanel vs Glassbox
Glassbox is a more balanced solution than Mixpanel because it comes with both quantitative (e.g., journey and metric tracking) and qualitative (e.g., session replay and voice of customer) analytics features. However, Mixpanel offers more in the quantitative analytics department, e.g., its Impact and Signal reports.
Also, Mixpanel is transparent with its pricing, whereas Glassbox requires you to contact their sales team.
Build or enhance your analytics stack with Smartlook
Smartlook gives you robust analytics that show what your users are doing — paired with session recordings and heatmaps that show why — all in one place.
If you’ve already invested time and effort into setting up Mixpanel, integrating Smartlook can help you go beyond the raw numbers and truly understand your users’ behavior.
Alternatively, many teams find that Smartlook provides all the quantitative analytics capabilities they need, without the complex, time-consuming setup. Plus the qualitative insights from session recordings empower more team members to understand user behavior and develop a shared understanding of the actual user experience.
If you want to learn how Smartlook can benefit your business specifically, schedule a personalized demo with our team. Or, if you want to give Smartlook a go yourself, sign up for a full-featured, 30-day trial (no credit card required).