Heatmaps are a popular data visualization method in website analytics because they require little user input to create and they’re easy to read.
But when it comes to understanding user behavior and gaining actionable insights that will help you improve your conversion rate and remove friction from your checkout flow, heatmaps alone won’t do the trick.
Heatmaps have three main limitations:
- The insights tend to be obvious and not very actionable. The colored hotspots on a page that indicate click density are almost always clustered around buttons, which is exactly what you’d expect. But even knowing which button is the most-clicked on a page doesn’t tell you what percentage of people who clicked that button actually converted to paying customers, and it doesn’t help you understand differences in behavior between your most valuable visitors and the rest (those that don’t convert).
- They only show aggregate trends about a single page. You can’t track a single user’s journey across your website, nor can you understand any trends about user interactions with elements that appear on multiple pages of your website.
- Many heatmapping tools can’t handle dynamic content. Unless a heatmap software tool also records user sessions, it can run into trouble when dealing with Javascript-heavy web pages with content that changes often (like social media sites), making the heatmap unreliable.
Every heatmap looks something like…
– Here’s a CTA in hero, it gets the most clicks
– Here’s a CTA lower down the page, it gets fewer clicks
– Empty space gets no click
(Same applies to click, mouse movement, scroll, eye-tracking, etc)
How does it actually help?…”

Our website and mobile app analytics tool, Smartlook, was designed to help solve the above issues of basic heatmaps and provide more useful insights that digital marketers and product managers need to improve conversion and retention rates on their websites or apps.
In this post, we’ll show you how Smartlook overcomes the limitations of heatmaps by combining heatmapping with three other much more actionable web analytics tools (session replay, events, and funnels), AI predictive analytics, and cross-platform analytics.
We’ll cover:
- How to get the most value out of heatmaps
- 5 Heatmap alternatives for better UX analytics
- How to use session recordings to better understand user behavior
- Automatic event tracking as a way to monitor critical customer interactions across websites
- Funnels as a way to optimize your conversion rates
- How to use AI analytics to drive predictive insights and anticipate customer behavior
- Cross-platform analytics as a way to get a holistic view of the customer journey
Smartlook is a website and mobile app analytics tool that combines the power of heatmaps, session recording, event tracking, and funnel analysis to help you improve conversion rates, find and fix bugs faster, and boost customer retention. Create a free account and start recording sessions today.
How to get the most value out of heatmaps
Even though heatmaps have limitations, you can use them to gather some quick data about how users interact with individual pages, which can lead to hypotheses of what you can change to increase the performance of your website.
With Smartlook, you can view three types of heatmap visualizations: clicks, movement, or scroll.
Here are three ways our most successful customers use Smartlook’s alternative visualizations of heatmaps:
Quickly measure clicks for every button on an entire page
When you create a heatmap, you’ll see colored areas (hotspots) around each button on your page. The colors of each hotspot will give you an idea of which buttons get the most clicks (red means more, blue means less), but you can click on the hotspots in the heatmap to find out exactly how many clicks each one got.
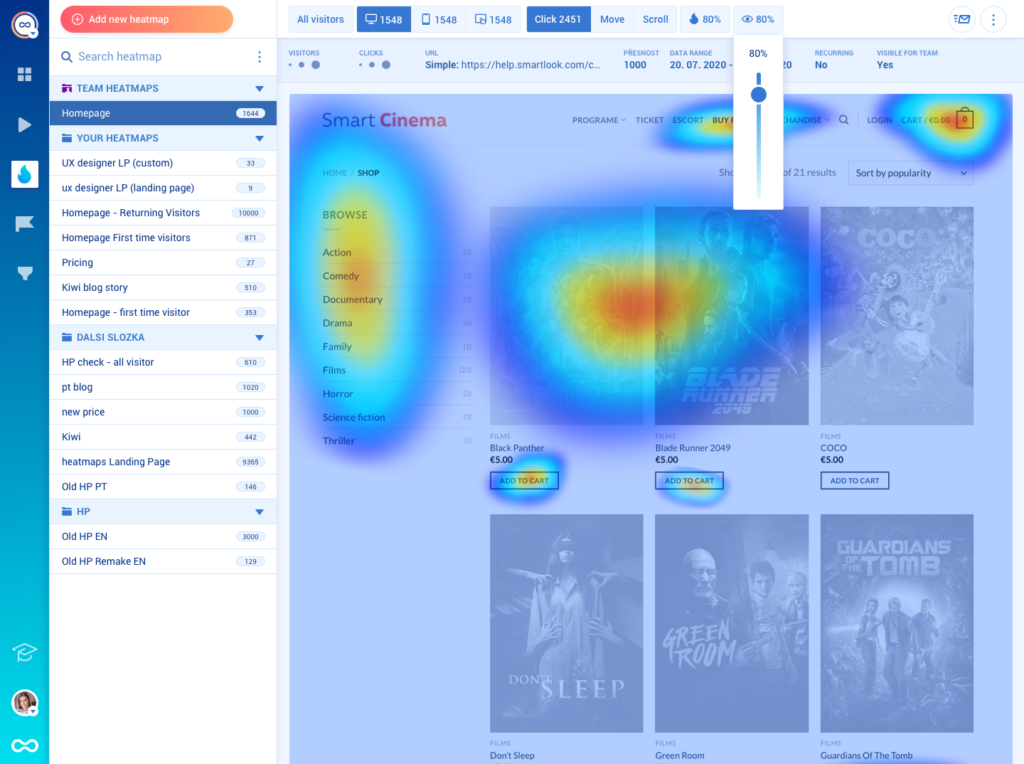
Creating a heatmap only takes a few seconds (all you have to do is add the url, specify the number of pageviews to include, and define the date range).
With just a few clicks, you can find out the number of clicks for each button on an entire page.
It’s possible to create basic heatmaps for free using the Page Analytics extension from Google Analytics, but the click map only shows you the relative percentages of clicks each element gets (see the screenshot below for an example).
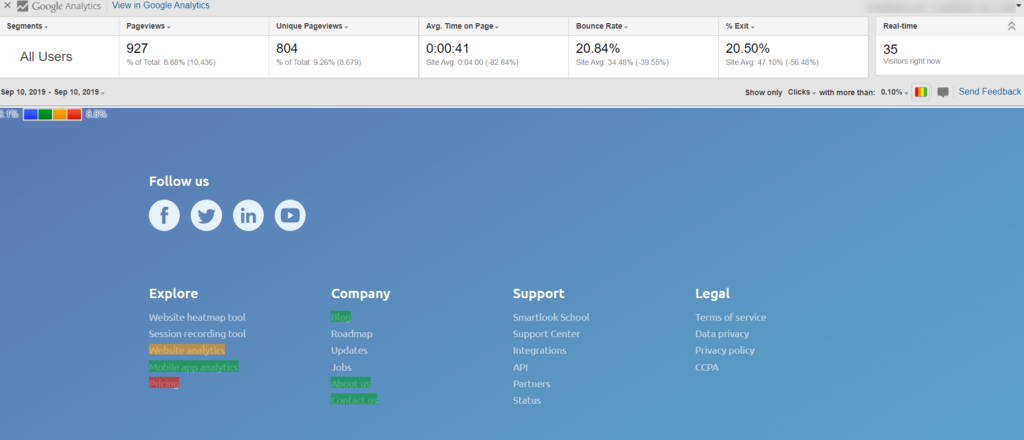
Alternatively, you could set up event tracking for each individual button in Google Analytics to get the actual number of clicks on each button, but this is tedious and requires a developer, and then you’d have to wait for the data points to roll in before you can analyze them.
And if you forget to create an event for a button, there’s no way to get retroactive analysis — you’d have to add it in and wait even longer to get the same info you can get from a heatmap in Smartlook.
Compare new and old versions of your site or app (even retroactively)
Unlike most heatmapping tools, Smartlook allows you to create heatmaps retroactively for websites and mobile apps. This makes it easy to compare heatmaps from before and after a major change on your site or app, such as a redesign of your main product landing page.
With Smartlook, all you have to do to see this before-and-after comparison is create two heatmaps with different date ranges — one before the design change, and one after. You’ll instantly be able to compare the old version to the new version.
With other heatmap tools, if you didn’t create a heatmap of the old version before switching to the new one, you’d have no way to compare.
Use scrollmaps to see which sections of your page are being ignored
Scrollmaps can help you evaluate whether your messaging is holding your audience’s attention. Scrollmaps show you what percentage of visitors to each page made it to each section of the page before navigating to another page (or leaving your site).
If most of your audience drops out before they get to the call-to-action (or CTA), your messaging isn’t working well.
Some common design problems you can find with scrollmaps:
- False bottoms: A design flaw that makes it look like the page ends before it does, causing users to navigate away without scrolling to the bottom of the page.
- Poor positioning of important elements: Testimonials, demo videos, calls-to-action, etc.
In this case study, you can learn how one of our customers used heatmaps to improve their CTR from the homepage to their B2B e-shop by 276%. One of the key learnings was that their page appeared to end before the CTA, so most users never scrolled far enough to see it.
Combine heatmaps with qualitative analytics tools for more insights
As we mentioned above, the analyses you can perform with heatmaps alone only lead to hypotheses about what may be happening on your website. To really understand the why behind the trends you observe with heatmaps, you need to combine them with our other analytics tools: screen recordings, events, and funnels.
In the next sections, we’ll teach you how to use all of these qualitative analytics tools to get actionable insights about what to change on your website or app to improve its performance (and how to measure whether those changes actually worked).
5 Heatmap alternatives for better UX analytics
Here are 5 alternative tools to heatmaps:
- Session recordings
- Event tracking
- Funnels
- AI analytics
- Cross-platform analytics
Session recordings to better understand user behavior
Session recordings are replays of real user interactions with your website — from the moment they landed on your site to the moment they left. Unlike heatmaps, session recordings give you the full context behind a particular action to help you figure out why things are happening.

Below, we’ll discuss the advantages of session recordings, and how pairing recordings with heatmaps, events, and funnels lets you focus on just the recordings that matter most, saving you a lot of time sifting through recordings.
Understand the user journey from start to finish
Smartlook’s session recordings automatically capture every action the user performed during their session. You can watch the recordings like a movie to see exactly what the user saw when they were on your site (not just a simulation).
You’ll see where they moved their mouse, where they clicked, and what series of pages they explored before either exiting your site or purchasing a product.
Often, watching a few recordings of users who made it to your checkout page will help you immediately identify areas where your UI is confusing, but there’s much more you can do with session recordings in Smartlook.
Triage support tickets with email lookup
With Smartlook’s API, you can match recordings to users. If a user contacts customer support about a bug, you can use their name or email to look up the session in question and watch the replay to understand whether they encountered a real bug or if the problem was user error.
If it was a bug, you can send the recording to developers so they can see what device, operating system, and browser the customer was using, the location of their IP address, and what specific actions may have led up to the bug appearing. This can save lots of precious developer time, because without these session recordings, developers often have to spend a lot of time trying to reproduce the bug before they can begin to fix it.
Find the most relevant recordings with funnels
The benefits above may have been enough to convince you to try session recordings. But you may also be thinking, “My website has hundreds of thousands of visitors, and I don’t have time to watch even a hundred recordings. How do I know which ones to watch to get actionable insights?”
That’s where events and funnels come into play. Just like heatmaps, session recordings are most valuable when combined with events and funnels (which we discuss more below).
For example, say you’re using Smartlook’s funnel analysis tool (or another conversion rate optimization tool, like Google Analytics) to monitor the conversion rate from visiting your homepage to adding an item to the cart.
If you noticed a sudden drop in conversions between two steps in this flow, you could use Smartlook to watch just the recordings of users who dropped at that exact point in the flow. Without a funnel analysis feature, you wouldn’t know which recordings to watch to learn why the conversion rate dropped.
Keep reading for examples of how you can use funnel analysis to find drop-offs in your funnel and improve your conversion rate.
Automatic event tracking to monitor business-critical customer interactions across your website
In analytics, an event is any user interaction that can be measured and analyzed, including button clicks, downloads, form inputs, video plays, pop-up windows, scroll-depth level and many more.
What is event tracking in website analytics
The main difference between basic page tracking (what most people track in Google Analytics) and event tracking in Smartlook is that you can track actions that don’t generate changes in URL (e.g. clicking add to cart, using search filters, starting to fill a form, etc.), and you can do it without involving a developer.
As we mentioned before, it’s possible to track events in tools such as Google Analytics, but it usually requires a developer adding specific event tracking code to the elements and actions you want to track.
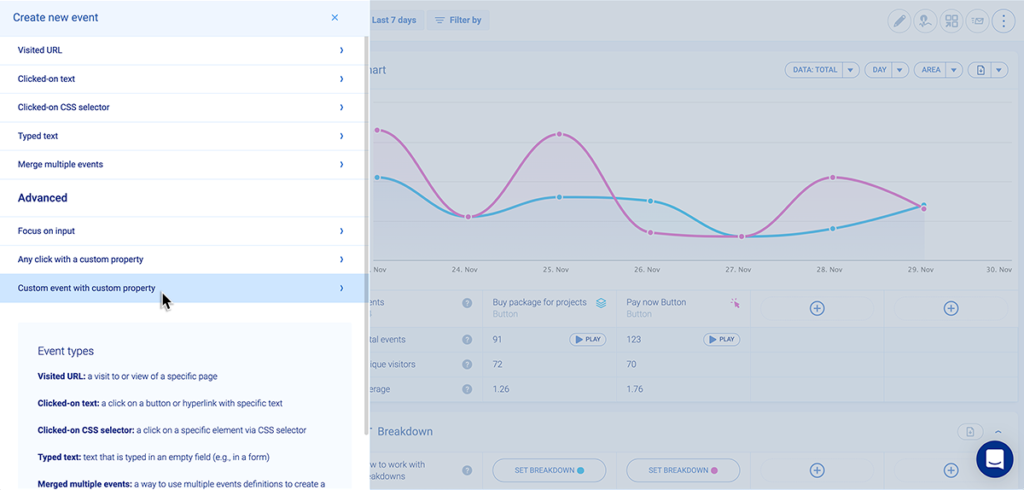
In Smartlook, to track standard events, you can either choose from a drop-down list, use the no-code event picker to identify them by navigating through your UI, or define an event from a recording. If you want to track a user interaction besides a click, page view, or text input, you can also create custom events. For example, if you wanted to understand how your users are interacting with pop-ups on a page, you’d need to configure a custom event that will fire when your user sees certain pop-up windows. With custom events, you can track pretty much anything you want, you just need direct access to your website code and some JavaScript skills.
In addition to tracking individual events, Smartlook also collects additional data, known as properties, that add richness to the events. The default properties that Smartlook tracks for each event are device type, operating system, and geographic location. But with both standard and custom events, you can also add custom properties to further narrow down to the specific events you want to analyze. Custom properties can be things like registered or unregistered users, type of subscription, or product availability.
Event tracking, paired with session recordings, can help you fix broken and confusing elements in the UI
Unlike heatmaps, which tell you what users are doing, but don’t tell you much about why, tracking events and watching recordings of users performing those events is a powerful way to understand user behavior.
Take rage clicks, as an example. Rage clicks are when users repeatedly click on a page. Typically, rage clicks happen in places where users think an element should be clickable, but it’s not (like underlined text that doesn’t have a hyperlink, checkout cart images, icons that look like calls-to-action, etc.).
Because rage clicks almost always represent a confusing or broken element of your UI, Smartlook automatically tracks rage clicks by default and includes them in your dashboard.
Unlike tools that only track events, but don’t record user sessions, when you discover that a particular page has a lot of rage clicks, you often have to dig around in the HTML to figure out where the broken link is or why people are frustrated. But with Smartlook, you can instantly watch recordings associated with any event you are tracking.
For example, you can watch recordings of any users who rage clicked to see exactly what happened. You’ll be taken right to five seconds before the rage clicking starts, but if you need more context, you can watch their entire session from the first page they landed on to the page they exited from.
Monitor business-critical actions
With event tracking, you can monitor the frequency of users performing business-critical actions, and measure trends.
Here’s an example that applies to any SaaS tool with a free version (or at least a free trial) and a paid version. Often, there are a few key behaviors and actions associated with users who convert from free to paid. For example, in a productivity app like Trello, an action that may often be associated with users upgrading to the paid version might be opening more boards, because the free tier only offers 10 boards.
With Smartlook, you could create an event filter for the action of unpaid users creating new boards, and then use that number as a key performance indicator (KPI) for your team. As your product team makes changes to the user interface, you can evaluate whether those changes had a negative or positive impact on the frequency of that event.
Any event filters that you create can be saved as segments and added to your Smartlook dashboard. When you open your account, you can immediately see how your app is performing on that metric and quickly navigate to the recordings of users who performed that event.
Recognize trends faster with retroactive event tracking
Smartlook automatically tracks every user event across your entire website from the minute you add the tracking code to your site. Whenever you create a new user segment or want to analyze behavior trends around a specific action, you can define that event and immediately access the data going back as far as your data retention plan goes (the default retention plan is 30 days, but you can buy extra data retention).
With a lot of other tools (like Google Analytics or Amplitude), you have to manually set up each event that you want tracked, and you have to wait for data to come in before you can analyze it.
Track dynamic content performance
Use Smartlook’s events to track and analyze user interactions involving dynamic website content. Here’s how:
- Follow our installation instructions to add their tracking code to your website
- Identify dynamic content and create events for when it’s visible
- You can do this by adding custom JavaScript code to trigger events when users engage with dynamic content
- For instance, if you’re configuring an event that fires when user interact with a pop-up window, the code may look like this:
// full example with your defined variables
const eventName = ‘UserOpenUpsellWindow’;
const properties = {
“type”: “SmallDiscLimit”
};
smartlook(‘track’, eventName, properties);
From now on, Smartlook will record interactions with both static and dynamic website elements to help you make informed decisions regarding content optimization.
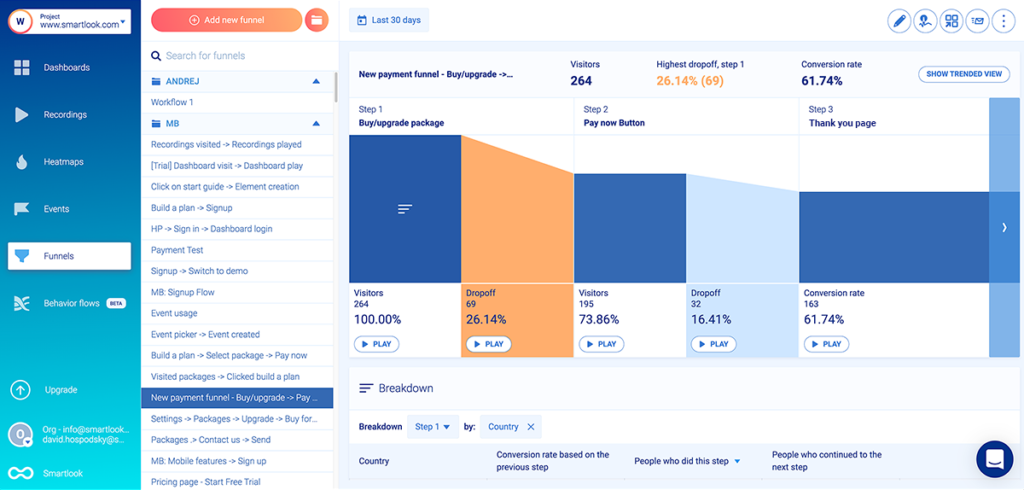
How funnels can help you optimize your conversion rate
While you can get a lot of value from the tools above, such as by investigating rage clicks and giving your support team access to session recordings, the most valuable insights from each of the tools come from pairing them with funnel analysis.
In Smartlook, a funnel is a visual representation of the user journey through a series of events. When paired with the recordings of each user that dropped off at each step, you can use funnels to analyze the differences in user behavior between those who converted and those who didn’t, which can give you a lot of insights to help improve your site and potentially increase conversion rates.
We’ve written a complete tutorial about funnel analysis, but we’ll share the short version here:
To create a funnel, you first need to define some event filters, as we demonstrated above. Remember, you don’t need a developer to do this in Smartlook.
Then, you just add all the events you want to track to the funnel, and it will calculate the conversion rate (or drop-off rate) of users from one step to the next and across the entire journey.
These drop-off points are the missing piece of the puzzle when it comes to turning interesting datasets into actionable insights.
They tell you which recordings to look at, which pages to create heatmaps for, and which events to track to find areas where a simple change to your user interface can lead to a much higher conversion rate.
The insights you can gain from funnels are almost endless, but a few quick use cases include:
- Optimize your checkout flow. One of our customers used Smartlook to examine the checkout funnel for an ecommerce shop, and discovered that the largest drop-off point in the funnel was when customers first saw the cost of shipping. With a little research, the team realized the shop’s shipping costs were higher than their competitors, so the customers’ sticker shock was justified. After lowering their shipping costs, they saw a sales increase of 161%.
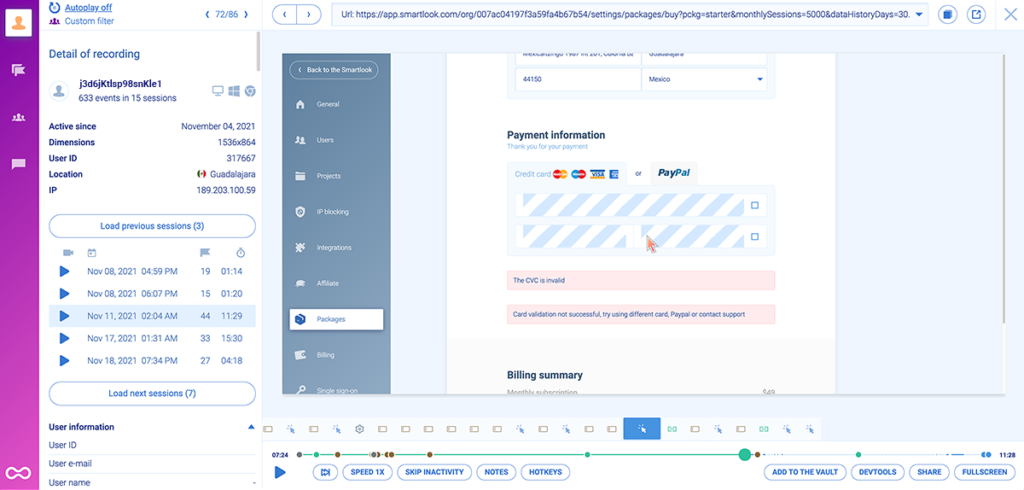
- Find technical errors in your checkout funnel. The lowest hanging fruit for improving your conversion rate is fixing technical errors that prevent people who want to buy your product from doing so, especially critical errors that prevent someone from checking out. One way to do this in Smartlook is to create separate events for the “Pay Now” button and the “Confirmation” page that shows up when a payment goes through. If there’s a drop-off between those two pages, it’s likely a technical error occurred. When you see this drop-off in your funnel, you can watch recordings of the users who experienced this issue and quickly figure out the nature of the error they encountered. We’ve used this feature on our own checkout funnel, and once discovered that due to a recent legal change in India, customers in India were unable to complete checkout. We were losing thousands of dollars daily until we changed our processes to comply with India’s new commerce laws. But without funnel analysis, we wouldn’t have noticed this anomaly.
With funnel analysis, once you identify an area for improvement and make a change, you’ll immediately be able to see the impact of that change by comparing the conversion funnels from before and after the change.
Use AI analytics to drive predictive insights and anticipate customer behavior
AI analytics use machine learning algorithms to analyze vast datasets, providing a nuanced understanding of how users interact with your website or product.
There’s no limit to what you can do with AI, but the most common and realistic applications of AI in data analytics are:
- AI-generated takeaways
- Predictive analytics
AI-generated takeaways
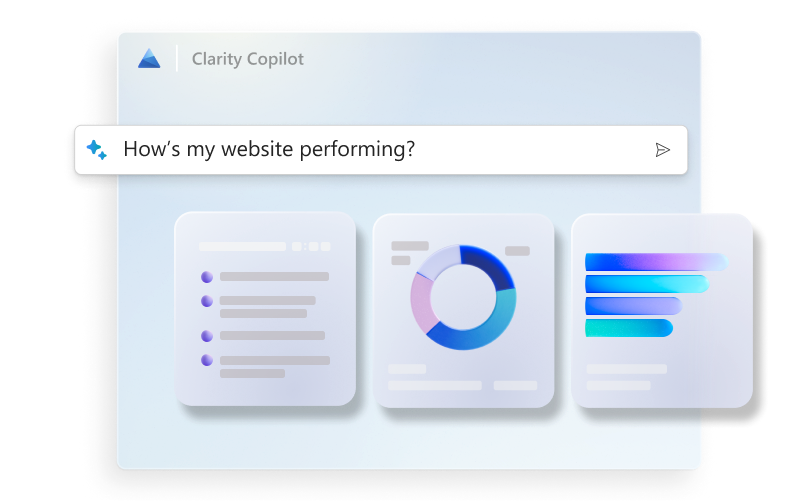
First off, blending AI and heatmaps allows you to quickly make sense of your data. When integrated with heatmap software, generative AI delivers easy to understand answers to your questions—you don’t even have to look into the visualizations.
A distinctive example of such an alliance is Copilot in Microsoft Clarity, an Open AI-powered technology that generates actionable takeaways from Microsoft Clarity dashboards. With the rise of generative AI, we can expect more and more product analytics tools to adopt a similar approach.
Predictive analytics
While heatmaps, session recordings, and other forms of product analytics help you understand the current state of your product experience, predictive analytics tell you what will (most likely) happen next.
It’s a helpful addition to your core analytics tools, enabling you to anticipate customer behavior and adjust your product and marketing strategy accordingly.
For instance, one of my team’s projects involved a startup that was losing funds due to poorly targeted ad campaigns. By utilising predictive analytics, we didn’t just broadly reduce acquisition costs; we found niche audience segments that the company hadn’t previously considered. We termed these the “silent majority.” These were individuals who were not the most vocal on social or even the most frequent purchasers, but when they did engage, they spent significantly.
Predictive analytics can reveal non-intuitive market segments, enabling businesses to target hidden gems among new customers.”

Predictive analysis anticipates user needs and preferences before they express them explicitly. Based on these predictive insights, you can personalize online experiences, offer timely product recommendations, and create offerings that resonate with your audience.
Depending on your area of focus, you can either build your own predictive analytics model or choose from a vast array of predictive analytics tools to make accurate forecasts and informed decisions.
Pecan AI offers predictive analytics software for teams to proactively optimize their offerings based on AI data analytics insights. Pecan uses predictive modeling to identify customers who are most likely to upsell or cross-sell by determining shared characteristics between users who successfully converted in the past.

If you don’t have an AI customer analytics tool in your tech stack, you can use Smartlook to run cohort analysis based on custom parameters and identify patterns in user behavior on your own. To begin, group users based on common characteristics (e.g. demographics, what sources they come from, etc.). Then you’ll be able to spot the point at which users from one group upgrade and backtrace what may have caused the behavior. As you spot positive signs (e.g. users interacting with your pricing page), just dive deeper into funnels and session recordings, and you’ll be able to optimize your product for conversions.
Cross-platform analytics give a holistic view of the customer journey
Cross-platform analytics can enhance the effectiveness of heatmaps, session recordings, event tracking, funnels, and AI analytics. Here’s how:
- Multi-channel funnel analysis. When used in conjunction with funnel analysis, cross-platform analytics reveal how users move through multiple touchpoints and platforms before converting or dropping off. This helps you optimize conversion paths
- Behavior consistency. Cross-platform analytics highlight inconsistencies in user behavior and preferences across different platforms. Use this information to refine the user experience and align it with user expectations
- Predictive power. When combined with predictive analytics, cross-platform data helps you anticipate user behavior and preferences across devices. This way, you can better tailor your multi-channel marketing strategy
Smartlook tracks the entire user journey across multiple platforms and devices. You’ll gain insight into how users move through your funnel, regardless of their device. For example, if a customer initiates a purchase on a mobile app and completes it from a web browser, you won’t miss a bite from their journey
Understand every user interaction with session recordings, events and funnels
Smartlook is an all-in-one website data analysis tool with a simple pricing structure that allows customers to capture recordings of every single visitor.
Unlike alternative heatmap software providers like FullStory, Hotjar, or Amplitude, Smartlook allows users to retroactively define events, funnels, and heatmaps — providing better real-time business intelligence.
By pairing heatmaps with session recordings, event tracking, and funnel analysis, Smartlook helps users understand the why behind every user interaction with their website or app.
Schedule a demo or start your no-risk 30-day free trial today.