Mixpanel and Google Analytics (GA) are two of the most popular analytics tools on the market. They have some overlapping features, but each one can also provide unique insights, which is why they’re often used in different situations by different teams.
GA is a web analytics software for uncovering how visitors get to your site, tracking which pages they visit, and analyzing aggregate metrics like bounce rate and time on page.
Mixpanel is a specialized product analytics tool for tracking in-app behaviors, segmenting users, and monitoring metrics like retention, engagement, lifetime value, and churn. These advanced product analytics capabilities are the reason why many teams decide to pay for Mixpanel, instead of just using GA for free.
Due to their differences, Mixpanel and GA are often used as complementary tools, with the former focusing on product analytics and the latter on website analytics.
In this guide, we’ll explore each tool’s setup, workflow, and unique capabilities, as well as the biggest differences between them, so you have a good understanding of their use cases.
We’ll also discuss how Smartlook — our product analytics and visual user insights platform — can help you overcome Mixpanel and Google Analytics (GA) biggest limitations by combining quantitative data with qualitative insights.
Before getting into the details, here’s a short overview of each tool:
- Mixpanel is a quantitative analytics tool for product teams looking to track how users interact with their app. Mixpanel is great for analyzing key product metrics — like feature usage, engagement, and retention — creating user segments, and monitoring how they use a product. Its setup process provides granular control over every user action you track, but it’s also much more difficult, time-consuming, and reliant on developer assistance than GA or Smartlook.
- Google Analytics is a quantitative analytics tool primarily used by marketers looking to analyze their campaigns and improve their websites’ conversions. GA can show you which sources drive traffic to your site, how many visits each page gets, and how users navigate important flows, as well as give you key stats and metrics about your visitors. Its setup is easier than Mixpanel’s, although it also requires developer assistance for tracking some user actions.
- Smartlook is our behavioral analytics platform that combines quantitative and qualitative capabilities and can be used by many teams in an organization. You can use Smartlook to analyze user behavior on your website, as well as on your web app or native mobile app. Its session recordings and heatmaps give you a more intuitive, visual way to analyze user behavior, compared to Mixpanel and GA. Smartlook automatically records every user session in your site or app with a single code snippet, making its setup process incredibly easy.
Now that we’ve covered the basics, let’s dive into more detail about the differences between Mixpanel, Google Analytics, and Smartlook.
Here’s everything we’ll discuss below:
- Mixpanel vs Google Analytics vs Smartlook: Setup, workflow & unique capabilities
- Mixpanel, Google Analytics, and Smartlook: Overlapping features
- Mixpanel vs Google Analytics vs Smartlook: Pricing comparison
Smartlook is the only combined product analytics and visual user insights platform that won’t take your team forever to set up. Book a free demo with our team to learn how Smartlook can benefit your business or try it yourself with a full-featured, 30-day trial — no credit card required.
Mixpanel vs Google Analytics vs Smartlook: Setup, workflow & unique capabilities
In this section, we’ll give you a detailed overview of how each tool works, how you can set up it, and what sets it apart from the other two.
Mixpanel
Mixpanel is a product analytics tool that brings together lots of useful features for product teams, including:
- Interactive reports filled with quantitative metrics and KPIs, like daily active users, retention, conversion rates, and more.
- Segmentation capabilities that help you break down your user base by any property or event.
- Cohort analysis, which lets you create different user cohorts, visualize the differences in their behaviors and understand how those differences affect conversions, engagement, and retention.
This feature set makes Mixpanel ideal for product teams looking to analyze their user segments, understand how they interact with the product, and find ways to increase engagement and retention.
While Mixpanel can also be used on websites, its main focus is on product analytics. If you’re only looking to analyze user behavior on your site, GA, Smartlook, or other website analytics tools are likely a better fit.
Mixpanel’s setup and workflow
Mixpanel is a traditional product analytics solution that relies on manual instrumentation. This means you’ll need to:
- Decide which events you want to track in Mixpanel.
- Have a developer to implement the tracking and test if it’s working.
- Wait for enough data to roll in and start analyzing user behavior.
This process gives you granular control over every event and property you collect. However, this comes at the price of being very difficult, time-consuming, and reliant on constant developer assistance (especially compared to Smartlook’s auto-tracking method).
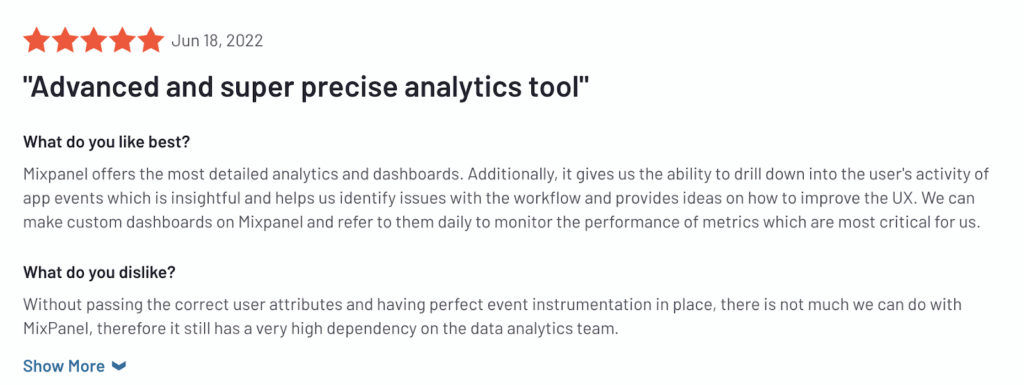
This is partly why some users mention the setup process and reliance on technical teams as the biggest downsides of working with Mixpanel.
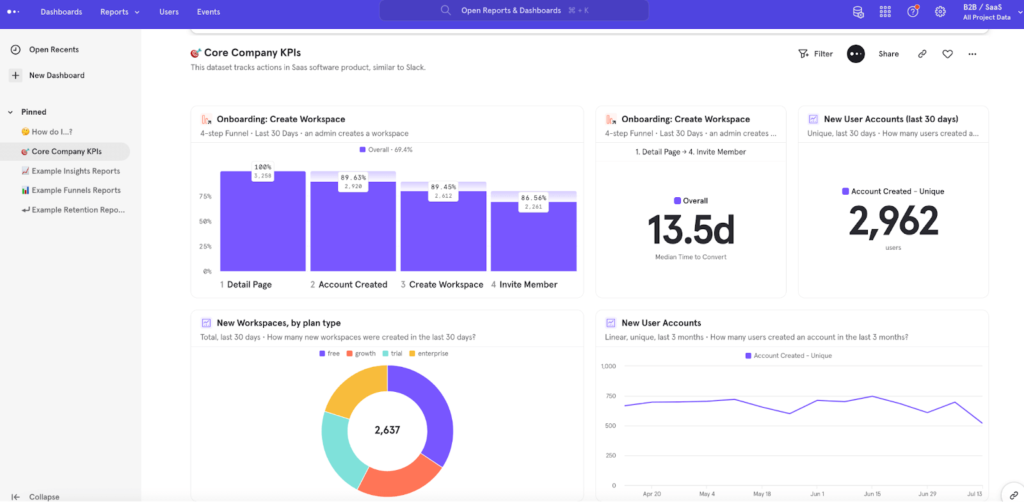
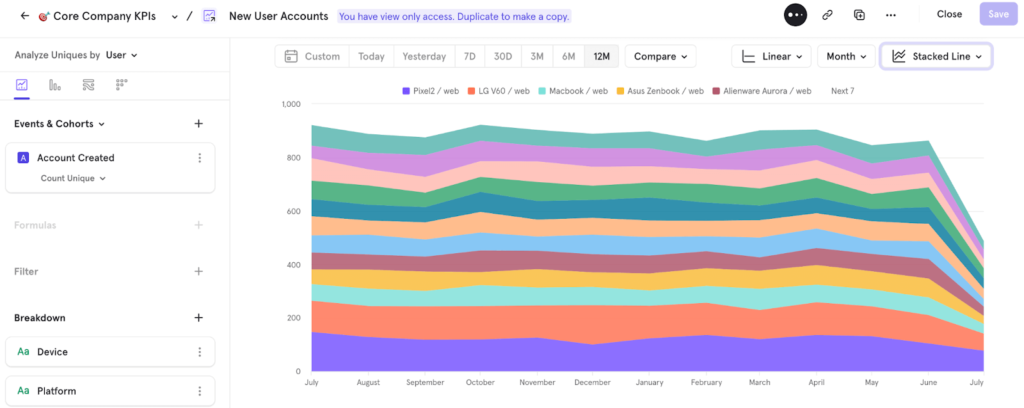
After setup, Mixpanel starts you off with a few pre-made reports out of the box. These reports can be organized into dashboards, like the “Core Company KPIs” dashboard in the screenshot below.
You can create new dashboards and fill them with different metrics and reports, like:
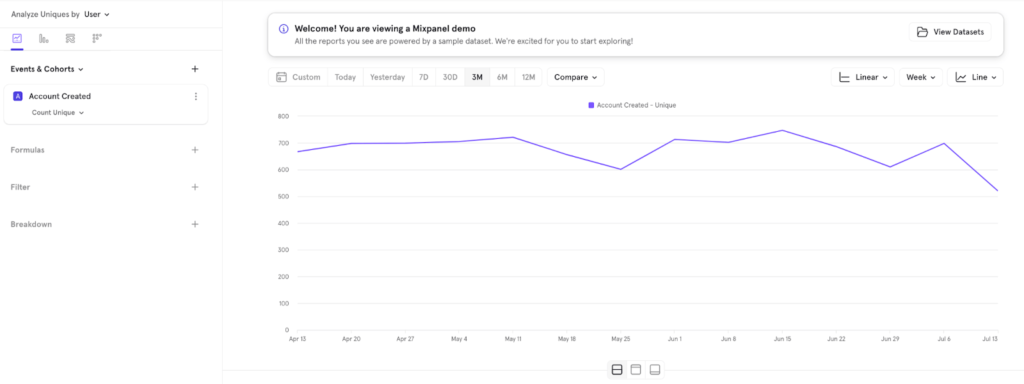
- The Insights Report for analyzing events, cohorts, and user profiles and displaying the data in various chart types (line, bar, pie, etc.).
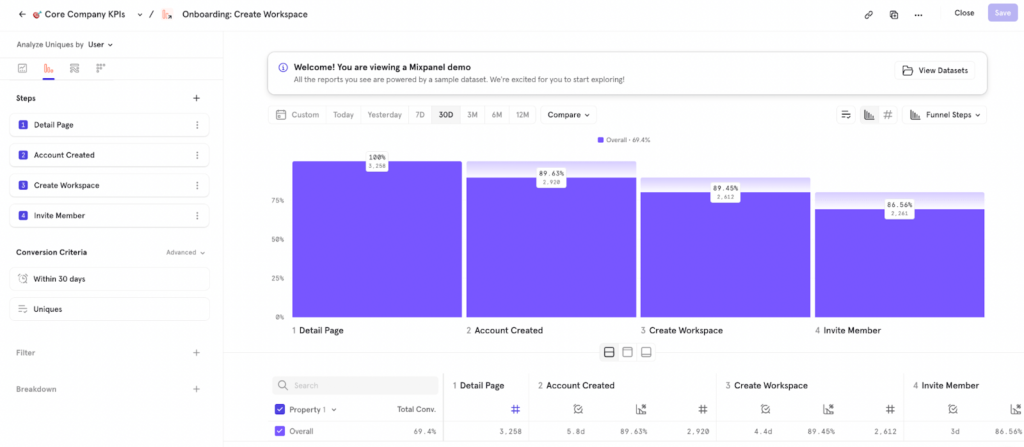
- The Funnels Report for analyzing how users go through a series of events and where they drop off.
- The Retention Report for analyzing user engagement over a period of time.
- The Flows Report for identifying the most frequently taken paths to or from any event.
Mixpanel’s biggest differentiators
Mixpanel’s biggest advantages over GA and Smartlook are its versatile and detailed product analytics reports. For example, here are three reports that only Mixpanel offers:
- The Impact Report, which lets you determine the impact of new features by comparing user behavior before and after their release.
- The Experiments Report, which analyzes how A/B tests affect key product metrics (although you still need a separate A/B testing tool to actually run experiments).
- The Signal Report, which finds correlations between different user actions and helps you get a better understanding of the behaviors that drive conversions.
These reports can be very useful for teams looking to guide their decisions with reliable product usage data. However, since they’re more advanced, all three reports are not included in Mixpanel’s free plan; the Impact report is available on the cheaper Pro plan, while the Experiments and Signal reports are only available for enterprise customers.
Lastly, Mixpanel has a unique retroactive enrichment feature for adding historical events to new business data. This can be useful if you forget to set up tracking or just need additional data later on in your analysis.
Google Analytics
GA is the most widely-used web analytics software. As part of Google’s ecosystem, GA was built to help marketers and website owners track attribution — i.e., which campaigns and sources drive traffic to their site.
While this remains GA’s primary use case, it also provides several useful metrics about:
- Your website’s visitors — their countries, devices, demographics, etc.
- Which pages users visit.
- How long they stay on those pages.
- How frequently they trigger certain events, and more.
This feature set makes GA a common choice for both beginner and advanced marketers looking to analyze their campaigns, understand the type of traffic they bring to the site, and monitor their most important pages.
GA can also be used on web and mobile apps, but most organizations use it for their website in addition to a separate mobile app analytics tool.
Google Analytics’ setup and workflow
GA’s setup is more straightforward than Mixpanel’s. You just need to create an Analytics account and add a code snippet to your site.
This can be done via code changes, through Google Tag Manager, or with various extensions and plug-ins (for CMSs like WordPress, Drupal, and Wix). While simpler, the setup should still be handled by a developer familiar with GA’s documentation.
After the setup, your GA dashboards and report will start getting populated. For example, you’ll automatically get real-time data about pageviews, traffic sources, user countries and devices, and much more.
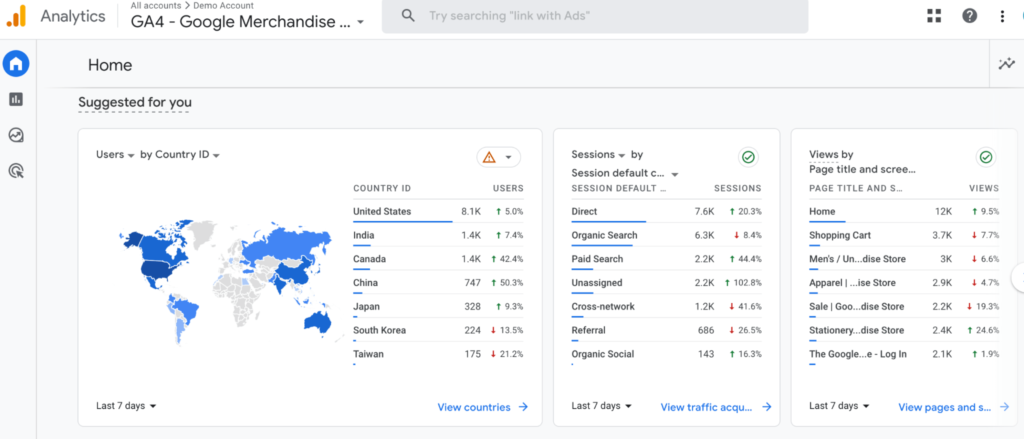
From here, you can change your GA setup by tracking custom events (outside of the automatically tracked ones) and customizing your reports with data that’s relevant to your organization.
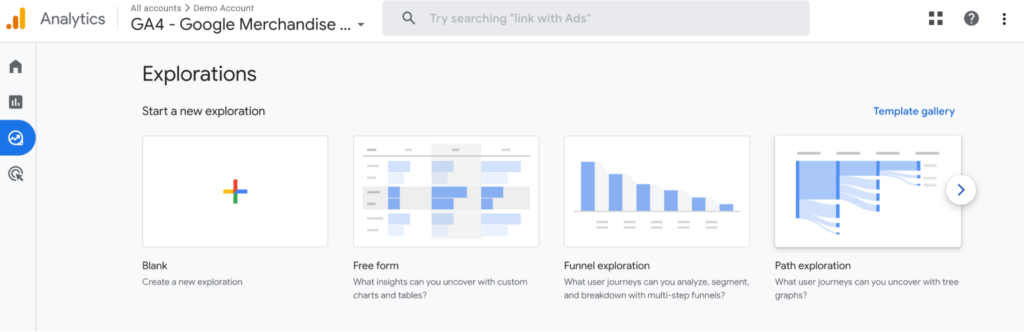
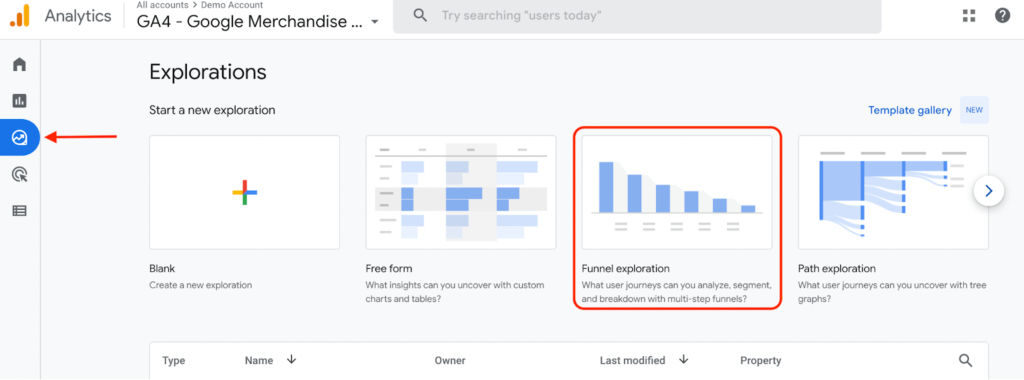
You can also click on “Explore” to create custom charts, tables, funnel reports, path explorations, and more.
Google Analytics’ biggest differentiators
GA’s biggest advantage has always been the fact that it’s free. No other analytics tool provides quite as many quantitative analytics capabilities for free.
Another benefit is that GA can also be easily linked with Google Ads and all other tools in Google’s ecosystem. This is a big plus for marketers looking to analyze the results of their campaigns (both paid and organic) in one place.
Smartlook
Smartlook is our combined product analytics and visual user insights platform that brings together four key features:
- Session recordings: Session recordings (or session replay) show you how users navigate your website or app — from the moment they open it to the moment they close it. This makes them a versatile tool that can help you analyze user behavior, provide customer support, debug, make product insights accessible to everyone in your organization, and more.
- Events: Like Mixpanel and GA, Smartlook can also track specific user interactions as events. However, Smartlook automatically indexes every user interaction in your site or app and lets you track events without coding. This removes the most tedious parts of the event tracking process.
- Funnels: Funnels let you analyze important user flows, like onboarding tutorials and checkouts. While Mixpanel and GA both have funnel analysis features, Smartlook also lets you watch the sessions of users who dropped off at a specific stage, so you can see points of friction that are hurting your conversions.
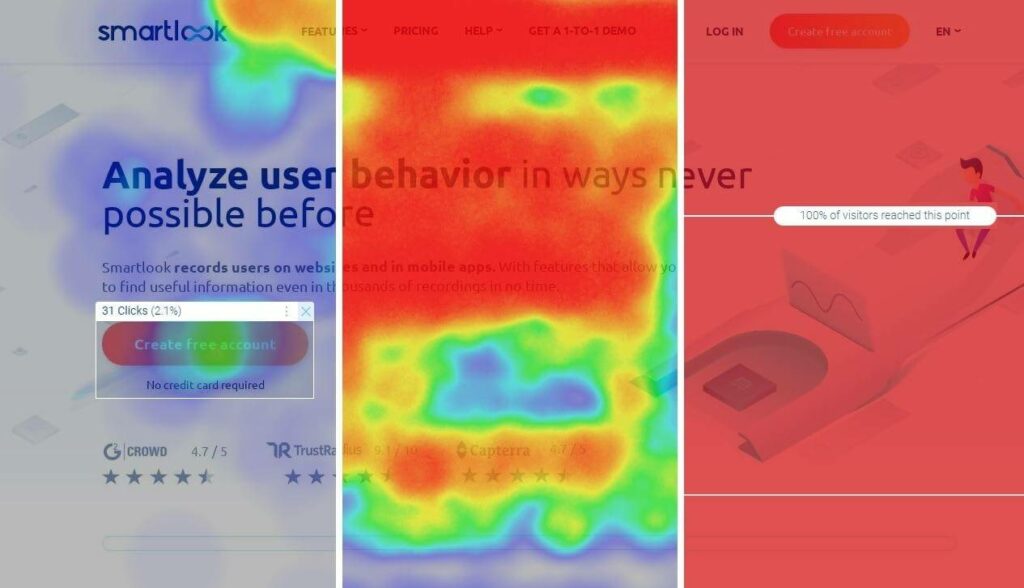
Heatmaps: Heatmaps give you a high-level look at how users typically navigate a page or app screen. Smartlook offers three types of heatmaps — click maps (left in the screenshot below), move maps (middle), and scroll maps (right). Again, this is something you can’t get with GA or Mixpanel.
Smartlook’s setup and workflow
Smartlook’s setup is super simple — you just need to install one code snippet and our platform automatically starts capturing every user interaction in your product.
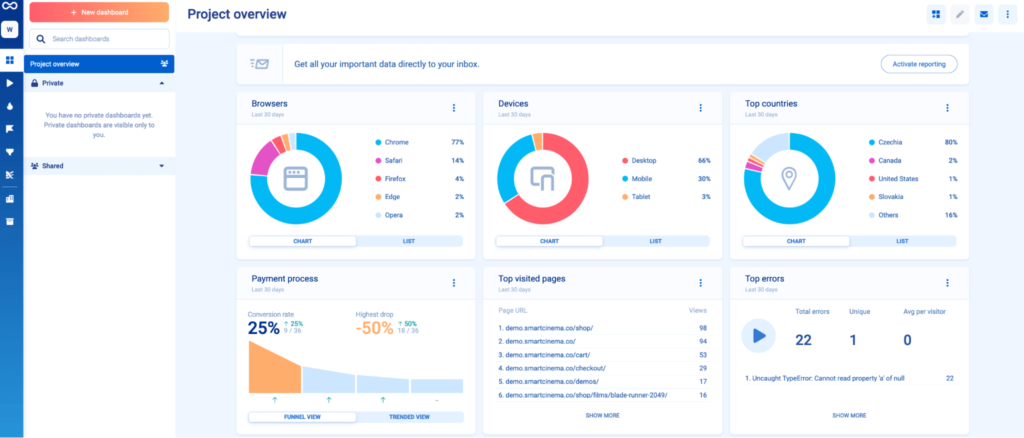
Once the snippet has been added, you can find all sorts of useful data in your dashboard. For instance, the dashboard below shows a site’s top visited pages, users’ devices, browsers, countries, and much more.
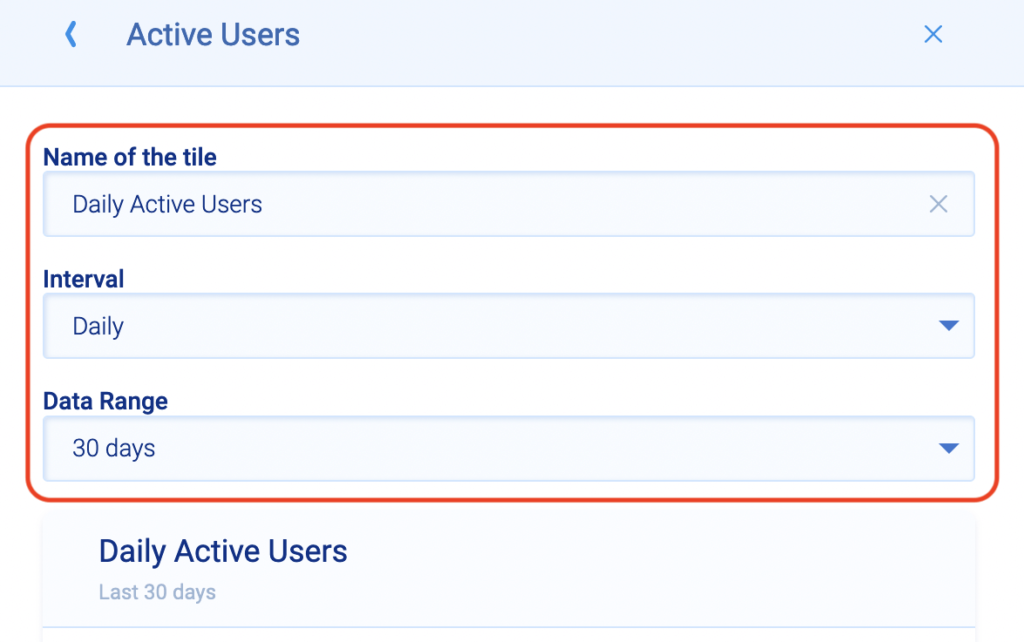
You can add or remove any of these tiles, depending on what’s relevant to your business. For example, say you have a mobile game and you want to track how many daily active users (DAU) you have.
You can click on “Add new tile”, go to “Active Users”, choose “Daily” as the interval, and select the data range you want to analyze (seven, 30, or 60 days).
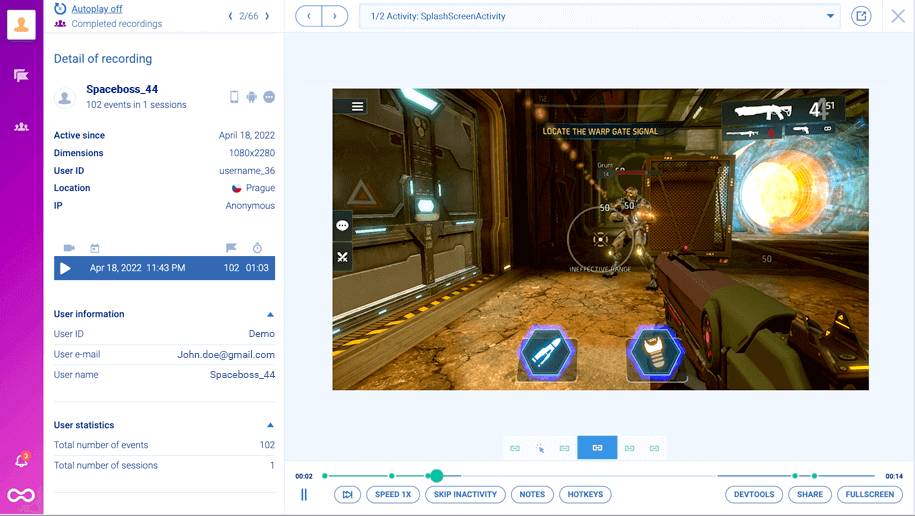
After setup, you can also start exploring Smartlook’s individual features by clicking on the small buttons on the far left. For example, clicking on the play icon will take you to all of your session recordings.
We have more detailed articles on how to use all of Smartlook’s features here:
- Our guide on tracking user activity on websites
- Our guide on setting up mobile app tracking to analyze user behavior
Smartlook’s biggest differentiators
Compared to Mixpanel and GA, Smartlook excels at combining quantitative data (i.e., stats and metrics) with qualitative insights from its session recordings and heatmaps.
This combination lets you track everything your users do, and more importantly, uncover why they do it — so you can improve your conversions, retention, and user experience.
Additionally, Smartlook’s auto-indexing of all user interactions and no-code event tracking make the setup and maintenance of our platform simple.
Once the code snippet is added, marketers and other non-technical teams can track endless interactions and understand user behavior without needing constant help from developers.
Here are four benefits of Smartlook’s versatile feature set that you can’t get with GA or Mixpanel:
- Watch exactly how users interact with your site or app. Again, Smartlook’s session recording feature lets you watch how users navigate your product. This is invaluable for marketers, UX professionals, and product teams looking to understand their users’ exact experience. You can also filter your session recordings based on various criteria like date, country, triggered events, funnel stages, and much more.
- Track users’ journeys as they move across your site and app. With Smartlook, you don’t have to use separate tools to track users on your site and mobile app. Instead, you can monitor the entire user journey in one place using our cross-platform analytics feature. This gives you a complete, accurate view of the entire customer journey and helps you eliminate data silos by keeping all behavior data in one place.
- Allow more teams to benefit from your analytics platform. A big downside to GA and Mixpanel raw stats and metrics is the fact that they require more data analytics skills to interpret. In contrast, anyone can watch a session recording and understand exactly what’s going on. This makes session recordings a powerful tool for many roles, including marketers looking to analyze user behavior, product managers looking to share their findings, support reps looking to quickly understand problems, and much more.
- Give a qualitative upgrade to your Mixpanel or GA data. While Smartlook comes with lots of useful quantitative data, you don’t have to use it as a replacement for Mixpanel or GA. In fact, we’ve built integrations for Mixpanel and GA, so you can have the best of both worlds. As a result, Smartlook can enhance your analytics stack by giving access to relevant session recordings right from your Mixpanel or GA dashboard.
Mixpanel, Google Analytics, and Smartlook’s overlapping features
Despite their big differences, Mixpanel, GA, and Smartlook have three key overlapping features: segmentation, event tracking, and funnel analysis.
While these features work differently in each tool, they ultimately provide product and marketing teams with very similar insights. The main difference is how they’re set up, as we’ll discuss below.
Segmentation
Segmentation is the process of grouping users together based on shared properties between them — like their devices, countries, events they’ve performed, and so on.
This is a key functionality for marketing and product analytics, so Mixpanel, Google Analytics, and Smartlook all offer it.
Mixpanel lets you segment all of its reports and analysis by events and user properties. For example, the screenshot below shows an Insights report for monitoring newly created accounts, broken down by device and platform.
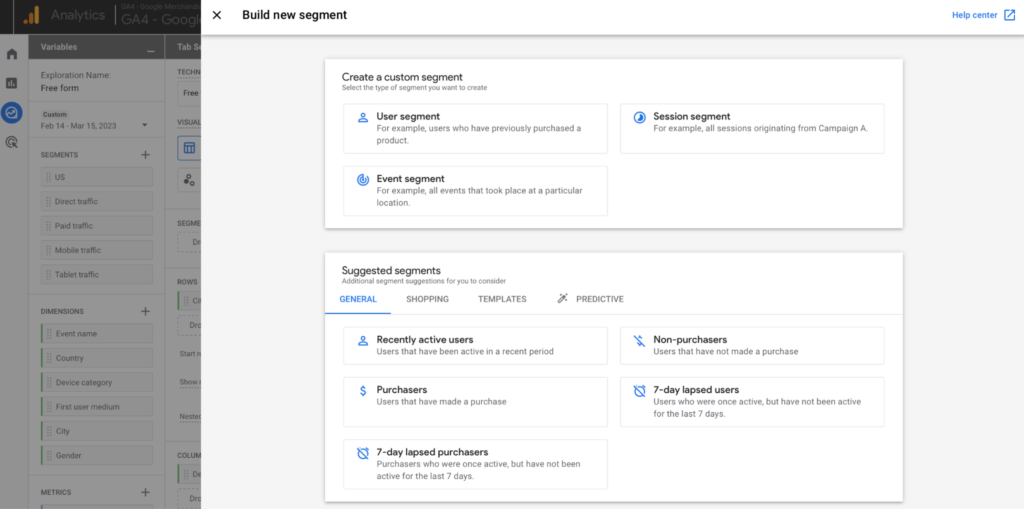
GA lets you create custom segments, while also giving you suggestions for some segments that may be useful for your analysis.
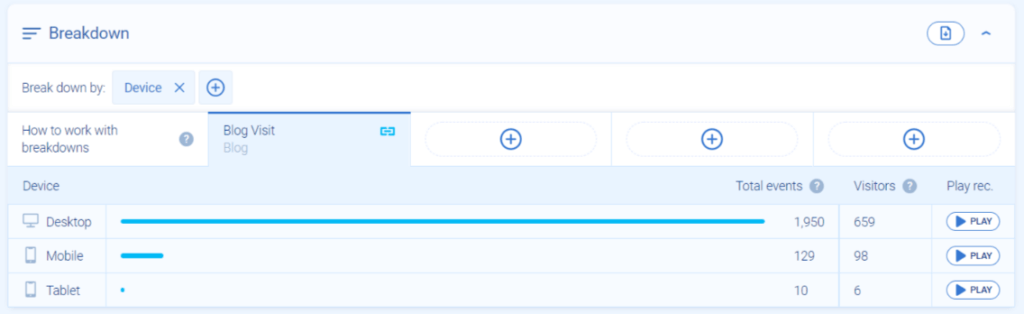
Smartlook’s segmentation works in a similar way to Mixpanel. You can break down each event you’re tracking by standard user properties — for example, country, device, and operating system, or a number of custom event properties (registered or unregistered users, type of subscription, product availability, and so on).
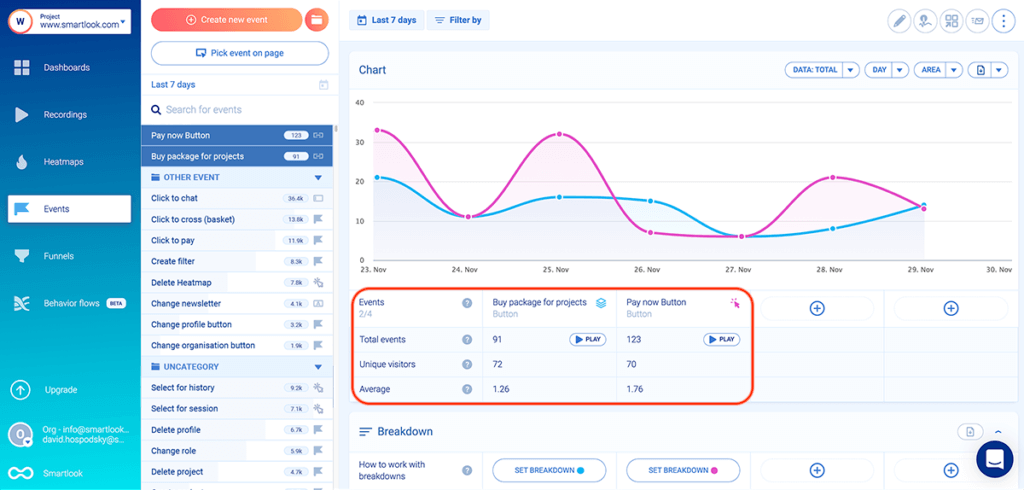
This is done by opening the event you want to break down, clicking on “Set breakdown” and choosing your criteria.
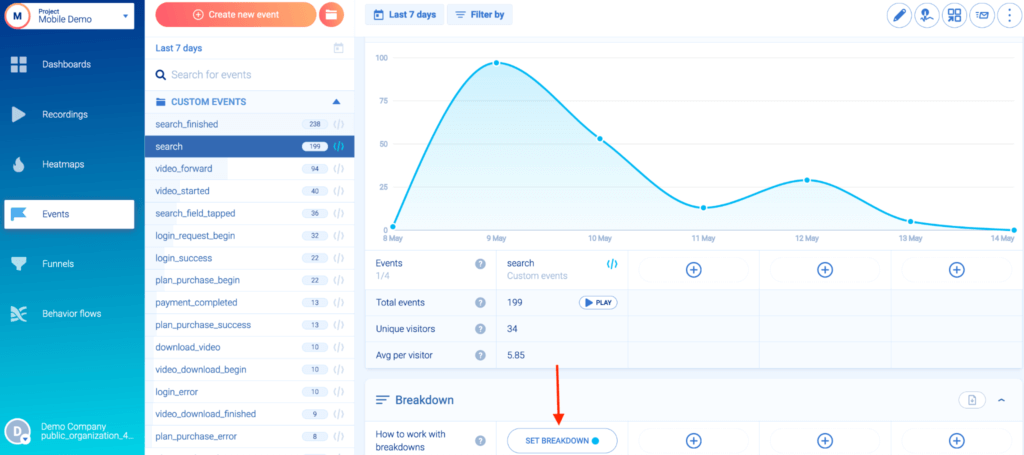
You can save any combination of events and properties as a user segment (e.g., new users from the UK with iOS devices who made an in-app purchase). Once saved, you can monitor this segment within your dashboard.
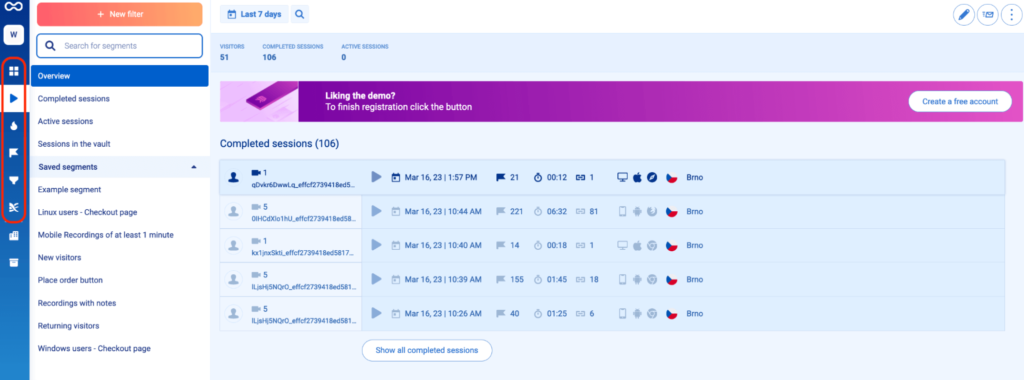
Finally, you can click on the “Play” button next to any segment to watch how users interact with your website or product.
Event tracking
As we said, events are individual user actions you can track over time. Like segmentation, event tracking is a must when analyzing user behavior, which is why you can find this capability in most product and web analytics tools.
Again, Mixpanel relies on manual event tracking. This means you need to decide which events you want to track and implement the tracking via code changes. The process is difficult and time-consuming but Mixpanel has detailed documentation for developers leading the implementation process.
For a long time, GA also relied mostly on manual event tracking. However, the new Google Analytics 4 (GA4) made some improvements in this area by moving to an event-based model and tracking more events automatically.
You can find your GA events by going to Reports → Engagement → Events.
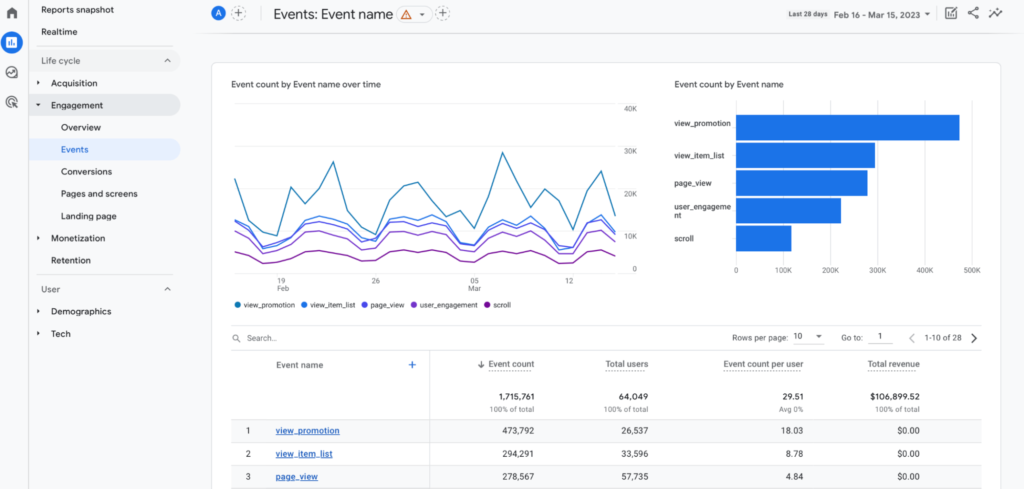
For more details on this topic, check our guide on how to track events in GA.
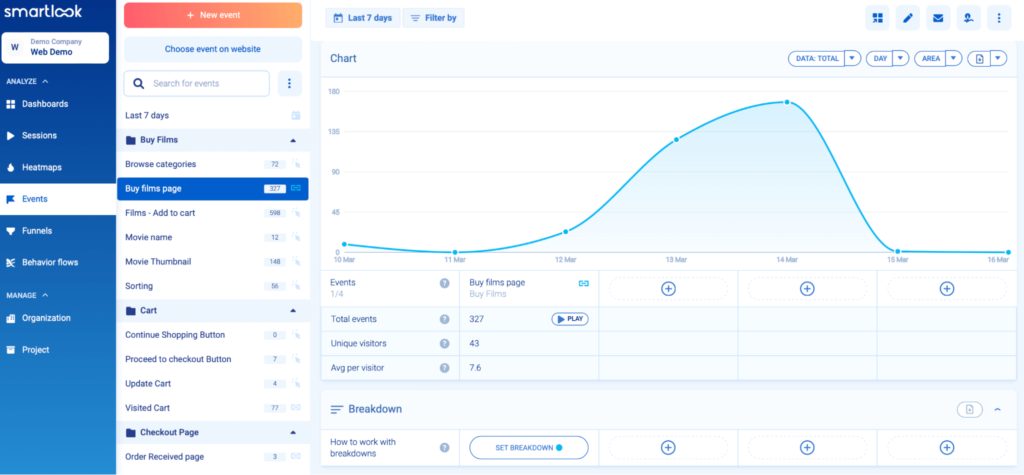
Smartlook indexes all user interactions on your site or app and lets you track key events without coding, as we showed above. Additionally, you can track custom events via JavaScript to monitor pretty much all other user interactions.
Smartlook can also detect anomalies in the occurrence of certain events and alert you when they occur.
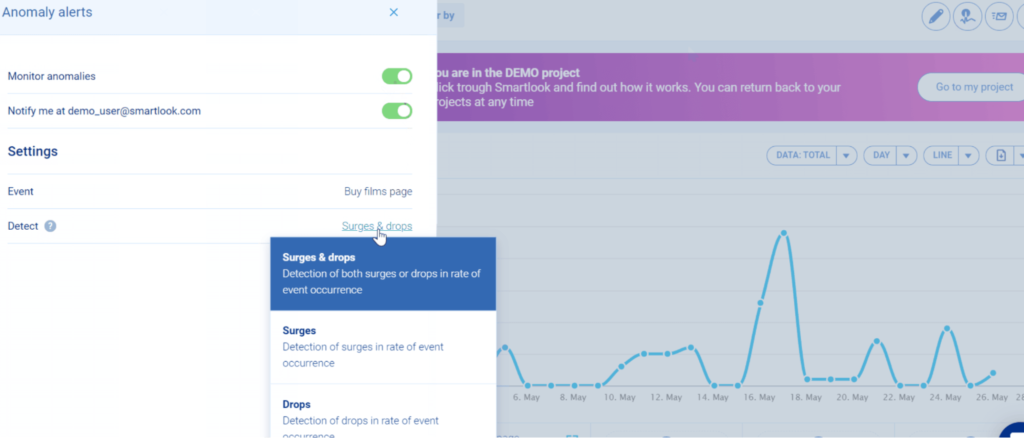
For example, say you have an e-commerce store and are tracking clicks on the “Add to Cart” button as events. With Anomaly Alerts, you can quickly get notified when there’s a sudden drop in the occurrence of this event (e.g., due to a bug in your site’s code) and fix the issue before it affects too many users.
Funnel analysis
Funnels are sequences of steps (events) users take to achieve a goal on your site or app. For example, funnels can map out onboarding tutorials, checkout flows, or any other sequence that leads to users completing a goal.
Mixpanel’s funnels can be built by selecting different steps and placing them in the order you believe users follow.
The same goes for GA — just click on “Explore”, go to “Funnel exploration”, and start building your funnels.
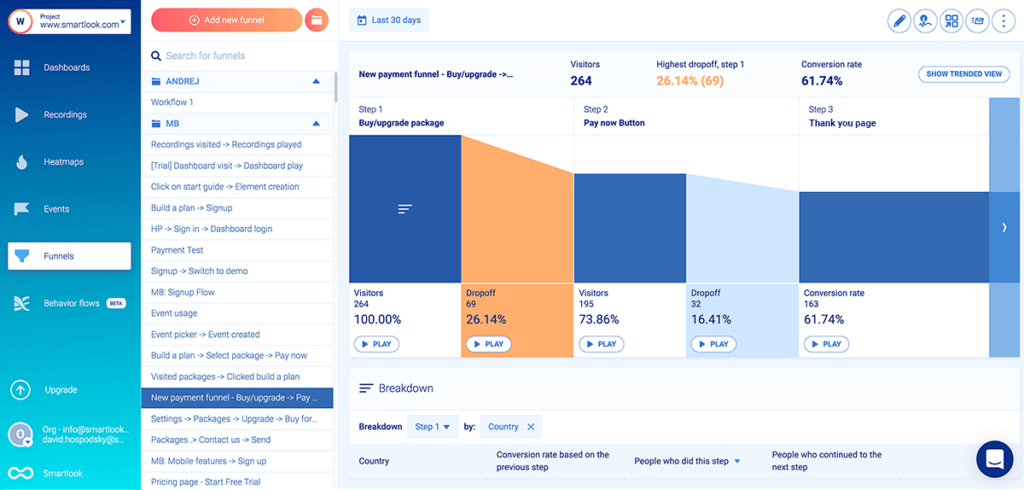
In Smartlook, you can also create a funnel by placing two or more events in the order you believe your users follow. For example, the screenshot below shows a visualization of a 3-step checkout funnel, with a 61.74% overall conversion rate.
Besides being able to see where users drop off in this flow, you can also watch their session recordings to find out why. This capability is vital for finding and eliminating points of friction that hurt your conversions.
For example, AstroPay — a fintech SaaS company and Smartlook customer — used this capability to improve the conversion rate of one of its key flows by 56%.
The ability to combine funnel analysis with session recordings is a massive benefit over Mixpanel or GA’s quantitative data. Without being able to watch users who drop off from your funnels, it often takes months of testing to understand why drop-offs occur and improve your conversions.
Mixpanel vs Google Analytics vs Smartlook: Pricing comparison
Pricing is the last big differentiator between Mixpanel, GA, and Smartlook.
Before diving into the details, it’s worth noting that GA is essentially free for the vast majority of its users. There is a paid version called Google Analytics 360 but it’s only for enterprise businesses, so we won’t focus on it below. Instead, we’ll only compare Mixpanel and Smartlook’s pricing.
Mixpanel’s pricing
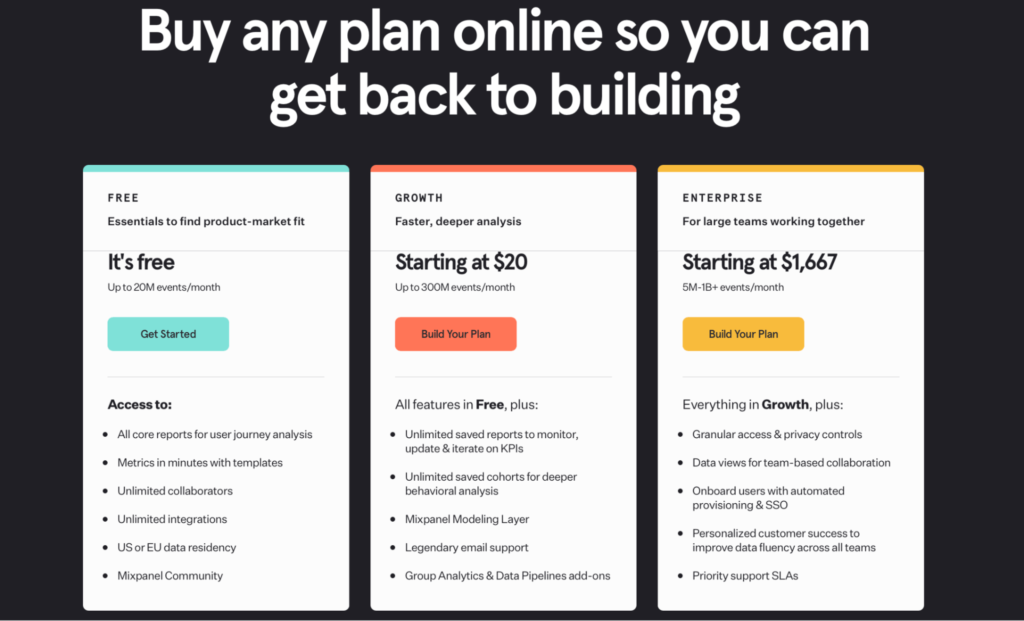
Mixpanel offers three plans:
- Free, for up to 20 million monthly events. This plan doesn’t include access to Mixpanel’s biggest differentiators, like its Impact and Signal reports.
- Growth, starting at $20/month. This plan is customizable depending on the number of events you want to track. For example, tracking one million monthly events would cost you $116/month if you pay monthly or $996/year if you pay annually.
- Enterprise, starting at $1,667/month. This plan includes everything in Growth and also adds Signal reports, granular access and data controls, priority support, and other advanced features.
It’s also worth noting that Mixpanel upsells two features as add-ons — Data Pipelines (20% of base plan) and Group Analytics (40% of base plan).
Data Pipelines allows teams to easily export information from Mixpanel to data warehouses like BigQuery and Snowflake. Group Analytics lets product teams track behaviors and metrics like usage and retention at the account or company level.
Smartlook’s pricing
Unlike Mixpanel, Smartlook’s pricing is based on monthly user sessions, not tracked events. This means you don’t have to guess or calculate how many events you’ll need to track before building the best plan for you.
Smartlook offers three flexible plans for companies of all sizes — from startups to mid-sized and enterprise businesses.
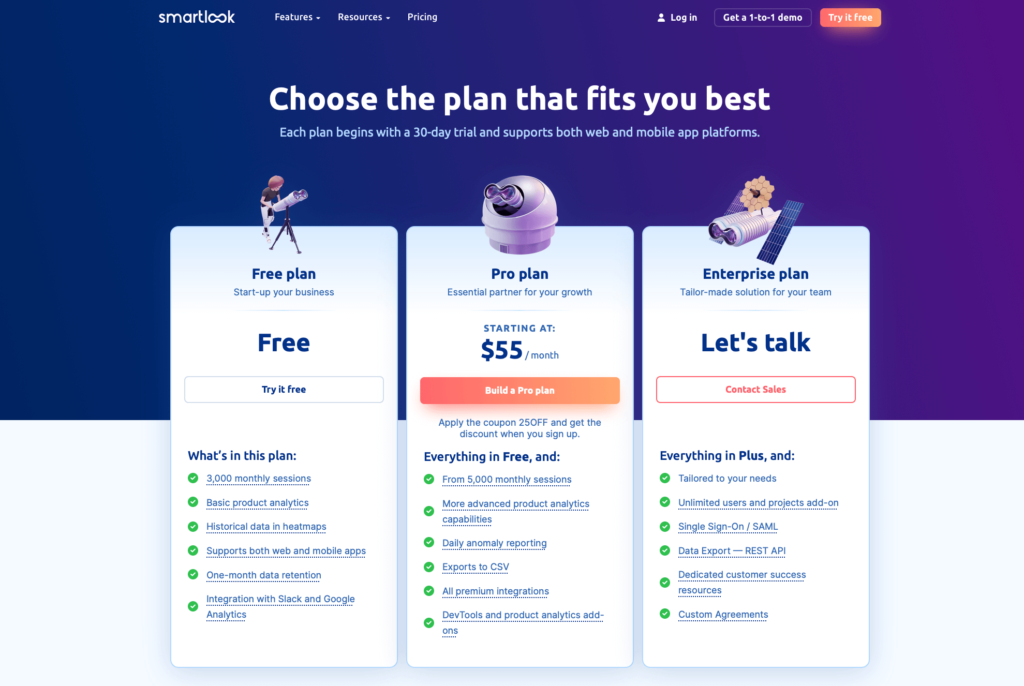
- Free, for websites and apps with up to 3,000 monthly sessions. This free version includes Smartlook’s four core features — session recordings, heatmaps, events, and funnels — and doesn’t have a time constraint.
- Pro, starting at $55/month for 5,000 monthly sessions. Besides the higher session limit, this plan offers a longer data history, more events, funnels, and heatmaps, and additional integrations with tools like Slack, Jira, and Zendesk. You can also build a custom Pro plan by changing the number of monthly sessions yourself.
- Enterprise, which is fully tailored to your needs. This plan is for websites and apps with over 50,000 monthly user sessions and is created by our team for each individual customer.
All Smartlook accounts start with a full-featured, 30-day free trial — no credit card required.
Make the most out of your analytics tech stack with Smartlook
Smartlook gives you robust analytics that show what your users are doing — paired with session recordings and heatmaps that show why — all in one place.
If you’re already using GA or Mixpanel, integrating Smartlook can give you the necessary context to understand user behavior.
Alternatively, many teams find that Smartlook provides all the quantitative analytics capabilities they need. At the same time, the qualitative insights from session recordings and heatmaps empower more of their team members to understand users’ behavior.
If you want a more in-depth presentation of Smartlook that’s tailored to your business (without having your team set it up), schedule a live demo with our team.
To give Smartlook a go yourself, sign up for a full-featured, 30-day trial — no credit card required.