Microsoft Clarity and Smartlook are two of the most popular heatmap and session recording tools.
But while they have a similar setup and overlapping features, they’re very different solutions. Clarity is only a session recording and heatmap tool, while Smartlook combines these two features with other quantitative analytics capabilities.
In this article, we’ll explore how Clarity and Smartlook’s differences affect what you can do with each tool. We’ll also show you where both tools overlap and when to choose one over the other.
Before we dive into the details, here’s an overview of the most important differences:
- Clarity can be used only on websites, while Smartlook is available for both websites and native mobile apps. Smartlook has SDKs for many mobile app platforms, frameworks, and engines, like iOS, Android, React Native, Flutter, and Unity.
- Clarity has only two features (session recordings and heatmaps) while Smartlook offers a variety of behavior analytics features. Like Clarity, Smartlook also has session recordings and heatmaps. However, Smartlook combines them with quantitative analytics features like events, funnels, and behavior flows. These features help you quantify user behavior, calculate conversion rates, and much more. Overall, Smartlook’s combination of features plus its integrations allow it to support the use cases of more teams (including product, digital marketing, UX, customer support, and development).
- Clarity is a free product, while Smartlook is a paid SaaS tool with a free version and free trial. Clarity is a simple, but limited free tool. This makes it ideal for freelancers or small teams who are just getting started with behavior analytics or can’t justify the purchase of a paid tool yet. While Smartlook isn’t free, its key features are available in the free version and in the 30-day free trial. Plus, Smartlook has paid plans ideal for larger teams with more advanced use cases.
Now we’ll dig into the details and explore the kind of insights you can get with each tool. Here’s what we’ll cover:
- Clarity and Smartlook’s overlapping features
- Clarity vs. Smartlook: The essential differences
- The final verdict: Microsoft Clarity vs Smartlook
Want to start analyzing user behavior on your website or mobile app as soon as possible? Start a free 30-day trial of Smartlook. You can also book a live demo with our team to get a free presentation that’s tailored to your business.
Clarity and Smartlook’s overlapping features
Clarity and Smartlook can be considered qualitative analytics solutions since they both offer heatmaps and session recordings.
While Smartlook is much more than a qualitative analytics tool (as you’ll see later), we’ll first look at what you can do with these two features.
Heatmaps
Heatmaps provide an overview of the typical user experience on a page, including where users click, how far down they scroll, and where they move their cursors.
Smartlook and Clarity, as well as most other heatmap software tools, support three different types of heatmaps — click maps (left in the screenshot below), move maps (middle), and scroll maps (right).
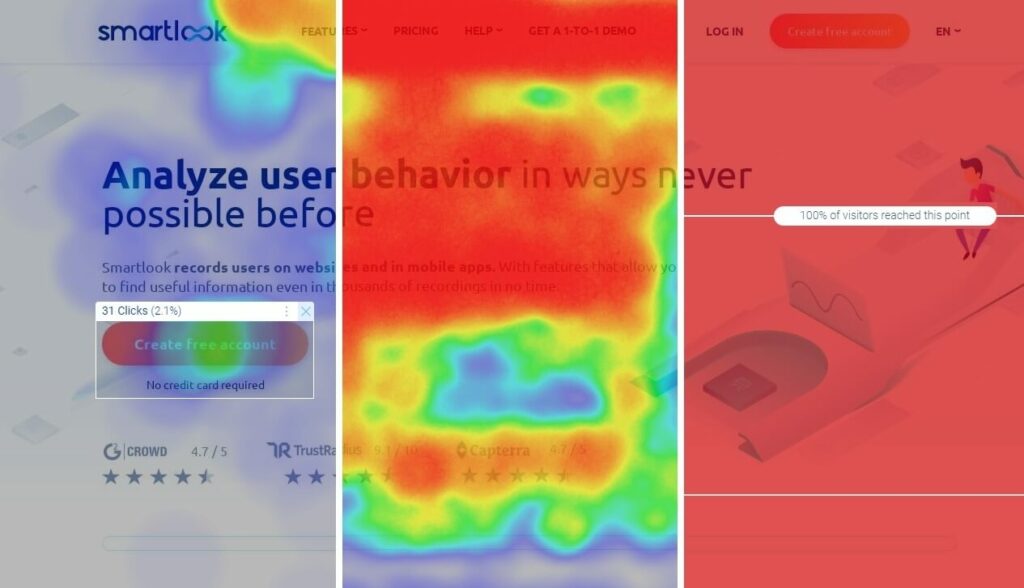
Each one provides different information about your users’ behavior. If you want to learn how to use them, check out our detailed guide on how to read a heatmap and get actionable UX insights.
Additionally, Clarity and Smartlook both let you generate heatmaps for each website page and filter them based on the device (desktop, mobile, or tablet), visitor type (new vs. returning visitor), and other conditions (country, browser, referrer URL, etc.)
Lastly, Clarity offers one more type of heatmap, called Area map, which displays the total number of clicks in an area you select.
Smartlook doesn’t have a separate heatmap for this. However, you can do the same thing by simply opening a click map and selecting an area, as shown in the GIF below.
Session recordings
Session recordings(also called session replay or session playback) let you watch visitors’ entire sessions on your website or mobile app — from the moment they open it, to the moment they close it.
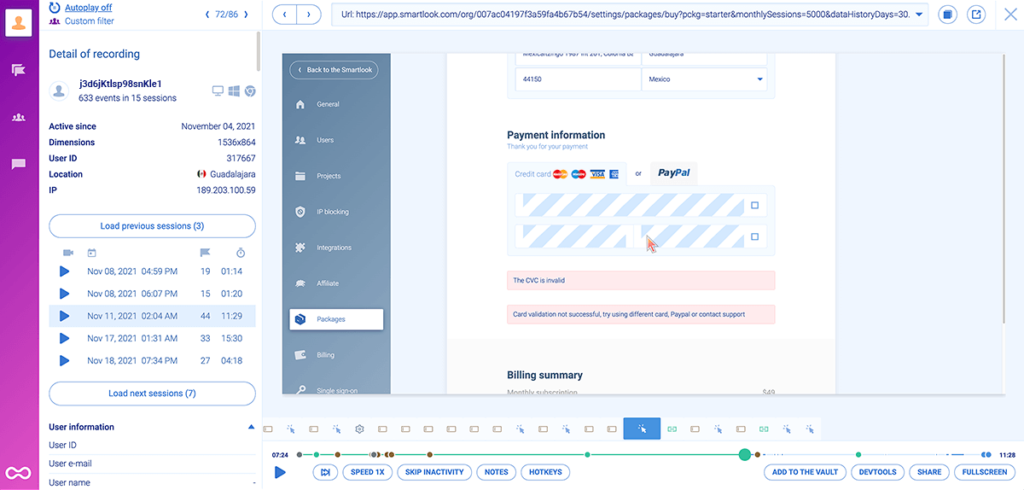
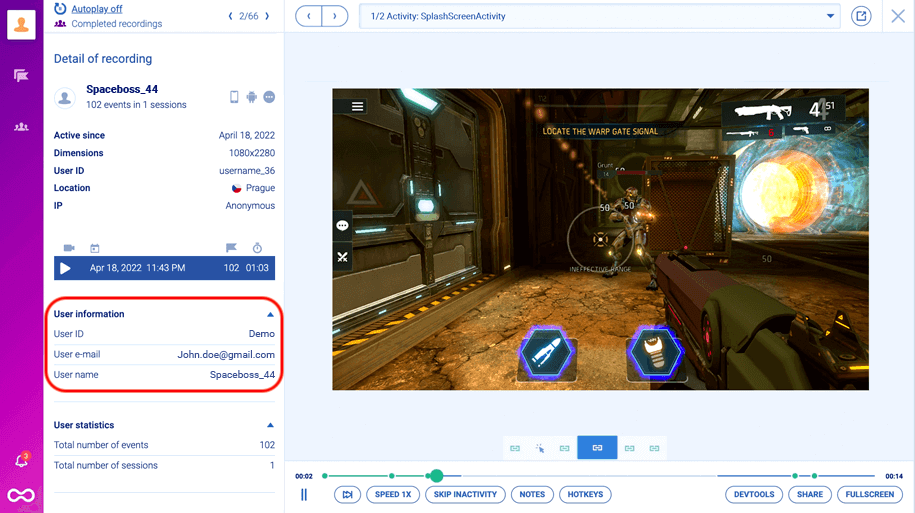
This means you can see each mouse movement, scroll, click, and tap (on mobile) during the user journey. Plus, Smartlook and Clarity both provide additional details with each session recording, like the user’s device and location, as you can see in the Smartlook session recordings below.
Because they show you people’s exact experiences, session recordings are a powerful tool for empathizing with users, improving your conversion rates, debugging, and much more.
To learn how to take full advantage of them, check out our guide to recording website visitors.
It’s also important to note that Smartlook and Clarity capture every user session on your site by default. This means you don’t have to worry about manually starting and stopping their recorders. You just install one code snippet and all your user sessions get captured automatically.
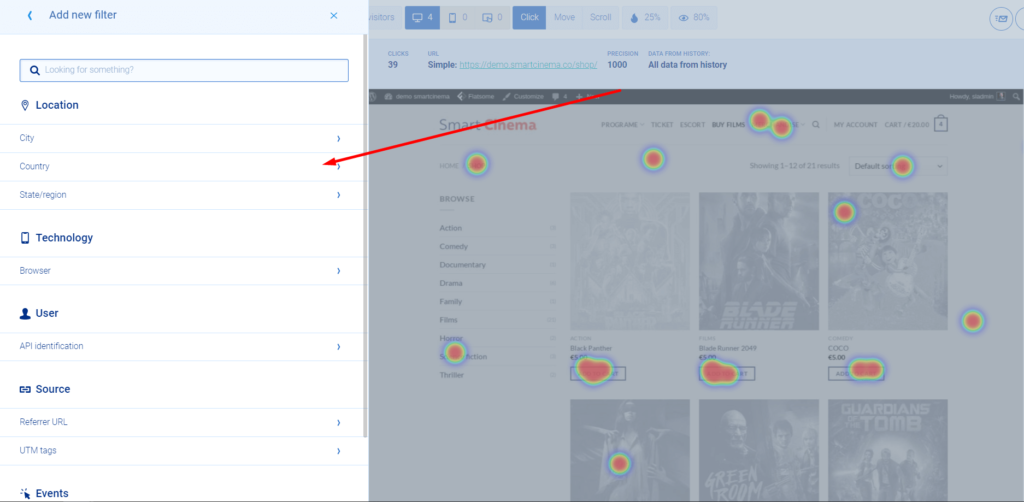
Both tools offer a similar set of filters for finding relevant sessions fast.
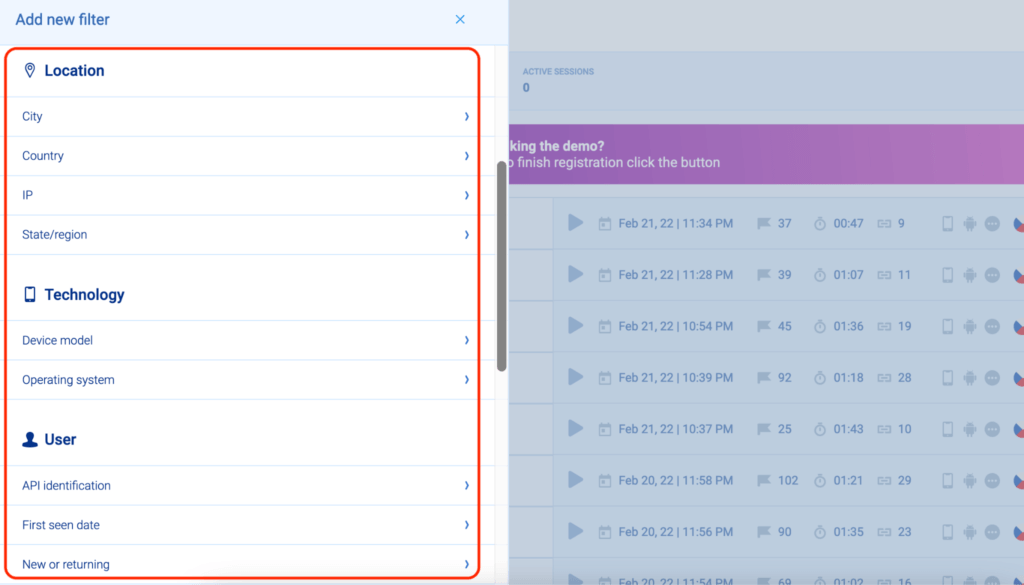
There are technology-based filters (like device and operating system), location-based ones (like country and city), user action filters (like rage clicks or page visits), and more.
Clarity has a few more preset user action filters than Smartlook, like dead clicks and excessive scrolling.
However, Smartlook lets you filter session recordings based on events that took place in them and based on funnel stages, which you can’t do with Clarity. We’ll discuss why that matters in the next section, but if you’re interested, feel free to skip ahead.
Both tools’ session recordings are also private by default.
This means they automatically don’t record sensitive data like credit card information or passwords. Additionally, you can mask or exclude any element that shouldn’t appear in the session replays.
Lastly, if you want to learn how Clarity and Smartlook compare to other session recording solutions like Hotjar, FullStory, Crazy Egg, and Mouseflow, check out our article on the top session replay and visitor recording tools.
Clarity vs. Smartlook: The essential differences
While they overlap in the session recording and heatmap category, Clarity and Smartlook are very different tools.
Clarity is only a session recording and heatmap tool for websites. It’s simple to use but limited as it offers two features and supports two integrations (Google Analytics and Google Optimize).
Smartlook, on the other hand, combines its session recordings and heatmaps with other useful analytics features, like:
- Events, which allow you to monitor the occurrence of user actions — e.g. button clicks, text inputs, page visits, and so on — over time. You can use events to quantify user behavior, evaluate the impact of changes on your site, filter session recordings, create user segments, and more.
- Funnels, which let you map out important user flows, like checkouts or onboarding completions, and analyze how users navigate them. Smartlook’s funnels calculate the conversion rate for these flows automatically and show you where most users drop off. These drop offs represent missed opportunities, and Smartlook’s revenue insights feature can even calculate the amount of money those drop-offs are costing you. To see why users drop off and improve your conversion rate, you can click into the session recordings of users at each drop-off point.

This mix of qualitative and quantitative analytics features gives product and marketing teams access to many more powerful and actionable insights. In the next sections, we’ll show you five ways you can use this feature set to improve the customer experience, boost conversions, speed up debugging, and more.
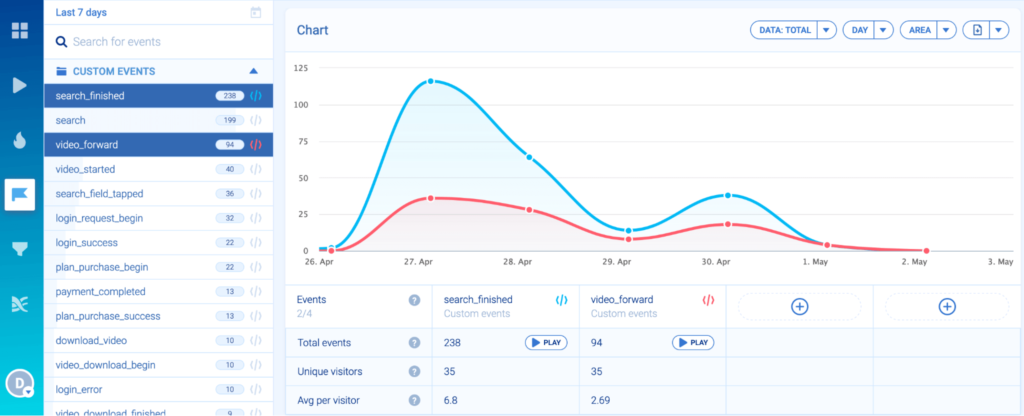
#1 Monitor business-critical user interactions with event tracking
Again, events are user actions that you monitor over time, like:
- Text inputs in your site’s search bar.
- Clicks on important call-to-action (CTA) buttons.
- Visits to your “Thank you” page that confirms a successful purchase.
You can use events to track user activity on websites, quantify customer behavior, and determine the impact of certain changes.
For example, say your marketing team is tasked with increasing the clicks to the “Try for free” button on an important landing page.
First, they can create an event to monitor the current button clicks and establish a baseline. Then, once they make changes (e.g., new button color, copy, and placement), they can analyze the occurrence of this event. This will allow them to determine if their changes led to more clicks, which can’t be done with Clarity.
Smartlook also makes event tracking easy since you don’t need to write any code to track most user actions.
The process of selecting which actions to track as events (called “defining an event”) is done by selecting from a list of template events or simply clicking on your site’s UI, as shown in the screenshot below.
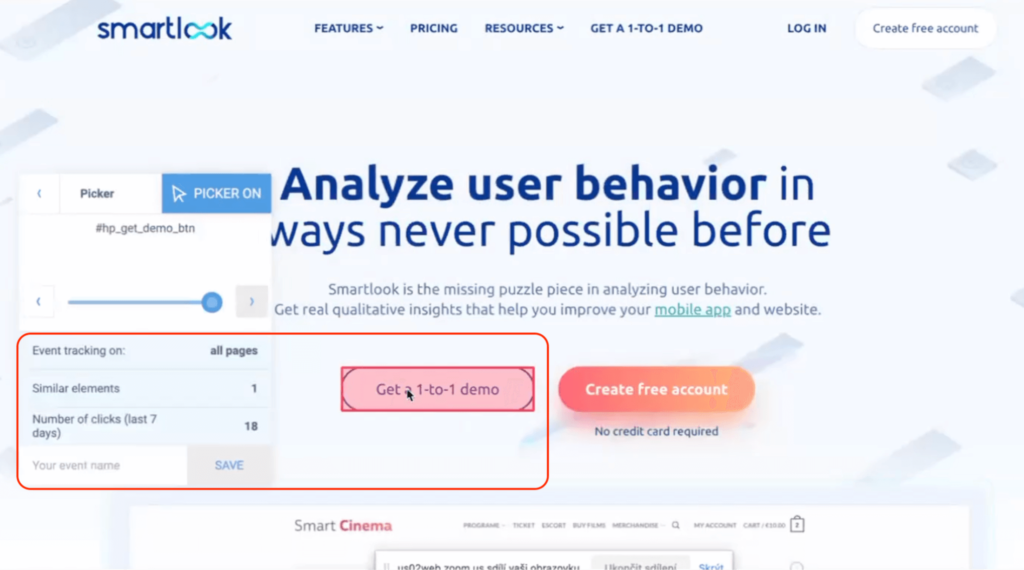
Plus, you can also define custom events via JavaScript to monitor pretty much anything else outside of the standard events.
Lastly, note that you can always watch the sessions in which users triggered a certain event by clicking on the “Play” button under the event name.
This functionality is useful for two reasons:
- It helps you find relevant recordings much faster.
- It shows you what users do before and after triggering an event so you can get the full context behind their actions.
#2 Calculate conversion rates and track how users navigate key flows with funnel analysis
Like events, funnels are a classic web analytics tool for understanding the customer journey.
Funnels are sequences of steps users take to complete a goal, like:
- Buy a product.
- Sign up for a newsletter.
- Finish an onboarding tutorial, and so on.
Building and analyzing funnels helps you understand how users navigate these flows and find points of friction that affect your conversions.
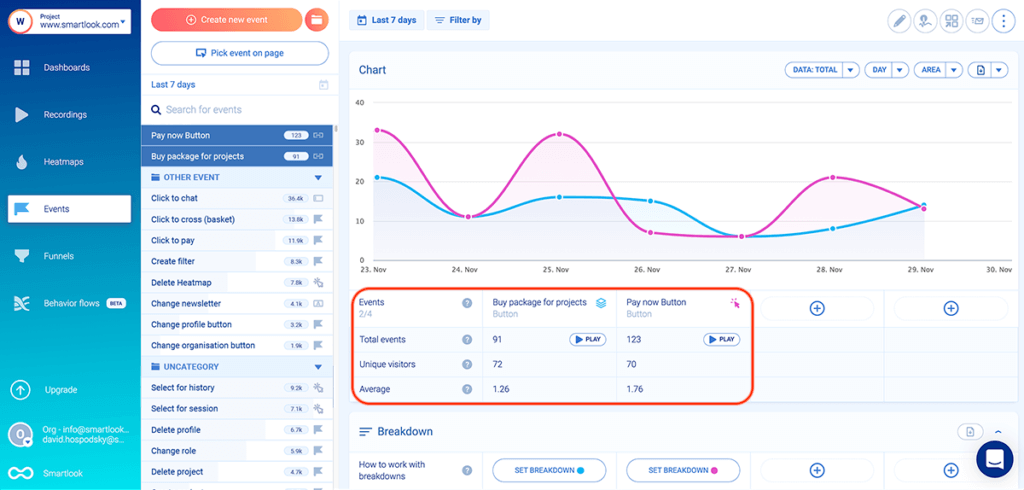
In Smartlook, creating a funnel is as simple as placing two or more events in the order you believe your users follow. Then, our tool automatically calculates the overall conversion rate, as well as the drop-offs between each step.
For example, the three-step checkout funnel below has an overall conversion rate of 61.74%, with most drop-offs (26.14%) coming between Steps 1 and 2.
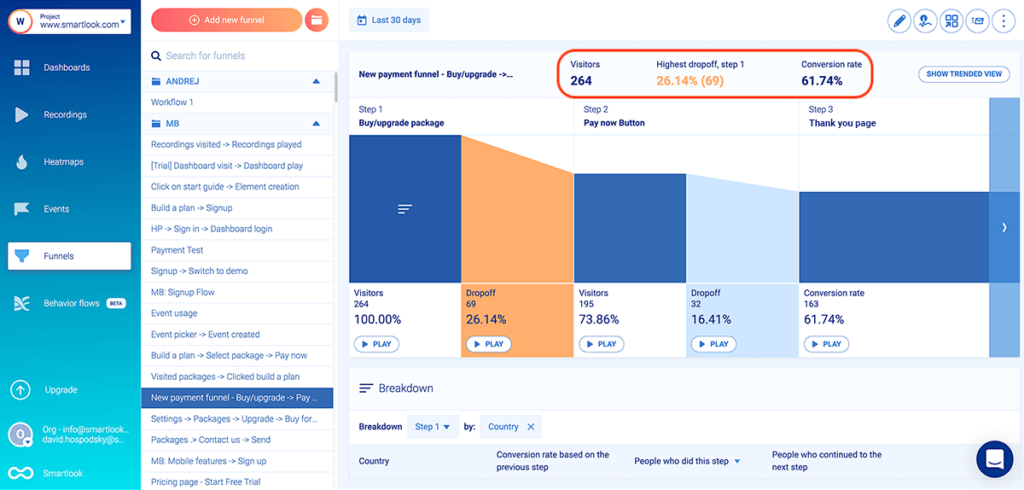
This conversion funnel can be built with three events without any coding:
- Event 1: Visitors click on “Add to cart” (you can select the button with our no-code event picker to define the event).
- Event 2: They click on the “Pay Now” button (again, you can select that button with the no-code event picker).
- Event 3: They land on the “Thank you” page (you can use the “Visited URL” standard event and enter the page URL).
Again, Smartlook’s revenue insights feature can show you the monetary value of your conversions at each step of the funnel.
You can expand your analysis of any key flow by breaking down the funnel by country, device, browser, and other criteria.
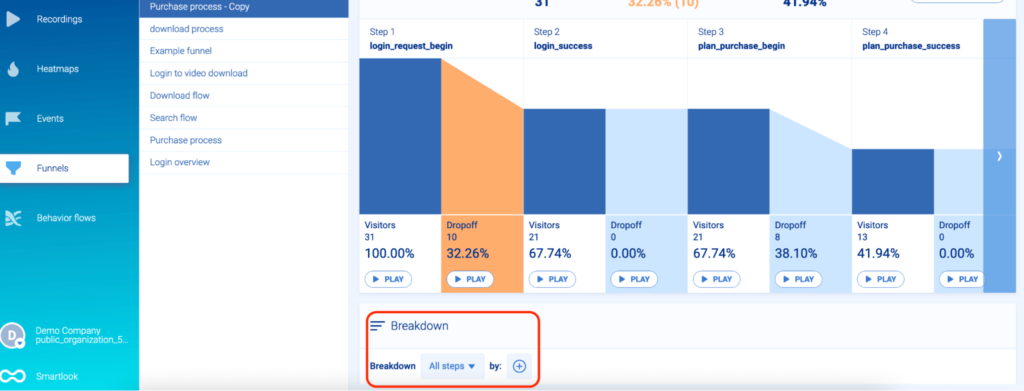
Breakdowns can help you uncover insights into how different types of users navigate important flows.
For example, a breakdown can show you that Android users from Asia convert at a much lower rate than others. This may indicate that your site is loading too slowly for them or that some elements aren’t rendered correctly.
Again, Clarity doesn’t have a funnels feature, so if you want to analyze user flows and calculate conversion rates, you need to use another tool.
#3 Find out why users don’t convert by combining funnel analysis with session recordings
The biggest benefit of using funnels is that you can see where users drop off in certain flows. However, that still leaves you with the question of why they did so.
This is where having a tool that combines session recordings with funnels is invaluable. With Smartlook, you can watch the sessions of users who dropped off at a specific stage of your funnels to see why that happened.
Let’s use the funnel from the previous section as an example.
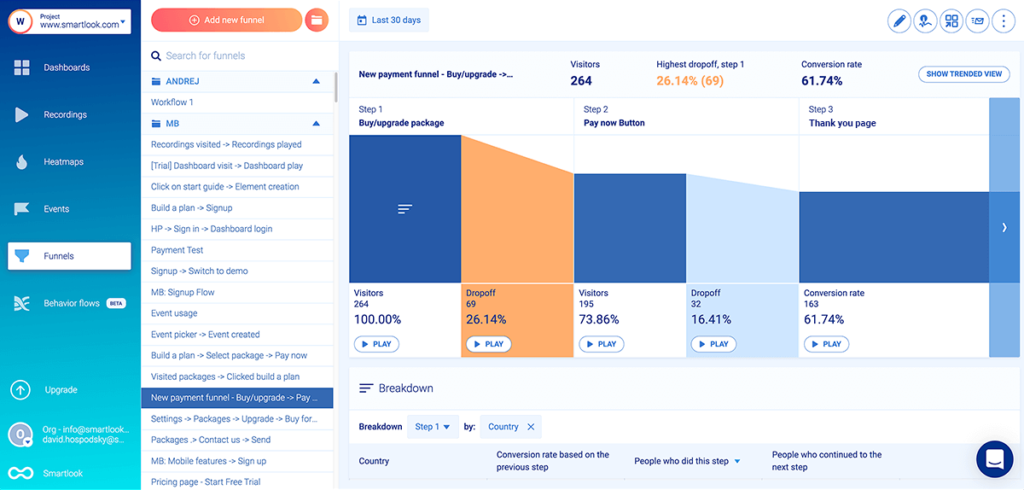
This funnel has a serious issue — 32 users (16.41%) drop off between clicking the “Pay now” button and reaching the “Thank you” page. This shouldn’t happen, since users who clicked on “Pay now” clearly want to buy and should be able to check out successfully.
But oftentimes, various issues like broken buttons or other bugs prevent them from doing so. With Smartlook, you can simply click on the “Play” button under the drop-off to access all relevant session recordings.
It’s worth noting that you can do a similar analysis with Clarity and Google Analytics (GA). However, the process is much more time-consuming.
First, you need to build your funnels in GA and wait for enough data to be collected. Then, you can see which step in the funnel leads to the most drop-offs. Lastly, you have to open Clarity and watch the sessions of all users who went through that step.
While this might work when you have a handful of visitors, it gets increasingly tedious as your traffic grows because you don’t have a quick way of finding the sessions of users who dropped off, like with Smartlook.
#4 Speed up debugging
Debugging is one of the most underrated use cases for session recordings.
Because they show exactly what happened before a bug, session replays make it much easier for development and quality assurance (QA) teams to understand each problem.
This is a big benefit of session recording tools in general, including Clarity and Smartlook. However, Smartlook takes things further with our:
- Identify API: When this API is set up, you can locate users’ session recordings based on an identifier, like email or username. As a result, when an identified user reports a bug, you can instantly find their sessions, see what went wrong, and escalate to the dev team, if necessary.
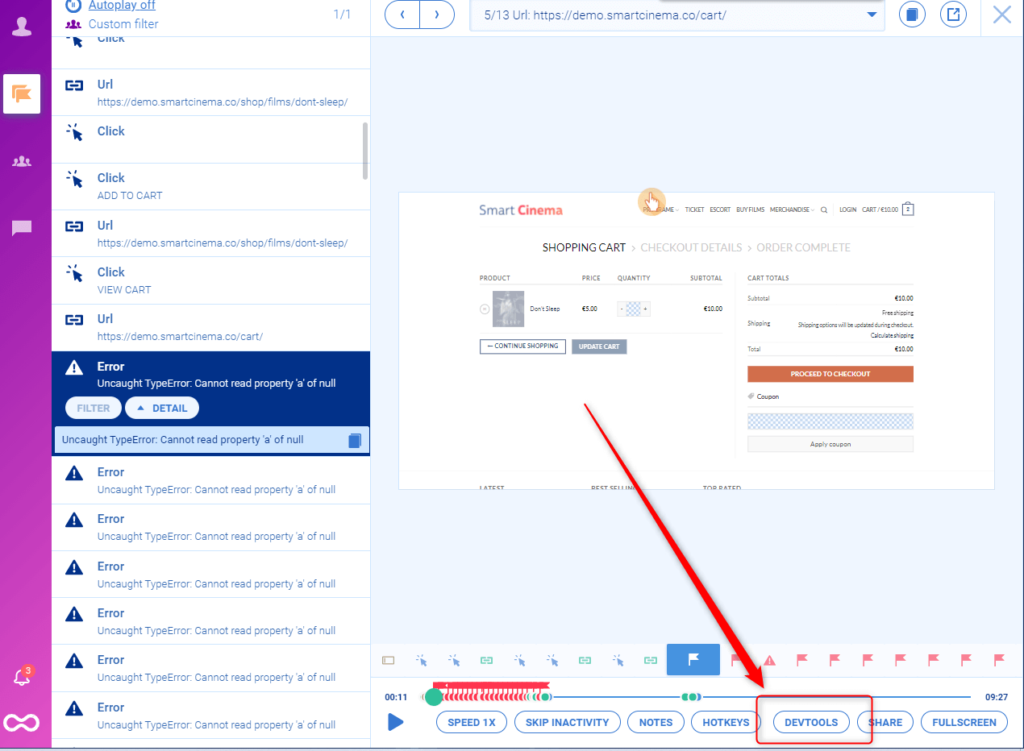
- Devtools panel: This feature lets you see all assets, requests, or logs that happened during a user session. Put simply, while the session recording visualizes how users interact with page content, the Devtools panel replicates all the information their browsers processed, including errors, logs, warnings, media, script downloads, and more. This information often lets developers and QAs skip reproduction entirely because they can instantly see what went wrong.
#5 Integrate with other tools in your stack
Integrations are an important aspect of all analytics tools since they make it easier for teams to implement them into their current workflow.
As we said, Clarity only integrates with Google Analytics and Google Optimize. While Smartlook integrates with those two tools as well, it also supports integrations with other A/B testing solutions, analytics platforms, CRMs, and much more.
Here are three of our most widely-used integrations and how you can take advantage of them:
- Survicate: Survicate is a tool that lets you collect user feedback via surveys and feedback widgets. When you integrate it with Smartlook, you can filter session recordings based on users’ responses. For example, say you ask visitors to rate their checkout experience from 1 to 5 after completing it. If some of them give a low score without elaborating further, you can open their session recordings in Smartlook and try to see what went wrong.
- Mixpanel: Mixpanel is one of the most popular product analytics tools on the market. But despite its popularity, Mixpanel has a blindspot — it’s focused entirely on quantitative data. The lack of qualitative insights makes it difficult to understand why users do what they do and improve their experience. To overcome this problem, teams can integrate Mixpanel with Smartlook and go beyond the raw numbers thanks to our session recordings.
- Sentry: Sentry is an application monitoring and error tracking software. Like Mixpanel, Sentry doesn’t offer session recordings, which makes it difficult to understand exactly how bugs occurred. The Smartlook integration fixes that and makes bug reproduction much easier by allowing teams to access links to session recordings directly from Sentry.
Again, Smartlook supports many other integrations, so check out our Help Center for the full list.
The final verdict: Microsoft Clarity vs Smartlook
Now that we’ve covered the main features and differences, let’s finish by discussing when Smartlook can be a better choice than Clarity and vice versa.
Clarity’s advantage: A free, simple product
Clarity has one big benefit over all other session recording and heatmap tools — it’s completely free. It’s also built on top of an open-source library, so you can actually see the Clarity code on GitHub.
Clarity’s simplicity makes it a great entry point for people who are new to session recordings (or website analytics in general) and just want to get a feel for the typical visitor’s experience on their site.
However, this simplicity comes at a price, since Clarity doesn’t have any quantitative analytics features. As a result, you’ll need to another tool if you want to:
- Monitor important interactions, like clicks on the “Add to Cart” button or other important CTAs.
- Calculate conversion rates for key flows and analyze how changes affect conversions. For example, a key flow for a cybersecurity product like NordVPN might be to track how many people create an account, add the extension to their browser, and start using it. With Clarity, there’s no way to analyze this flow’s conversion rate, find the session recordings of users who dropped off, or measure how changes impact completions.
- Find the session recordings of users who drop off between two specific funnel steps. Say you have an e-commerce store and create a funnel that shows you that some percentage of users drop off between clicking the “Confirm order” button and landing on the “Thank you page”. In theory, this drop-off shouldn’t happen, so it’s crucial to have some way to zero in on these users’ sessions and see what went wrong.
Due to these limitations, you’ll likely need to supplement Clarity with tools that have more options for analyzing visitor behavior as you progress in your analytics journey.
Smartlook’s advantage: More features, supported platforms, and potential use cases
As we said, Smartlook offers both of Clarity’s features (session recordings and heatmaps), while adding many other capabilities on top of them.
This makes Smartlook useful in many situations where Clarity can’t help. For example:
- You can use the event tracking and funnel analysis features to quantify user behavior, calculate conversion rates, and find out why users drop off, and calculate how much those drop-offs are costing you, as we showed above.
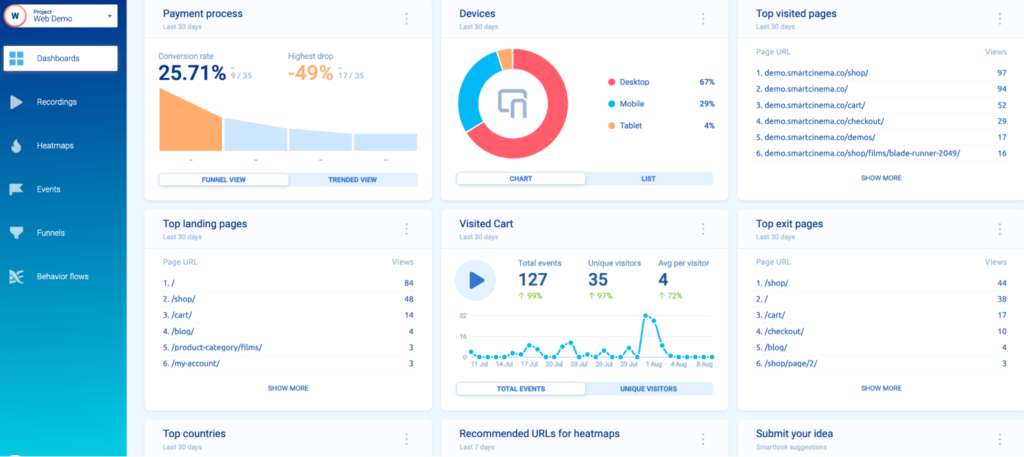
- You can keep track of key quantitative stats and metrics in your dashboard. For example, the dashboard below contains information about the conversion rate of a checkout funnel, the most popular devices among users, the top visited pages, and more.
- You can create multiple private or shared dashboards with different information for each team or stakeholder.
Overall, Smartlook’s combination of features is ideal for teams who need a more advanced behavior analytics tool, with both qualitative and quantitative capabilities.
Plus, Smartlook’s versatility means that different roles inside an organization can take advantage of the platform. This includes marketers, product professionals, UX designers, customer support agents, developers, and QAs.
Lastly, while Smartlook isn’t free like Clarity, we do offer a free version for websites and mobile apps with up to 1,500 monthly user sessions.
This version includes the four key Smartlook features — session recordings, heatmaps, events, and funnels — so you can still try our product for free and upgrade if you feel it’s the right fit for your needs.
Try Smartlook for free today
You can create a free Smartlook account today (no credit card required) and start analyzing your visitors’ behavior with the help of session recordings, events, funnels, and heatmaps.
Our tool can be used on websites built with popular CMSs like WordPress, Joomla, and Shopify, while also supporting integrations with A/B testing tools, analytics solutions, CRMs, and much more. Setting up Smartlook on your site is as easy as pasting a code snippet (directly or via Google Tag Manager).
Plus, Smartlook is also available for native mobile apps. We have SDKs for 10 mobile app platforms, frameworks, and engines — including iOS, Android, React Native, Flutter, and Unity. We have detailed documentation to guide you through the implementation, but if you get stuck or have any questions, our Support team is ready and waiting.
For an in-depth Smartlook presentation that’s tailored to your business, schedule a demo with our team.