Smartlook and Hotjar can both help you analyze the behavior of users on your website. While both tools have overlapping features (they’re best known for their session recordings and heatmaps) and require a similar amount of setup, they have many crucial differences. Specifically:
- Smartlook can be used on websites and native mobile apps, while Hotjar is not compatible with mobile apps. Smartlook has SDKs for 10 native mobile app platforms, frameworks, and engines — including iOS, Android, React Native, Flutter, Unity, and Unreal Engine.
- Smartlook tracks all user interactions (i.e., events) on your website automatically, once our code snippet is installed. With Hotjar, you have to write JavaScript code and use the Event API to track events.
- With Smartlook, you can build funnels to analyze the user journey through your website and calculate conversion rates. Hotjar retired their Forms and Funnels feature in 2020.
- Hotjar lets you ask visitors about their experience via surveys and user feedback features. In contrast, Smartlook focuses on revealing the entire user journey with everything users do in it and helping you understand the context behind their behavior (which surveys can’t do due to their limitations) with features like events, funnels, and retention tables.
These differences have an immense impact on your ability to analyze what your website’s users do and why they do it.
In this article, we’ll go through some important practical implications of Smartlook and Hotjar’s differences. We’ll also show you the areas where both tools overlap.
Here’s everything we’ll cover:
- Collecting user interaction data and defining events
- Using events to find relevant session recordings fast
- Building and analyzing funnels to track the user journey through your website and calculate conversion rates
Smartlook and Hotjar head-to-head feature comparison
- #1 Automatic session recording capture and filters
- #2 User identification API
- #3 Heatmaps
Smartlook and Hotjar pricing plans comparison
If you want to start analyzing user behavior on your website or mobile app as soon as possible, sign up for a free Smartlook account. Our tool can help you see what users do, where they click, which pages or screens they visit, and much more.
Smartlook vs Hotjar: The differences in tracking business-critical user interactions (events) with each tool
One of the biggest differences between Smartlook and Hotjar is the way each tool lets you track user interactions, like button clicks or text inputs.
While both tools call these interactions “events”, their event tracking setup and the ways you can utilize user interaction data are vastly different. This affects your ability to find relevant session recordings fast and analyze your users’ behavior in-depth.
More specifically, having user interaction data is practical in a few common scenarios:
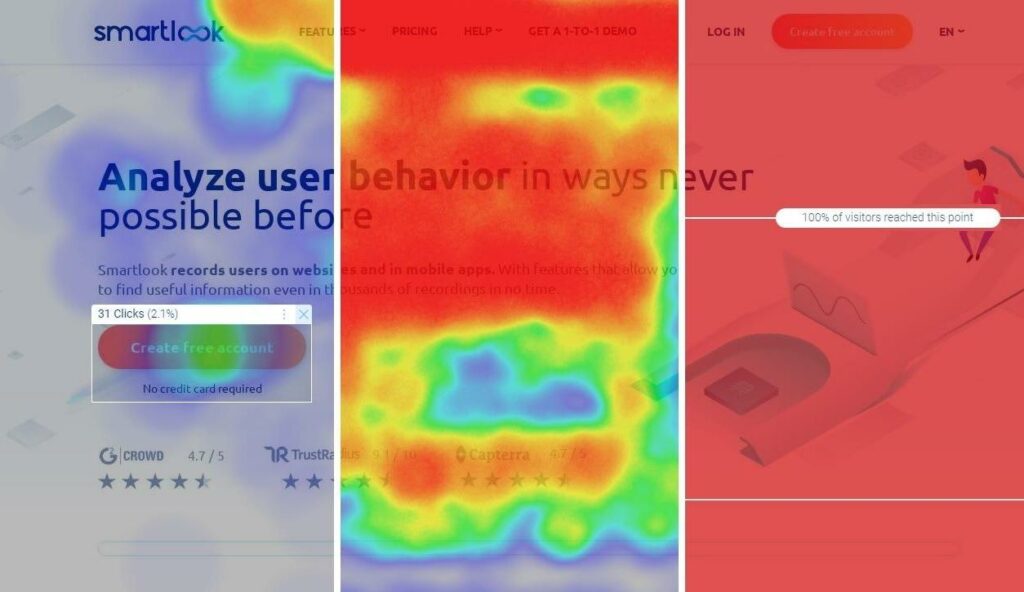
- You need to perform quantitative analysis to answer questions like “How many visitors clicked the CTA on my homepage” or “What percentage of visitors fill out part of my website’s checkout form before dropping off?”
- You need to filter session recordings based on an event that took place in them. Let’s say you want to watch only recordings of users who clicked on your site’s “Buy now” button. Being able to filter sessions based on events (in this case, a button click event) lets you find relevant sessions much faster, instead of watching hours of videos.
- You need to build funnels — sequences of steps users take on your website before completing a goal — and calculate conversion rates. For example, you can build a checkout funnel to find out what percentage of visitors who added an item to their cart (Event 1) and started filling out the checkout form (Event 2) completed their purchase (Event 3).
With that in mind, let’s compare the options each tool gives you for collecting user interaction data and defining events, finding specific session recordings, and analyzing funnels.
Collecting user interaction data and defining events
Smartlook automatically starts recording all user sessions and all user interactions after our code snippet is installed.
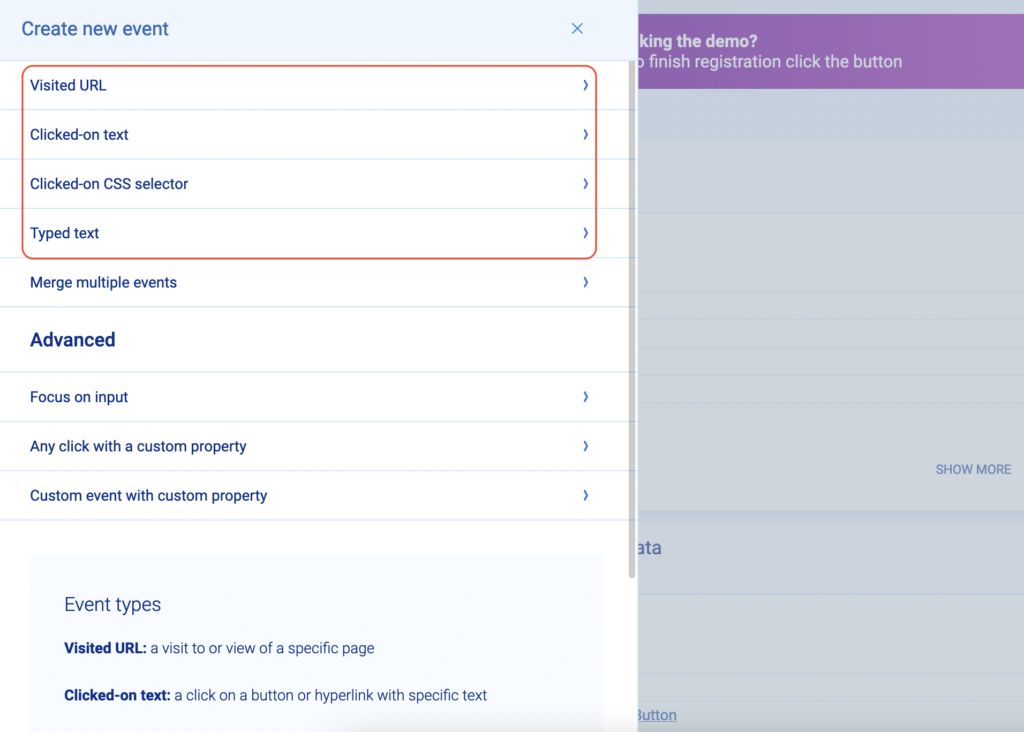
This mechanism ensures you always have valuable user behavior data at your fingertips. You can then turn the collected user interactions into events — a process called defining an event — without programming. You can do this in three ways:
- Choose from a list of standard events, including clicked on URL, clicked on text, typed text, clicked-on CSS selector (allowing you to select any element in the page).
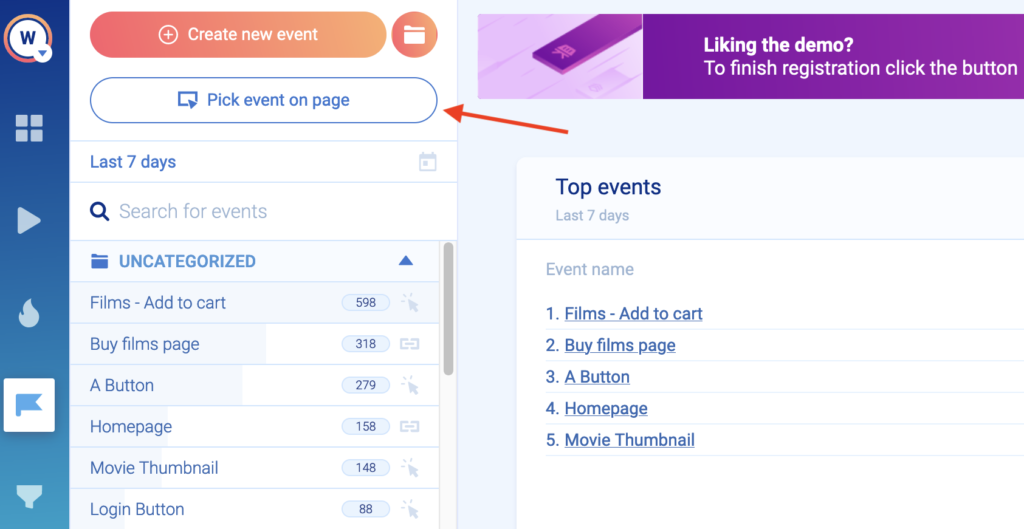
- Use the no-code event picker. When you click on the button that says “Pick event on page” (see screenshot below), you’ll be taken to your web page where you can define an event by clicking on elements in the user interface of your website or web app.
- Define an event from a recording. Again, Smartlook’s session recordings capture every action visitors do. If you see an action that would be useful to track, you can pause the recording and make that action into an event without leaving the replay.
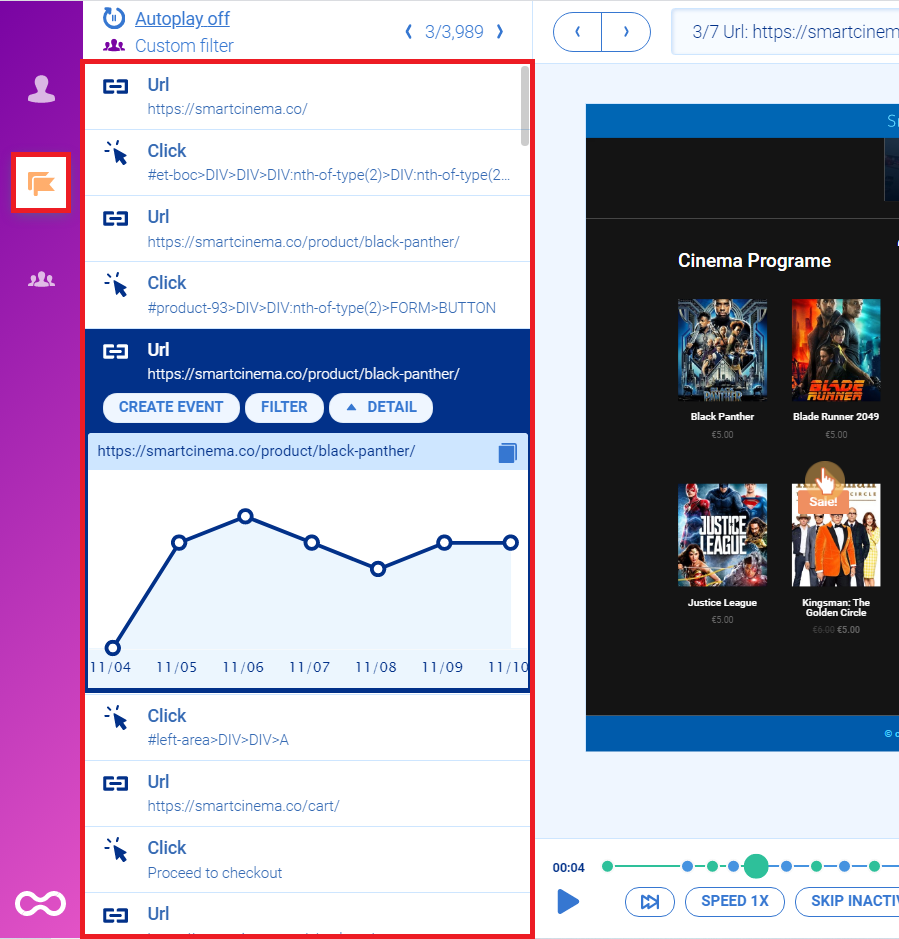
Once you define an event, Smartlook instantly identifies every instance of that event, going back as far as your data retention plan goes. As a result, the event tracking visualization appears instantly, like in the GIF below.
You can try this process yourself with our free public demo (no registration or credit card required).
You can also create custom events via JavaScript to track pretty much anything else outside of the standard events. For mobile apps and games, most user actions are typically tracked via custom events.
In contrast, event tracking in Hotjar is always done by writing custom JavaScript code and using Hotjar’s event API. You’ll need consistent help from a developer to track user interactions like button clicks or text inputs and pass them to Hotjar. This makes the setup and maintenance much more difficult and time-consuming.
Using events to find relevant session recordings fast
As we said in the beginning, Smartlook and Hotjar are probably best known for their session recordings.
However, just having recordings doesn’t make it easy to get valuable insights from them. You need to be able to filter session replays based on specific events (like button clicks or text inputs) so you can locate relevant ones fast. Without this ability, you may have to sift through hours of session recordings without any guarantee of finding anything useful.
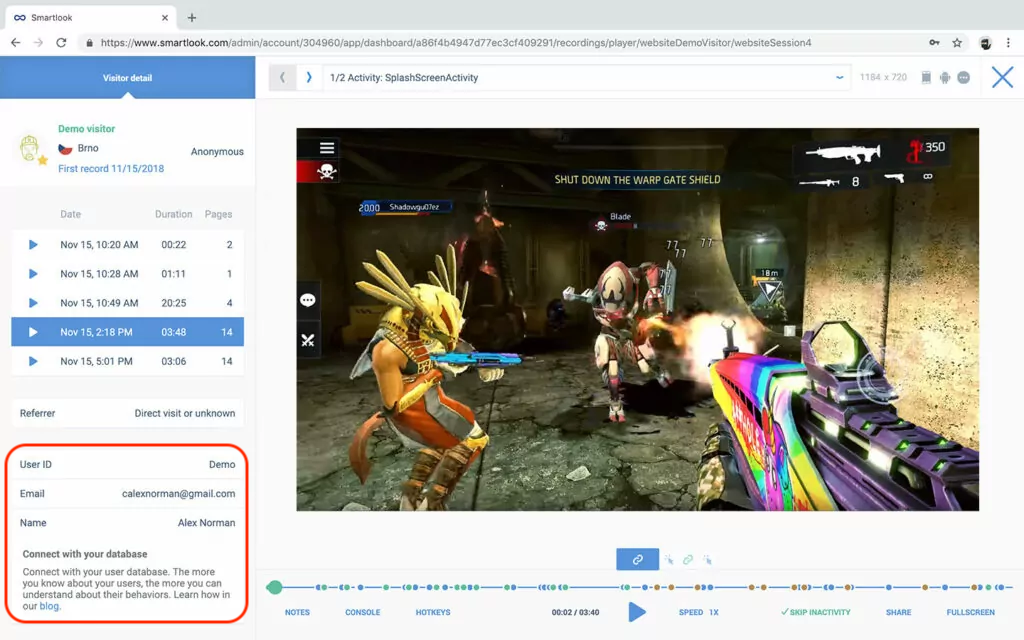
With Smartlook, when you open an event, you can see a “Play” button under the data visualization.
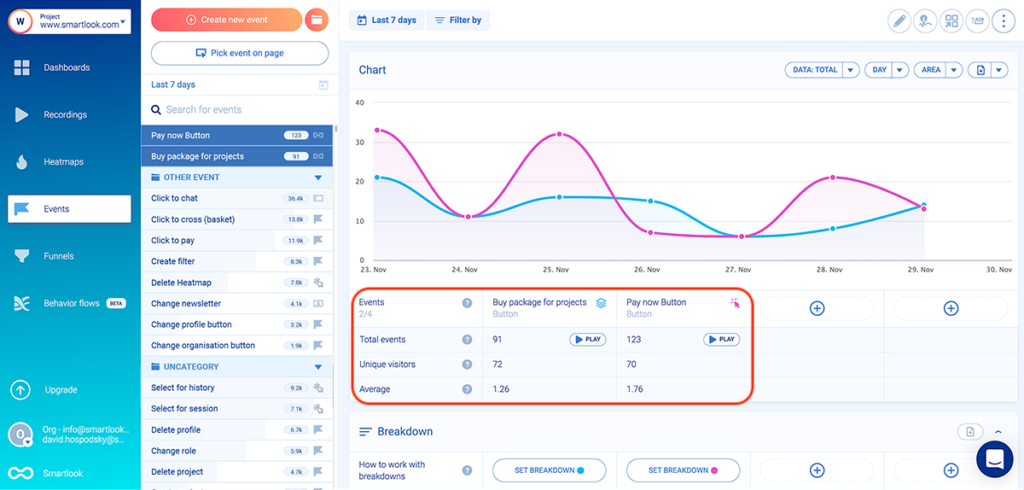
Clicking that button takes you directly to the session recordings in which this event took place. In the example above, you can watch all users who completed the “Buy package for projects” event or the “Pay Now Button” event.
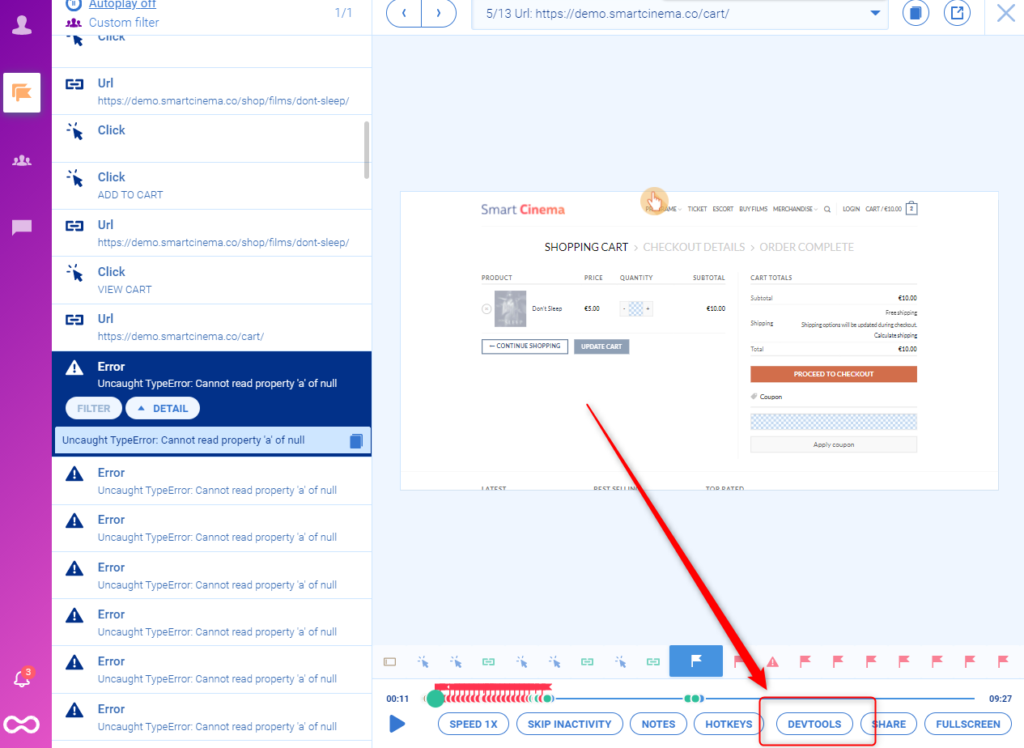
The events feature is also very useful for finding frustrating elements or debugging your website. In fact, Smartlook tracks rage clicks and JavaScript errors as events by default.
You can instantly identify the sessions where an error took place and send the session recordings to your developers. And developers can get more information about the error and speed up the debugging process by clicking on the “DevTools” button.
In short, the ability to combine events with session recordings is one way to tie what users do (i.e., button clicks, text inputs, etc) to why they do it.
Hotjar also lets you use events to filter session recordings. But again, the difference is in the way Hotjar handles event tracking setup and maintenance, both of which require developer assistance.
Similar to Smartlook, Hotjar tracks rage clicks by default, so you can use the rage click event to filter recordings. However, Hotjar doesn’t track JavaScript errors.
Building funnels to analyze the user journey through your website and calculate conversion rates
In the context of web analytics, funnels are sequences of events users go through to complete a goal, like purchasing a product, finishing an onboarding tutorial, or signing up for a newsletter.
Building funnels lets you analyze users’ behavior through these crucial steps, find out where users drop-off, and calculate conversion rates.
In Smartlook, you can create a funnel by placing two or more events in the order you believe your users follow, with the funnel being instantly visualized.
Once you have a funnel, you can see its overall conversion rate, as well as the conversion rates and drop-offs between each step.
And since funnels are just sequences of events, you can build all different kinds, depending on your business goals and users’ behavior.
For example, an e-commerce store may want to track the customer journey from landing on the homepage, through searching for an item and completing the purchase. In Smartlook, you can build such a conversion funnel with five events, without any coding using our no-code event picker or our drop-down event list:
- Event 1: A homepage visitor clicks on the shop (select the button with our no-code picker to define the event).
- Event 2: The visitor searches for an item (use the “Typed text” event).
- Event 3: The visitor clicks “Add to cart” (select the button with our no-code picker to define the event).
- Event 4: They click on the “Pay Now” button (again, select that button with the no-code event picker).
- Event 5: They land on the “Thank you” page (use the “Visited URL” standard event and enter the page URL).
Or, if you want to track how many of your blog visitors sign up for your newsletter, you can build the following four-step funnel, again, without coding:
- Event 1: Users arrive on the landing page (use the “Visited URL” event and include all pages containing the word “blog”).
- Event 2: They fill out the form field for entering their email address (use the “Typed text” event. With this event, you can also track when users enter text containing the @ symbol.).
- Event 3: Users click the CTA button (select the button with our no-code picker).
- Event 4: They get a confirmation or arrive on a “Thank you” page (use the “Visited URL” event and enter the page URL).
While this capability to build a funnel and see where users drop-off is powerful, Smartlook doesn’t stop there.
Our tool also lets you combine funnel analysis with session recordings to find why users drop off.
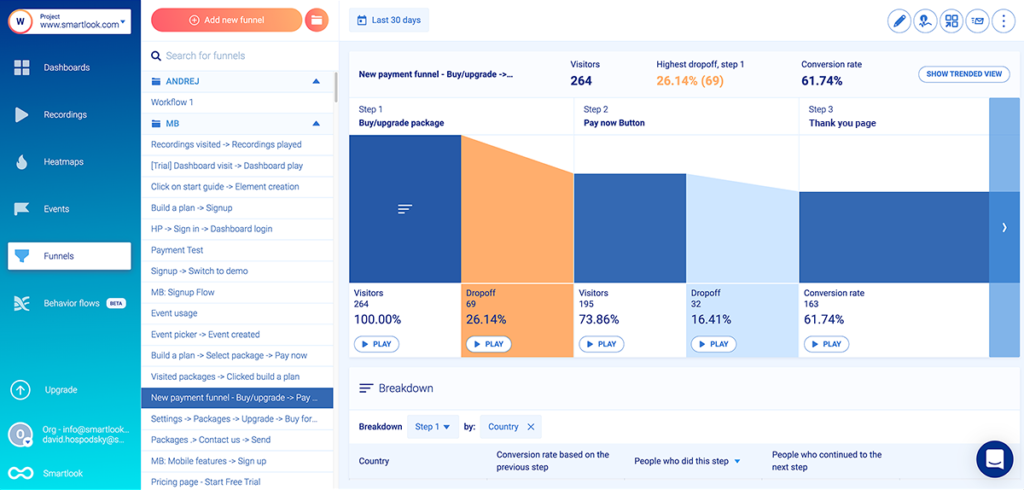
As you can see, the screenshot above shows a funnel where 32 users (16.41%) drop off between clicking “Pay now” and landing on the thank you page. Similar to the events section, there’s a “Play” button under each step of the funnel, including the drop-off stages.
Clicking the “Play” button under that drop-off stage (between steps two and three) takes you to the session recordings of these 32 users, so you can find out why they dropped off. You don’t have to sift through all 195 recordings of users who clicked “Pay now”.
One of our clients used this process to discover that users were abandoning their orders because shipping prices were too high. Once they implemented changes based on their findings, orders increased by 161%, bringing in half a million dollars more in yearly revenue.
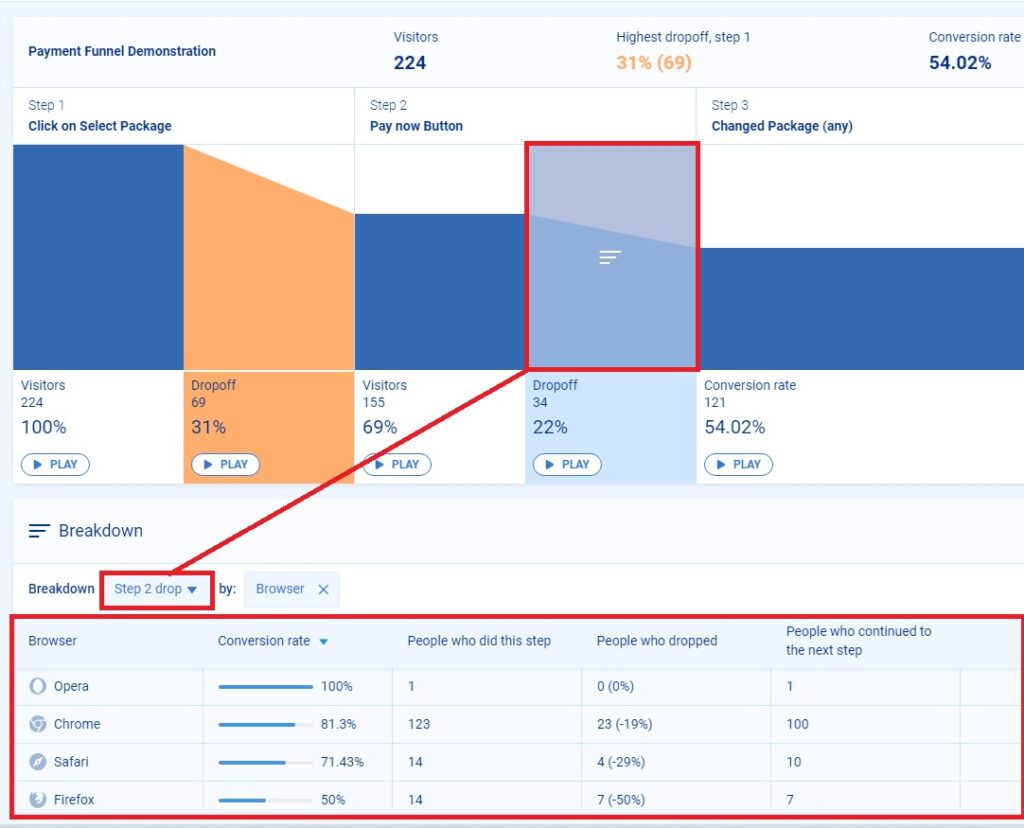
Besides finding relevant recordings fast, you can also break down every step of the funnel or the entire funnel by specific properties to find even more valuable insights.
Here’s how:
When you hover over a step in the funnel, you’ll see a “Break down funnel” text appear, like in the screenshot below.
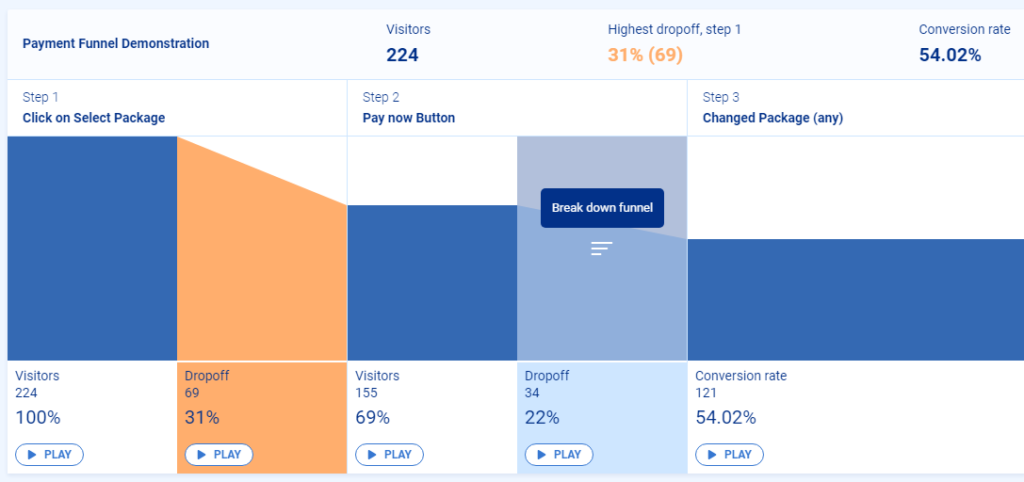
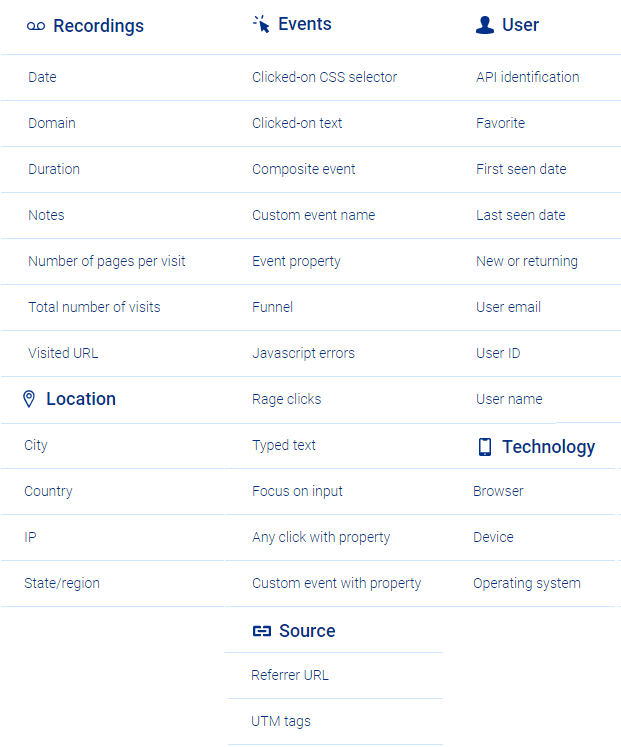
Once you click it, you’ll be able to select from different parameters such as country, device, browser, operating system, and more. When you select a property (in the example below — browser), a breakdown table will appear below the funnel.
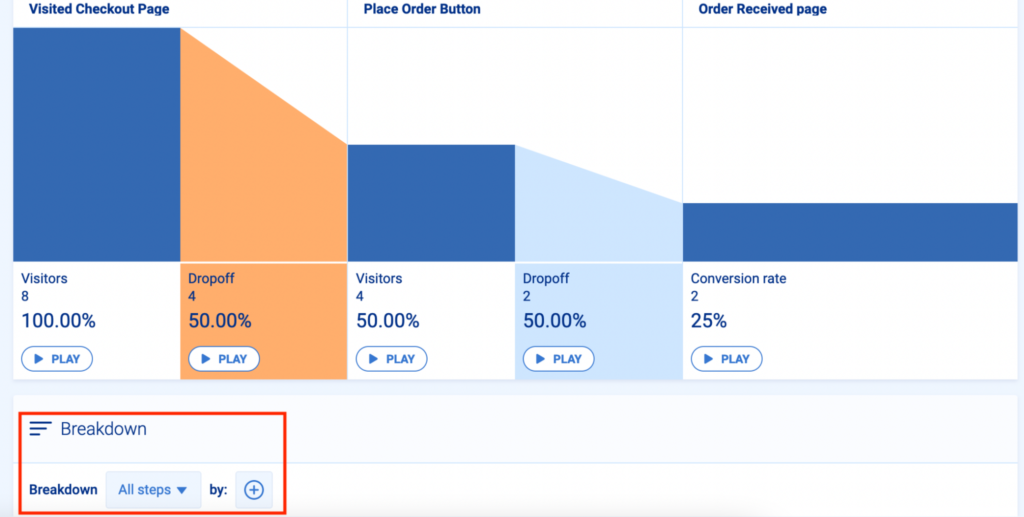
You can also break down the entire funnel by selecting “All steps” in the “Breakdown” section below the funnel and clicking the “+” button to select a property.
Lastly, you (or your development team) can further customize your analysis to your needs by creating your own custom properties, which let you log specific data for every event.
As we mentioned before, Hotjar retired their Forms and Funnels feature back in 2020.
Because of that, Hotjar now advises clients to use their screen recordings and heatmaps in combination with Google Analytics for funnels. However, this method for finding and solving customer experience and usability issues is slow and inefficient.
First, you have to build out your events and funnels in Google Analytics to see what’s happening on your website. Then, you have to watch user recordings and heatmaps in Hotjar to try and find out why it’s happening.
The big problem is that there’s no quick way to learn why users are dropping off. There’s no way to pinpoint users who didn’t convert and watch only their sessions. At best, you can use Google Analytics to identify the URL or button click that preceded the largest drop-off, and then filter sessions in Hotjar for that URL or button click. But filtering for that step will still give you sessions that advanced beyond the step, so you’ll have to watch hours of unnecessary recordings to find enough examples of drop-offs to draw any conclusions.
Hotjar even advises their users to “book a recurring 2-hour slot in your calendar every couple of weeks, so you get into the habit of watching regularly.” Clearly, this is tedious or even impossible for people who can’t spare that much time. There’s also no guarantee of finding anything useful.
That’s why one of our clients (StoragePug) started looking for Hotjar alternatives after the removal of Funnels feature.
StoragePug actually used Smartlook to find and resolve a critical issue fast. After a recent release, they noticed that the site had stopped receiving orders. In the past, when the team had only had access to quantitative analytics tools, they’d have to wait a few days to gather enough data to confirm that something was wrong and start investigating. But with Smartlook, they were able to watch a few relevant session replays within a few hours of the release, which showed that the UI wasn’t rendering properly. As a result, their product manager was able to show the issue to the engineers, who resolved it right away.
It’s worth noting that Hotjar decided to retire these features to focus on their other functionalities for understanding visitor behavior like real-time user feedback and surveys. In other words, they now provide more ways to ask users about their experience, instead of analyzing it in-depth and quantifying it.
While these surveys can be useful in some scenarios (primarily for market research), they’re often unreliable when it comes to UX research. In a lot of cases, users click on random answers to get the survey out of the way or just aren’t willing to provide feedback. And even if they provide some information on what they liked or didn’t, it’s typically not enough to get the full context behind the user experience and understand why they did what they did.
Now that we’ve covered the major differences between both tools, let’s look at where they overlap.
Smartlook and Hotjar head-to-head feature comparison: Session recordings, filters, user identification API, and heatmaps
Like most analytics solutions, Smartlook and Hotjar are both SaaS products that need to be set up by adding a code snippet into your website’s HTML.
There are different ways to do this for both tools, depending on your website’s tech stack and CMS (both tools are compatible with popular CMSs like WordPress, Shopify, and Joomla).
Both tools also have integrations with A/B testing and conversion rate optimization tools (CRO), as well as other platforms that product managers and digital marketing experts use like Google Optimize, Optimizely, or Segment.
Besides these similarities, there are three other areas where both tools overlap but have some subtle differences which can affect what you can do with them.
#1 Automatic session recording capture and filters
After they’re installed, both tools’ session recordings work in a similar way:
- Smartlook’s session recordings are always on by default, capturing every user session. You don’t need to do anything else outside of setting up Smartlook.
- Before Hotjar moved to Continuous Capture, their clients had to manually start and stop visitor recordings. However, today, Hotjar can also record all user sessions automatically as long as you enable session capture.
Smartlook and Hotjar also have some overlapping filters to help you find relevant session replays quickly — date, URL visits, new or returning visitors, country, device, operating system, referrer URL, and more. It’s worth noting that Hotjar’s free plan only allows filtering by date, while Smartlook doesn’t have such a restriction.
As we said earlier, Smartlook offers much more variety and convenience when it comes to filtering sessions based on user interactions (events), since our tool tracks these by default.
In contrast, Hotjar lets you filter recordings based on user feedback. For example, you can quickly find recordings of users who filled out your NPS survey with negative responses.
#2 User identification API
Both Smartlook and Hotjar have an Identify API, which lets you send identifying characteristics (such as a user id, name, or email) to the service.
This can be very useful for finding relevant session recordings fast.
For example, say a group of users reports a bug when they try to add an item to their cart. If you have their email or username and have connected to Smartlook or Hotjar’s API, you can jump straight into their recordings.
This capability can save your customer support and dev teams a lot of time. They don’t have to guess what went wrong because they can see it from a users’ perspective.
#3 Heatmaps
Heatmaps are the final feature that Smartlook and Hotjar share. Both tools offer three types of heatmaps for analyzing user behavior — scroll maps, move maps, and click maps.
Heatmaps are created in a similar way in both tools, as neither Smartlook nor Hotjar requires you to manually start or stop heatmap data collection.
Scrolls, clicks (or taps for mobile analytics), and mouse movements are collected by default. As long as the tools are set up correctly, heatmaps are generated automatically.
In short, both tools’ heatmaps are very similar, with the exception that Hotjar has a few more filters.
For more details on working with heatmaps, check out our guide on how to read a heatmap and get actionable UX insights.
Smartlook and Hotjar pricing plans comparison
Smartlook and Hotjar offer various pricing plans, suitable for startups and small businesses, as well as larger companies. Both tools have a free plan, two paid ones (between $55 and $99/month), and an option to create custom plans.
All Smartlook paid plans start with a 30-day trial and have a 15-day money-back guarantee. Hotjar doesn’t have a trial for their paid plans but instead offers a 30-day money-back guarantee.
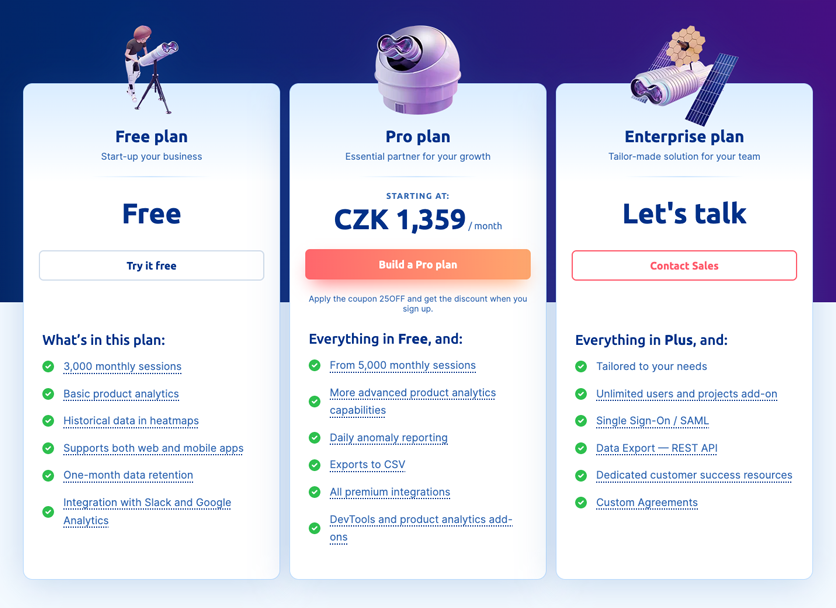
In terms of recorded sessions per month, Smartlook is more cost-effective at every price point. For example, our $55/month plan captures up to 5000 user sessions, while Hotjar’s $39/month plan captures 100 user sessions per day (roughly 3000/month).
On the other hand, Hotjar stores data for longer periods of time compared to Smartlook in the lower pricing ranges.
Hotjar stores data for 365 days for all plans, while Smartlook stores data between two and 12 months. However, this period can be increased for clients on our Business and Ultimate plans.
Also, clients on these plans can use our session vault, which lets them save selected recordings longer than their plan’s data retention period. That way, you can store recordings with useful insights for long periods of time and refer back to them when you need to.
If you want to see how Smartlook compares to other popular session recording tools — like FullStory, CrazyEgg, Mouseflow, and Lucky Orange — check out our article on the top 8 session replay tools for fixing UX issues. You can also check out our article on Hotjar alternatives for website and mobile app analytics, for a list of tools that have Hotjar’s most popular features — heatmaps, screen recordings, and surveys.
Get Smartlook today and capture every user interaction on your website or mobile app automatically
You can sign up for a free Smartlook account (no credit card required) and immediately start analyzing the user behavior on your website or mobile app. Our tool combines the power of quantitative and qualitative analytics, so you can track what users do on your website and uncover why they do it.
If you want to see a Smartlook presentation that’s tailored to your business, schedule a demo with our team.